

Abstract
Paracrine communication between different parts of the renal tubule is increasingly recognized as an important determinant of renal function. Previous studies have shown that changes in dietary acid-base load can reverse the direction of apical α-ketoglutarate (αKG) transport in the proximal tubule and Henle’s loop from reabsorption (acid load) to secretion (base load). Here we show that the resulting changes in the luminal concentrations of αKG are sensed by the αKG receptor OXGR1 expressed in the type B and non-A–non-B intercalated cells of the connecting tubule (CNT) and the cortical collecting duct (CCD). The addition of 1 mM αKG to the tubular lumen strongly stimulated Cl–-dependent HCO3– secretion and electroneutral transepithelial NaCl reabsorption in microperfused CCDs of wild-type mice but not Oxgr1–/– mice. Analysis of alkali-loaded mice revealed a significantly reduced ability of Oxgr1–/– mice to maintain acid-base balance. Collectively, these results demonstrate that OXGR1 is involved in the adaptive regulation of HCO3– secretion and NaCl reabsorption in the CNT/CCD under acid-base stress and establish αKG as a paracrine mediator involved in the functional coordination of the proximal and the distal parts of the renal tubule.
Introduction
α-Ketoglutarate (αKG) is an intermediate of the citric acid (TCA) cycle, an important anaplerotic substrate and a cofactor in a variety of enzymatic reactions. In addition to its direct effects on metabolic pathways, αKG was identified as a natural ligand to a GPCR, namely GPR99, which is also known as 2-oxoglutarate receptor 1 (OXGR1) (1). OXGR1 belongs to a cluster of so-called “metabolic” GPCRs, which also includes receptors for succinate (GPR91), lactate (GPR81), 3-hydroxy-octanoate (GPR109B), nucleotides (P2Y), fatty acids (FFAR), lipids (P2RY, CysLT, Oxer1, etc.), phospholipids (PAF), protease-activated receptors (PAR), and several orphan receptors (2). He et al. have shown that OXGR1 is a Gq-coupled GPCR that is predominantly expressed in distal tubules in the kidney (1). However, the functional role of OXGR1 has not been studied.
Previous studies in rats demonstrated that renal handling of αKG changes significantly in response to changes in acid-base status (3–5). αKG is freely filtered in the glomerulus and, under normal conditions, actively reabsorbed in the proximal tubule and Henle’s loop. Acid load further stimulates αKG reabsorption, thus resulting in a drop in urinary output of αKG. Under base loading conditions, the blood concentration of αKG rises and net αKG reabsorption in the proximal tubule and Henle’s loop is converted to net αKG secretion in the same nephron segments (3–5). This results in a significant increase in the urinary excretion of αKG. It has been proposed that excretion of αKG and other organic anions (e.g., citrate) in the urine represents the loss of “potential HCO3–,” which provides the advantage of minimizing bicarbonaturia under alkali load (6). The latter is important because it allows the excretion of base at a lower urinary pH, thereby diminishing the risk of nephrolithiasis due to the formation of calcium-phosphate precipitates [αKG: pKa1(1.9), pKa2(4.4); bicarbonate: pKa1(6.1); HPO42–: pKa2(6.7–6.8)] in the urine (5, 7). Collectively, these results demonstrated that acid-base status is a major factor determining blood levels of αKG and the rate of αKG excretion into urine. Importantly, Ferrier et al. have shown that there is no net transport of αKG beyond the beginning of the distal tubule accessible to micropuncture (3). This indicated that variations in the urinary αKG concentration are directly proportional to the variations in the luminal levels of αKG in the connecting tubule/cortical collecting duct (CNT/CCD), in which OXGR1 is expressed (see below). Taken together, these data led us to hypothesize that OXGR1 could be involved in the apical and/or basolateral sensing of acid-base status through the sensing of αKG concentrations in the tubular fluid and/or in the blood.
Testing this hypothesis revealed that luminal OXGR1 regulates Cl–-dependent HCO3– secretion and electroneutral transepithelial NaCl reabsorption in the type B and non-A–non-B intercalated cells of the CNT/CCD. We show that this regulation is functionally important since mice devoid of OXGR1 exhibited a reduced capacity to maintain acid-base equilibrium under base load conditions. We hypothesize that OXGR1-mediated NaCl reabsorption in the type B and non-A–non-B intercalated cells is required to compensate for the increased or decreased activity of sodium-hydrogen exchanger 3 (NHE3) in the proximal tubule and Henle’s loop under acid or base loading conditions, respectively. Collectively, our results show for the first time that the kidney possesses a paracrine mechanism involved in the control of acid-base balance. In this mechanism, αKG acts as a paracrine mediator between the proximal and the distal parts of the renal tubule.
Results
To identify renal cell types expressing OXGR1, we used mice whose Oxgr1 gene was deleted and replaced with a reporter gene encoding β-galactosidase (LacZ). X-gal staining on kidney sections demonstrated patchy expression of OXGR1 in cortical tubules (Supplemental Figure 1, A and B; supplemental material available online with this article; doi: 10.1172/JCI67562DS1). Costaining with a panel of cell type–specific markers revealed that OXGR1 colocalizes at the cellular level with pendrin, a Cl–/HCO3– exchanger that is exclusively expressed at the apical membrane of the type B and non-A–non-B intercalated cells of the CNT and the CCD (Figure 1). This specific cellular localization was validated by the absence of costaining with parvalbumin (a marker of the early distal convoluted tubule; Supplemental Figure 1, C–E), the sodium chloride cotransporter (NCC) (a marker of the early and late distal convoluted tubule; Supplemental Figure 1, F–H), the β subunit of the amiloride-sensitive epithelial sodium channel (ENaC) (a marker of the late distal convoluted tubule and the principal cells of the CNT and the CCD; Supplemental Figure 1, I–N), aquaporin-2 (a marker of principal cells of the CNT and the CCD; Supplemental Figure 1, O–T), and anion exchanger 1 (AE1) (a marker of type A intercalated cells of the CNT and the CCD; Supplemental Figure 1, U–Z). The type B and non-A–non-B intercalated cells in the CNT and the CCD are involved in the control of systemic acid-base homeostasis, extracellular fluid volume, and blood pressure (reviewed in refs. 8–10). Pendrin participates in these functions by controlling HCO3– secretion and electroneutral Na+-Cl– reabsorption (upon functional coupling with Na+-driven Cl–/HCO3– exchanger NDCBE (Slc4a8) (11) and by regulating Na+ reabsorption in the adjacent principal cells (12).
Figure 1. OXGR1 is expressed in type B and non-A–non-B intercalated cells of the CNT and the CCD.

(A) Immunostaining with anti–β-galactosidase antibody (green) shows that OXGR1 is expressed in a subset of cells in the renal cortex. (B) Immunolocalization of pendrin (red) in the apical membrane of type B and non-A–non-B intercalated cells. (C) Coimmunostaining with anti–β-galactosidase and anti-pendrin antibodies demonstrates that OXGR1 and pendrin are expressed in the same cells. Higher-magnification views of images in A–C are shown in D–F, respectively. Nuclei (DNA) are stained with DAPI (blue, C and F). Scale bars: 50 μm.
To examine whether αKG is capable of regulating apical Cl–/HCO3– exchange activity, we determined the activity of pendrin in intercalated cells of isolated CCDs by measuring the rate of intracellular acidification induced by the addition of luminal Cl– (forward activity) or alkalinization following Cl– removal (reverse activity). As shown in Figure 2A, addition of 1 mM αKG to the luminal perfusion solution increased the rate of Cl–/HCO3– exchange in intercalated cells of CCDs from Oxgr1+/+ mice but not Oxgr1–/– mice, although the exchanger displayed a similar baseline activity in the two mouse strains. A representative trace depicting the effect of 1 mM αKG on intracellular pH in intercalated cells of the CCD is shown in Supplemental Figure 2. Western blot analysis demonstrated that pendrin protein abundance was not different between Oxgr1+/+ and Oxgr1–/– mice (Supplemental Figure 3, A and D).
Figure 2. Activation of OXGR1 stimulates pendrin and induces NaCl reabsorption in CCD.

(A) Apical Cl–/HCO3– exchange activity was measured in intercalated cells from CCDs isolated from wild-type and Oxgr1–/– mice in the absence or the presence of 1 mM αKG in the luminal fluid. The exchanger activity was determined either in the forward (Cl– addition induces intracellular acidification) or reverse direction (Cl– removal induces intracellular alkalinization). Values are mean ± SEM from 3 CCDs, and the exchange activity was measured on at least 3 cells per CCD. dpHi/dt, initial rate of change in cell pH. P values are shown in comparison with controls (absence of αKG) (Student’s t test). (B) Na+ and Cl– reabsorption fluxes (JNa+ and JCl–, respectively) measured in in vitro–microperfused CCDs from wild-type and Oxgr1–/– mice were determined in the absence or presence of 1 mM αKG in the luminal (L) or peritubular (B) solution. Some CCDs were pretreated with 100 μM hydrochlorothiazide (HCTZ) or 10 μM amiloride (Am). Note that in absence of αKG, CCDs from wild-type mice displayed no NaCl transport whereas those from Oxgr1–/– mice showed amiloride-sensitive Na+ reabsorption that was inhibited upon addition of αKG. Values are mean ± SEM from 4 to 6 CCDs. P values are shown in comparison with controls (absence of αKG) (variance analysis [ANOVA]).
Next, we evaluated whether stimulation of luminal Cl–/HCO3– exchange was associated with increased electroneutral NaCl reabsorption. Using in vitro microperfusion of CCDs from Oxgr1+/+ mice, we found that addition of 1 mM αKG to the tubular lumen induced an equimolar reabsorption of Na+ and Cl– whereas basolateral αKG had no effect (Figure 2B). αKG-induced reabsorption of NaCl was markedly reduced by hydrochlorothiazide, an inhibitor of the electroneutral component of sodium reabsorption in the CCD. Interestingly, CCDs from Oxgr1–/– mice displayed baseline Na+ but not Cl– transport, which was abolished by the ENaC inhibitor amiloride. Luminal addition of αKG did not increase electroneutral NaCl reabsorption in CCDs from Oxgr1–/– mice but abolished ENaC-mediated Na+ reabsorption (Figure 2B). Western blot analysis revealed an increase in abundance of αENaC (Oxgr1+/+: 100 ± 7 arbitrary units [SEM, n = 6] vs. Oxgr1–/–: 136 ± 5 arbitrary units [SEM, n = 6], P = 0.003; Supplemental Figure 3, B and D) but not in abundance of βENaC subunit (Supplemental Figure 3, C and D).
Altogether, these results demonstrate that activation of luminal OXGR1 by αKG stimulates pendrin activity and electroneutral reabsorption of NaCl by type B and non-A–non-B intercalated cells. They also suggest that ENaC activity is increased in the knockout mice and that luminal αKG may inhibit ENaC independently of OXGR1.
Next, we assessed whether challenges of acid-base or NaCl homeostasis cause changes in the luminal levels of αKG in the CNT/CCD or in the systemic circulation in mice. Wild-type C57BL/6 mice housed in metabolic cages were challenged with an oral acid, alkali, or NaCl load (0.3 M NH4Cl, 0.28 M NaHCO3, or 0.28 M NaCl in drinking water, respectively) for 1, 3, 5, or 7 days. αKG levels were measured in 24-hour urine samples or in serum samples collected at the end of the experiment. As shown in Figure 3A and Supplemental Figure 4A, the acid load induced a striking decrease in urinary [αKG]/[creatinine] ratios and urinary αKG concentrations, respectively, whereas base load resulted in an opposite pattern, with a significant increase in urinary αKG levels. The changes in urinary αKG levels were parallel to changes in urinary pH (Supplemental Figure 4B). At the same time, addition of NaCl to drinking water did not produce any effect on urinary αKG levels (Figure 3A and Supplemental Figure 4A). Importantly, none of the dietary supplements had a significant effect on plasma αKG concentration, even though there was a tendency for increased αKG concentration in mice loaded with NaHCO3 (Figure 3B). To test whether base load can produce more rapid (<24 hours) effects on urinary αKG levels and to assess the threshold dose of base capable of increasing αKG concentrations in urine, mice were gavaged with 400 μl solution containing various concentrations of NaHCO3. Spot urine was collected 3 hours after gavage. As control groups, mice gavaged with 400 μl of either water or 0.56 M NaCl were used. As shown in Figure 3C, mice gavaged with water or 0.56 M NaCl excreted similar amounts of αKG in the urine. Base load induced a significant increase in both urinary pH and αKG/creatinine ratios when compared with those in mice gavaged with water or NaCl controls (Figure 3C). Importantly, these changes reached statistical significance already at low doses of NaHCO3 (22.4 μmol NaHCO3 for αKG/creatinine ratio and 44.8 μmol NaHCO3 for urinary pH). Collectively, these results demonstrated that the challenge of mice with acid-base but not NaCl load can produce rapid and significant effects on urinary αKG levels.
Figure 3. Effects of a dietary load of acid, base, or NaCl on urinary and plasma levels of αKG.

(A) Analysis of [αKG]/[creatinine] ratios in urine collected from wild-type mice housed individually in metabolic cages. The 24-hour urine was collected from 4 groups of mice (6 mice per group): a control group receiving tap water (green) and groups supplemented with acid (0.3 M NH4Cl; blue), base (0.28 M NaHCO3; red), or salt (0.28 M NaCl; purple) in drinking water. Values are mean ± SEM. **P < 0.005, compared with 0.28 M NaCl group; ##P < 0.005, compared with H2O group; Student’s t test. (B) Analysis of plasma αKG concentrations in wild-type mice loaded for 7 days with acid (0.3 M NH4Cl; blue), base (0.28 M NaHCO3; red), or salt (0.28 M NaCl; purple) in drinking water. Mice in the control group received tap water (green). Values are mean ± SD (n = 6–9); Student’s t test. (C) Analysis of urinary [αKG]/[creatinine] ratios (red bars) and urinary pH (gray bars) in spot urine of wild-type mice gavaged with 400 μl of tap water, 400 μl of 0.56 M NaCl, or 400 μl of NaHCO3 at different concentrations (0.0056 M, 0.056 M, 0.112 M, 0.224 M, and 0.448 M). The urine was collected 3 hours after gavage. Values are mean ± SEM. **P < 0.005, compared with water group; ##P < 0.005, compared with 0.56 M NaCl group; #P < 0.01, compared with 0.56 M NaCl group. P values are shown in comparison with controls (variance analysis [ANOVA]).
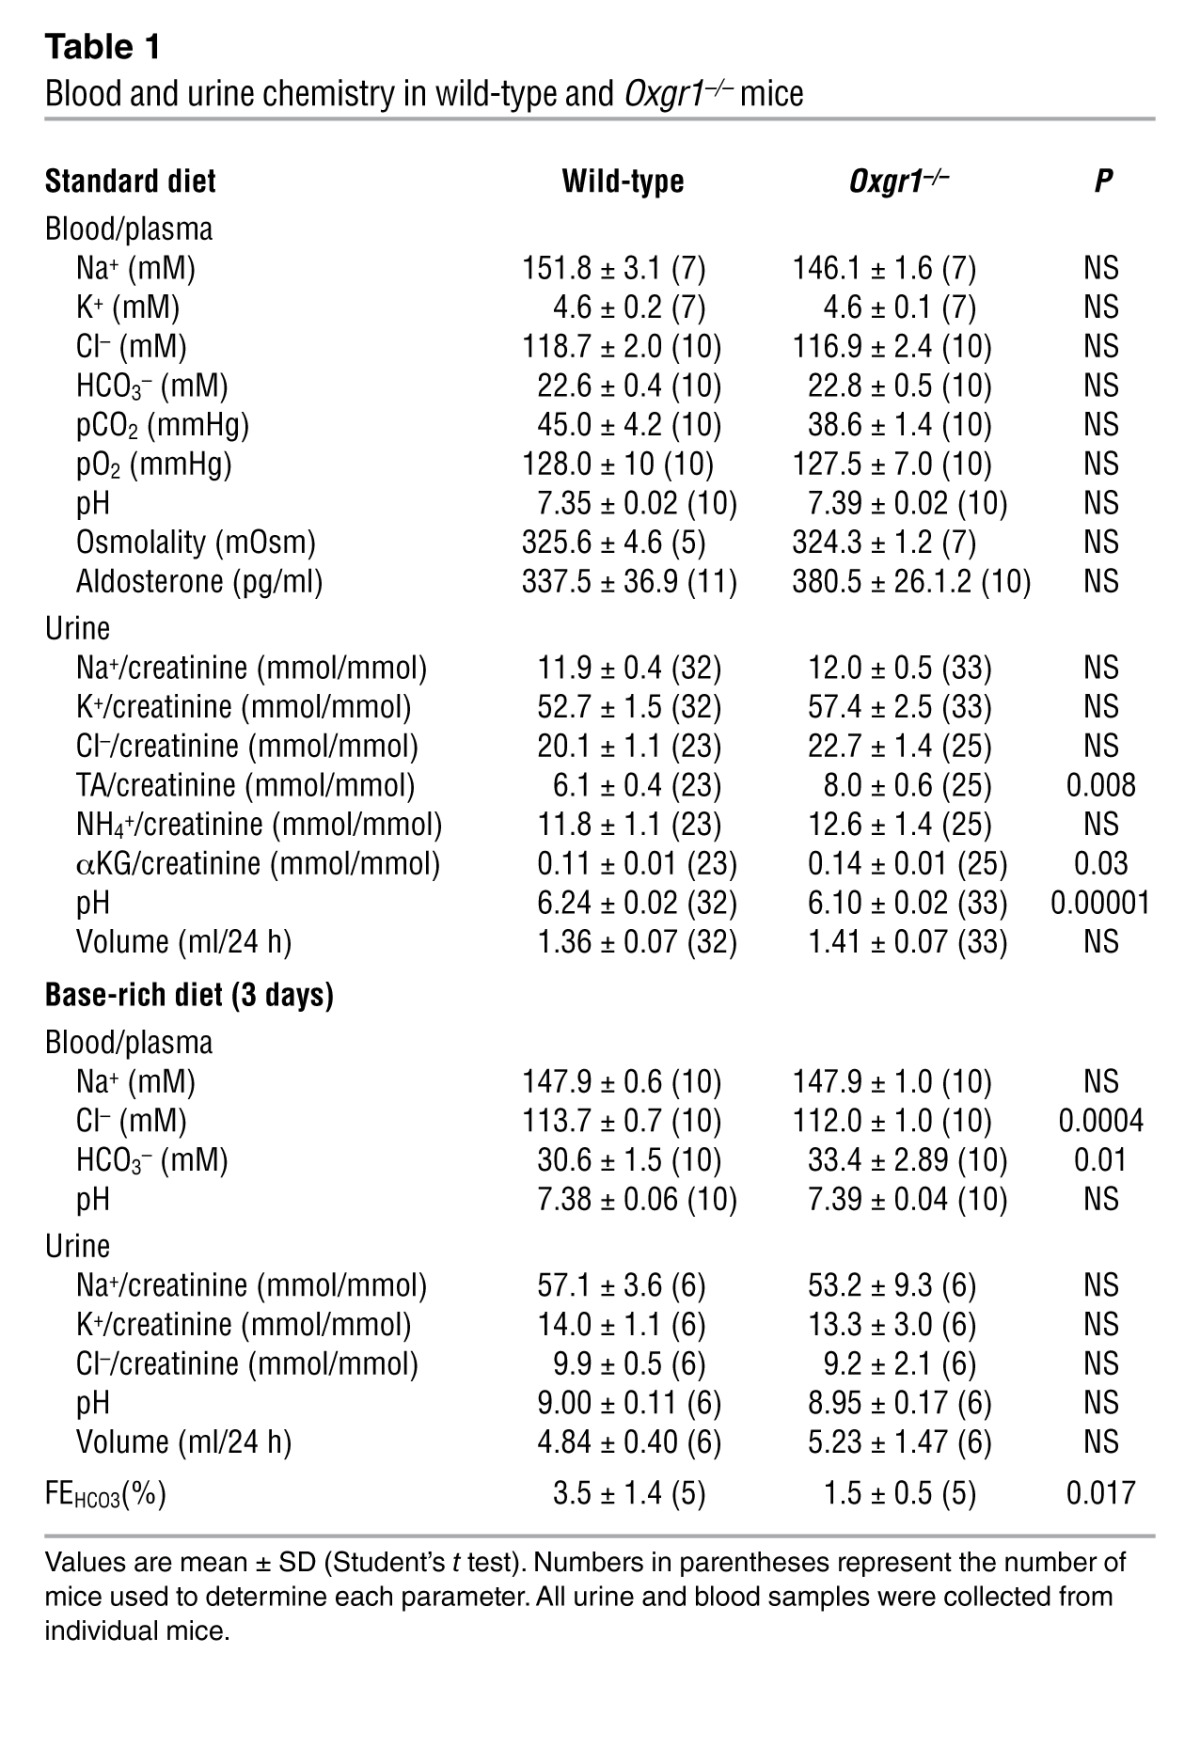
To test whether deficiency of OXGR1 could affect acid-base equilibrium, we analyzed urine and blood samples of wild-type and Oxgr1–/– mice. As shown in Table 1, Oxgr1–/– mice fed standard diet had a small but statistically significant decrease in urine pH and a statistically significant increase in urinary titratable acid and αKG levels. These results suggested that the acid-base equilibrium might be disturbed in Oxgr1–/– mice. However, blood chemistry parameters were not different between wild-type and Oxgr1–/– mice (Table 1). Thus, we tested the role of OXGR1 in the condition of experimentally induced alkalosis. As shown in Table 1, both wild-type and Oxgr1–/– mice given a NaHCO3-rich diet for 3 days (see Methods) developed a metabolic alkalosis with plasma HCO3– levels raised above 30 mM. However, the increase in plasma HCO3– levels was significantly higher in Oxgr1–/– mice. Tubular handling of bicarbonate under alkali load was examined in a separate experiment by assessing its fractional excretion (FEHCO3). As shown in Table 1, the FEHCO3 was more than 2-fold lower in Oxgr1–/– mice compared with that in wild-type mice, thus suggesting an inappropriate renal/tubular response in Oxgr1–/– mice to the alkali load. Collectively, these results indicated that renal mechanisms responsible for maintaining acid-base equilibrium upon alkali load are impaired in Oxgr1–/– mice. The fact that plasma Cl– concentration was significantly lower in Oxgr1–/– mice (Table 1) suggested that a decrease in the HCO3–/Cl– exchange activity via pendrin is involved in this impairment.
Table 1.
Blood and urine chemistry in wild-type and Oxgr1–/– mice
Discussion
Paracrine signaling plays an important role in renal function. For instance, the tubuloglomerular feedback response, which is mediated by a multitude of paracrine molecules (ATP, adenosine, prostaglandin E2, and nitric oxide), is critically involved in the regulation of glomerular filtration rate (reviewed in ref. 13). In this study, we show for the first time that maintaining systemic acid-base balance requires paracrine communication between the proximal and the distal parts of the renal tubule. We demonstrate that αKG acts in a paracrine manner on type B and non-A–non-B intercalated cells of the CNT/CCD, stimulating HCO3– secretion and NaCl reabsorption. These effects are induced by apical but not basolateral application of αKG and are mediated by OXGR1, a GPCR that is specifically expressed in type B and non-A–non-B intercalated cells. Importantly, our estimations suggest that luminal levels of αKG in the CNT/CCD vary within the range of αKG concentrations that have been shown to activate OXGR1 in vitro (EC50 ~70 μM; ref. 1). Indeed, considering that under our experimental condition urine was concentrated approximately 10–20 times between the lumen of the CNT/CCD and the final urine, one can estimate the range of αKG concentration at the site of OXGR1 expression as several hundreds nanomolar under acid load, as one hundred to several hundreds micromolar under standard diet, and as one to several millimolar under base load (e.g., the concentration of αKG in the final urine of mice given 0.3 M NH4Cl in drinking water for 2 days is 3.53 ± 2.10 μM [n = 6, SD], the concentration of αKG in the final urine of mice given tap water is 2.03 ± 0.67 mM [n = 6, SD], and the concentration of αKG in the final urine of mice given 0.28 M NaHCO3 in drinking water for 2 days is 36.43 ± 8.16 mM [n = 6, SD]; see Supplemental Figure 4A). Another piece of evidence supporting the functional relevance of this paracrine signaling is the finding that significant changes in urinary levels of αKG occur rapidly (less than 3 hours) in response to acid-base stress and that these changes can be induced by low, physiologically relevant doses of acid or base (e.g., the dose of 22.4 μmol NaHCO3, which produced a significant effect on the urinary αKG levels in gavage experiments, is significantly lower than the amount of HCO3– produced by the metabolism of 1 g of the 24% protein-containing standard diet used in this study). This suggests that the activation level of this paracrine mechanism can be modulated by the diurnal variations in the dietary acid-base load and/or by the variations in body’s metabolic production of acid and base.
We propose that αKG/OXGR1 paracrine signaling is involved in maintenance of acid-base balance at least in two ways. First, this paracrine mechanism controls pendrin activity, thereby exerting a direct effect on the acid-base balance. The rapid onset of pendrin activation by αKG/OXGR1 (within 20 minutes) suggests that this regulation is transcriptionally independent. Together with the results showing rapid changes in urinary αKG levels under acute acid-base stress, these observations support the hypothesis that the αKG/OXGR1/pendrin axis is involved in the dynamic fine-tuning of bicarbonate secretion by type B and non-A–non-B intercalated cells. Second, we hypothesize that αKG/OXGR1 signaling may be involved in the compensatory response to the acid-base stress-induced changes in NaCl reabsorption through the NHE3 in the proximal tubule and Henle’s loop. Indeed, it was demonstrated that acute acid or base loading induces an increase or decrease in the NHE3 activity, respectively (reviewed in ref. 14). Because NHE3 is functionally coupled to a Cl–/ anion exchange, these changes result not only in increased or decreased bicarbonate reabsorption but also in increased or decreased net NaCl reabsorption in the proximal tubule, respectively. Thus, by decreasing or increasing NaCl reabsorption in the type B and non-A–non-B intercalated cells under acid or base loading, respectively, the αKG/OXGR1 signaling pathway participates in maintaining NaCl homeostasis and, indirectly, in acid-base balance. This model is depicted in Supplemental Figure 5. To what extent this paracrine mechanism operates similarly/differentially between type B and type non-A/non-B intercalated cells or between the CNT and CCD (which contain different ratios of these cell types) remains to be established in future studies. The idea that the αKG/OXGR1 pathway is involved in sodium balance is supported by the fact that Oxgr1–/– mice exhibit an increased functional activity of ENaC, correlating with the increased protein abundance of αENaC subunit. The mechanism of these adaptive changes remains unknown, but our data indicate that they occur without changes in plasma aldosterone levels.
Besides its OXGR1-mediated stimulatory action on NaCl reabsorption in intercalated cells, αKG also inhibits amiloride-sensitive Na+ reabsorption in principal cells independently of OXGR1 activation. This metabolic effect of αKG may be related to increased ATP production and inhibition of ENaC via autocrine activation of P2Y2 receptors (15). Receptor-dependent and -independent effects of αKG on intercalated and principal cells both converge to compensate for alkalosis-induced decrease in proximal tubule reabsorption of NaCl by favoring NaCl reabsorption over Na+/K+ exchange along the CNT/CCD.
Our finding that αKG serves as a paracrine mediator in regulating acid-base balance adds to the accumulating evidence for the regulatory homeostatic role of organic anions excreted in urine. It has been long recognized that citrate, the major intermediate of TCA cycle in the urine, has a dual role in maintaining acid-base balance and in the chelation of calcium ions, thereby preventing calcium stone formation (reviewed in ref. 16). Peti-Peterdi and colleagues have demonstrated recently the role of luminal succinate in GPR91-mediated regulation of renin secretion (17, 18). Today, citrate supplementation is widely used in the prevention of nephrolithiasis and GPR91 is recognized as a potential target in treatment of diabetic nephropathy. Our results and the fact that OXGR1 expression is almost exclusively restricted to the kidney suggest that OXGR1 could represent an interesting therapeutic opportunity for treatment of acid-base disorders or in the treatment of tubular disorders associated with kidney stone formation. The second tissue that exhibits a high level of OXGR1 expression is the testis and epididymis (19). Whether OXGR1 is involved in the homeostasis of epididymal fluid and male fertility needs to be addressed by future investigation.
Methods
Animals.
A colony of Oxgr1–/– mice (C57BL/6J background) was established from breeding pairs of Oxgr1+/– heterozygous mice developed by VelociGene and obtained from the Knock-Out Mouse Project repository. Male mice weighing 25–30 g (8 weeks of age) were used in all experiments. The animals were maintained on the standard laboratory chow diet (KLIBA NAFAG diet 3800). The NaHCO3-rich and standard jelly diets were prepared as follows: 6 ml 0.7 M NaHCO3 or 6 ml water were mixed with 0.2 ml agar-agar solution and briefly boiled. The resulting solution was cooled down to 40°C and mixed with 5 g of the standard lab chow in the form of powder. The final mixture was stored at 4°C for a maximum of 3 days. The mice received 11 g of the jelly food per day. All experiments with animals were performed in accordance with the Swiss guidelines for animal care.
Antibodies.
The antibodies against NCC, aquaporin-2, αENaC, βENaC, AE1, and pendrin have been used as previously described (20, 21). Anti-parvalbumin antibody was from Swant. Anti–β-galactosidase antibody was from Abcam. Anti-actin antibody was from Sigma-Aldrich. We have tested several commercially available anti-OXGR1 antibodies (2-oxoglutarate receptor 1 antibody 18-461-10700 from GenWay, anti-OXGR1 antibody ab67351 from Abcam, and anti-OXGR1 antibody LS-A1865 from LifeSpan BioSciences); however, none of them have shown specific results. Immunohistochemistry and X-gal staining protocols are available in the Supplemental Methods.
Metabolic cages.
Mice were housed in individual metabolic cages (Tecniplast). Urine collection was performed after a 3-day adaptation period. Urine osmolality, pH, and ionic composition were analyzed as previously described (22).
Blood sample analysis.
In experiments with alkali load, blood pH and blood gases were analyzed in blood samples collected from the retro-orbital sinus under isoflurane anesthesia. Blood was collected through a catheter implanted into the left carotid artery 4 hours before blood collection from mice fed a normal diet.
αKG measurement.
Urine and plasma αKG were measured using an Alpha-Ketoglutarate Assay Kit from BioVision.
Ion flux in isolated CCD.
CCDs from wild-type and Oxgr1–/– mice were microdissected from corticomedullary rays and microperfused under symmetrical conditions. The bath and perfusate contained 118 mM NaCl, 23 mM NaHCO3, 1.2 mM MgSO4, 2 mM K2HPO4, 2 mM calcium lactate, 1 mM Na-citrate, 5.5 mM glucose, and 12 mM creatinine, pH 7.4 (bath continuously gassed with 95% O2/5% CO2) at 37°C. Measurements were conducted during the first 90 minutes of perfusion. Hydrochlorothiazide and amiloride were added to the perfusate at a final concentration of 10–4 M and 10–5 M, respectively. Collections from 4 periods of 15 minutes were performed in which 30–35 nl of fluid was collected. The collection volume was determined under water-saturated mineral oil with calibrated volumetric pipettes. Concentrations of Na+ and creatinine were determined by HPLC using 26 nl of collected fluid. Concentrations of Cl– were measured by microcoulometry on 2 to 3 nl of collected fluid. For each collection, the ion flux of sodium (JX) was calculated per unit length of tubule: JX = {([X]p × Vp) – ([X]c × Vc)}/(L × t), where [X]p and [X]c are the concentrations of X in the perfusate and collection, respectively; Vp and Vc are the perfusion and collection rates, respectively; L is the tubule length; and t is the collection time. Vp was calculated as Vp = Vc × [creat]c/[creat]p, where [creat]c and [creat]p are the concentrations of creatinine in the collection and perfusate, respectively. For each tubule, ion fluxes were calculated as the mean of the 4 collection periods.
Apical Cl–/HCO3– exchange activity in CCD intercalated cells.
The activity of pendrin was determined by measuring the rate of intracellular alkalinization in type B and non-A–non-B intercalated cells following removal of luminal chloride as previously described (see Supplemental Methods for cell type identification). Our setup allowed a smooth and complete exchange of the luminal fluid within 3 to 4 seconds. Briefly, CCDs were dissected and microperfused in vitro as described above. Intracellular pH was assessed with imaging-based, dual excitation wavelength fluorescence microscopy using 2′,7′-Bis-(2-Carboxyethyl)-5-(and-6)-carboxyfluorescein (BCECF, Molecular Probes). Intracellular dye was excited alternatively at 440 and 500 nm every 2 seconds with a light-emitting diode (Optoled, Cairn Research). Emitted light was collected through a dichroic mirror, passed through a 530-nm filter, and focused onto a EM-CCD camera (iXon, Andor Technology) connected to a computer. The measured light intensities were digitized with 14-bit precision (16,384-gray-level scale) for further analysis. For each tubule, 3–4 intercalated cells were analyzed and the mean gray level was measured with Andor IQ software (Andor Technology). Background fluorescence was subtracted from fluorescence intensity to obtain intensity of intracellular fluorescence. Intracellular dye was calibrated at the end of each experiment using the high [K+]-nigericin technique. CCDs were initially perfused with a Cl–-containing solution (119 mM NMDG-Cl, 23 mM NMDG-HCO3, 2 mM K2HPO4, 1.5 mM CaCl2, 1.2 mM MgSO4, 10 mM HEPES, and 5.5 mM d-glucose) and then switched to a Cl–-free solution (119 mM NMDG-gluconate, 23 mM NMDG-HCO3, 2 mM K2HPO4, 7.5 mM Ca-gluconate, 1.2 mM MgSO4, 10 mM HEPES, and 5.5 mM d-glucose). All solutions were adjusted to pH 7.40 and continuously bubbled with 95% O2/5% CO2.
Statistics.
Data are presented as mean ± SEM or as mean ± SD, as indicated in the corresponding figure legends. The tests used include the 2-tailed, unpaired t test and the 1-way ANOVA. A P value of less than 0.05 was considered significant.
Study approval.
Animal studies were approved by the Veterinary Service of the Canton de Vaud, Switzerland.
Supplementary Material
Acknowledgments
We thank Dominique Eladari for helpful discussions and advice. We thank J. Loffing (University of Zurich) for providing antibodies against NCC, aquaporin-2, αENaC, and βENaC. This work was supported by the Swiss National Science Foundation research grants 31003A-132496 (to D. Firsov) and 31003A-138143 (to C.A. Wagner) and by a grant from the Novartis Foundation (to D. Firsov)
Footnotes
Conflict of interest: The authors have declared that no conflict of interest exists.
Citation for this article:J Clin Invest. 2013;123(7):3166–3171. doi:10.1172/JCI67562.
See the related Commentary beginning on page 2788.
References
- 1.He W, et al. Citric acid cycle intermediates as ligands for orphan G-protein-coupled receptors. Nature. 2004;429(6988):188–193. doi: 10.1038/nature02488. [DOI] [PubMed] [Google Scholar]
- 2.Tikhonova IG, et al. Bidirectional, iterative approach to the structural delineation of the functional “chemoprint” in GPR40 for agonist recognition. J Med Chem. 2007;50(13):2981–2989. doi: 10.1021/jm0614782. [DOI] [PMC free article] [PubMed] [Google Scholar]
- 3.Ferrier B, Martin M, Baverel G. Reabsorption and secretion of alpha-ketoglutarate along the rat nephron: a micropuncture study. Am J Physiol. 1985;248(3 pt 2):F404–F412. doi: 10.1152/ajprenal.1985.248.3.F404. [DOI] [PubMed] [Google Scholar]
- 4.Martin M, Ferrier B, Baverel G. Transport and utilization of alpha-ketoglutarate by the rat kidney in vivo. Pflugers Arch. 1989;413(3):217–224. doi: 10.1007/BF00583533. [DOI] [PubMed] [Google Scholar]
- 5.Cheema-Dhadli S, Lin SH, Halperin ML. Mechanisms used to dispose of progressively increasing alkali load in rats. Am J Physiol Renal Physiol. 2002;282(6):F1049–F1055. doi: 10.1152/ajprenal.00006.2001. [DOI] [PubMed] [Google Scholar]
- 6.Packer RK, Curry CA, Brown KM. Urinary organic anion excretion in response to dietary acid and base loading. J Am Soc Nephrol. 1995;5(8):1624–1629. doi: 10.1681/ASN.V581624. [DOI] [PubMed] [Google Scholar]
- 7.Schwartz WB, Bank N, Cutler RW. The influence of urinary ionic strength on phosphate pK2′ and the determination of titratable acid. J Clin Invest. 1959;38(2):347–356. doi: 10.1172/JCI103808. [DOI] [PMC free article] [PubMed] [Google Scholar]
- 8.Wagner CA, Mohebbi N, Capasso G, Geibel JP. The anion exchanger pendrin (SLC26A4) and renal acid-base homeostasis. Cell Physiol Biochem. 2011;28(3):497–504. doi: 10.1159/000335111. [DOI] [PubMed] [Google Scholar]
- 9.Wall SM, Pech V. The interaction of pendrin and the epithelial sodium channel in blood pressure regulation. Curr Opin Nephrol Hypertens. 2008;17(1):18–24. doi: 10.1097/MNH.0b013e3282f29086. [DOI] [PubMed] [Google Scholar]
- 10.Eladari D, Chambrey R, Peti-Peterdi J. A new look at electrolyte transport in the distal tubule. Annu Rev Physiol. 2012;74:325–349. doi: 10.1146/annurev-physiol-020911-153225. [DOI] [PMC free article] [PubMed] [Google Scholar]
- 11.Leviel F, et al. The Na+-dependent chloride-bicarbonate exchanger SLC4A8 mediates an electroneutral Na+ reabsorption process in the renal cortical collecting ducts of mice. J Clin Invest. 2010;120(5):1627–1635. doi: 10.1172/JCI40145. [DOI] [PMC free article] [PubMed] [Google Scholar]
- 12.Kim YH, et al. Reduced ENaC protein abundance contributes to the lower blood pressure observed in pendrin-null mice. Am J Physiol Renal Physiol. 2007;293(4):F1314–F1324. doi: 10.1152/ajprenal.00155.2007. [DOI] [PubMed] [Google Scholar]
- 13.Schnermann J, Levine DZ. Paracrine factors in tubuloglomerular feedback: adenosine, ATP, and nitric oxide. Annu Rev Physiol. 2003;65:501–529. doi: 10.1146/annurev.physiol.65.050102.085738. [DOI] [PubMed] [Google Scholar]
- 14.Bobulescu IA, Moe OW. Luminal Na(+)/H(+) exchange in the proximal tubule. Pflugers Arch. 2009;458(1):5–21. doi: 10.1007/s00424-008-0595-1. [DOI] [PMC free article] [PubMed] [Google Scholar]
- 15.Vallon V, Rieg T. Regulation of renal NaCl and water transport by the ATP/UTP/P2Y2 receptor system. Am J Physiol Renal Physiol. 2011;301(3):F463–F475. doi: 10.1152/ajprenal.00236.2011. [DOI] [PMC free article] [PubMed] [Google Scholar]
- 16.Moe OW, Preisig PA. Dual role of citrate in mammalian urine. Curr Opin Nephrol Hypertens. 2006;15(4):419–424. doi: 10.1097/01.mnh.0000232882.35469.72. [DOI] [PubMed] [Google Scholar]
- 17.Toma I, et al. Succinate receptor GPR91 provides a direct link between high glucose levels and renin release in murine and rabbit kidney. J Clin Invest. 2008;118(7):2526–2534. doi: 10.1172/JCI33293. [DOI] [PMC free article] [PubMed] [Google Scholar]
- 18.Vargas SL, Toma I, Kang JJ, Meer EJ, Peti-Peterdi J. Activation of the succinate receptor GPR91 in macula densa cells causes renin release. J Am Soc Nephrol. 2009;20(5):1002–1011. doi: 10.1681/ASN.2008070740. [DOI] [PMC free article] [PubMed] [Google Scholar]
- 19.Regard JB, Sato IT, Coughlin SR. Anatomical profiling of G protein-coupled receptor expression. Cell. 2008;135(3):561–571. doi: 10.1016/j.cell.2008.08.040. [DOI] [PMC free article] [PubMed] [Google Scholar]
- 20.Wagner CA, et al. Mouse model of type II Bartter’s syndrome. II. Altered expression of renal sodium- and water-transporting proteins. Am J Physiol Renal Physiol. 2008;294(6):F1373–F1380. doi: 10.1152/ajprenal.00613.2007. [DOI] [PubMed] [Google Scholar]
- 21.Loffing J, et al. Altered renal distal tubule structure and renal Na(+) and Ca(2+) handling in a mouse model for Gitelman’s syndrome. J Am Soc Nephrol. 2004;15(9):2276–2288. doi: 10.1097/01.ASN.0000138234.18569.63. [DOI] [PubMed] [Google Scholar]
- 22.Nikolaeva S, et al. The circadian clock modulates renal sodium handling. J Am Soc Nephrol. 2012;23(6):1019–1026. doi: 10.1681/ASN.2011080842. [DOI] [PMC free article] [PubMed] [Google Scholar]
Associated Data
This section collects any data citations, data availability statements, or supplementary materials included in this article.