Abstract
Electric field mapping is commonly used to identify irregular conduction pathways in the heart (e.g., arrhythmia) and brain (e.g., epilepsy). Ultrasound current source density imaging (UCSDI), based on the acoustoelectric (AE) effect, is a promising new technique for mapping electrical current in four dimensions with enhanced resolution. The frequency and pulse shape of the ultrasound beam affect the sensitivity and spatial resolution of UCSDI. In this study, we explore the effects of ultrasound transducer frequency bandwidth and coded excitation pulses for UCSDI and the inherent tradeoff between sensitivity and spatial resolution. We used both simulations and bench-top experiments to image a time-varying electrical dipole in 0.9% NaCl solution. To study the effects of ultrasound bandwidth, we chose two ultrasound transducers with different center frequencies (1.0 and 2.25 MHz). For coded excitation, we measured the AE voltage signal with different chirp excitations. As expected, higher bandwidth correlated with improved spatial resolution at the cost of sensitivity. On the other hand, chirp excitation significantly improved sensitivity (3.5 μV/mA) compared with conventional square pulse excitation (1.6 μV/mA) at 1 MHz. Pulse compression achieved spatial resolution similar to that obtained using square pulse excitation, demonstrating enhanced detection sensitivity without loss of resolution. Optimization of the time duration of the chirp pulse and frequency sweep rate can be further used to improve the quality of UCSDI.
I. Introduction and Theory
Epilepsy and cardiac arrhythmia are serious health problems affecting millions of patients worldwide. When drug therapy is ineffective, invasive surgical techniques are often employed to restore normal function. These procedures (e.g., cardiac ablation therapy) typically require electrical mapping of tissue before treatment. It is highly desirable that these interventional strategies provide rapid and accurate images of the electric current to help localize irregular pathways for guiding therapy. conventional mapping techniques are typically invasive, laborious, prone to registration errors, and require a large number of electrodes to reconstruct the current field distribution [1]–[3]. To avoid these limitations, we have developed ultrasound current source density imaging (UCSDI) [4]–[8], potentially facilitating electrical mapping and improving spatial resolution. One important advantage of this approach is that a system that combines an ultrasound beam with as few as a single recording electrode and reference is capable of mapping current density distributions in four dimensions (volume + time) at a spatial resolution determined by the ultrasound bandwidth [8]. In terms of sensitivity, previous studies have demonstrated that UCSDI is sufficiently sensitive to map cardiac electrical conduction between 0.1 and 1.0 mA/cm2 [7].
The principle of UCSDI is based on the acoustoelectric (AE) effect, a modulation of electric resistivity by acoustic pressure [9]. When a focused ultrasound beam intersects a current field, a high-frequency AE voltage signal is generated. For a given ultrasound beam with axial position at (x1, y1) propagating through a current field JI along the z direction, the AE signal at time t is given by [6]
| (1) |
with interaction constant KI, a fundamental material property [10], resistivity ρ, and pulse pressure amplitude P0. JL is the lead field for the selected recoding electrodes [11], b(x, y, z) is the ultrasound beam pattern, c is the speed of sound, and a(t − z/c) is the ultrasound pulse waveform. From (1), one can intuitively predict that the spatial resolution and AE signal sensitivity depend on the ultrasound beam pattern, bandwidth, and pressure amplitude. For a given current source distribution and fixed recording electrodes, an ultrasound focus with a small axial beam width (higher frequency) provides better detail at the cost of a smaller integral region. on the other hand, when the current field is confined within one wavelength of the ultrasound beam, the integral in (1) has minimal cancellation effect and produces a detectable AE signal. This emphasizes the inherent tradeoff between detection sensitivity and spatial resolution. Besides ultrasound transducer bandwidth, the shape and duration of the excitation pulse can also be used to optimize sensitivity and SNR for UCSDI. Previous studies have also shown advantages of unipolar ultrasound transducers for minimizing cancellation of the convolution between the ultrasound beam and current density distribution [12], [13]. Finally, coded pulse waveforms, such as chirps, have also been implemented to improve SNR in ultrasound and radar imaging systems for decades [14], [15]. The most popular coded waveform is the linear frequency modulated pulse (or chirp), which can be expressed in complex form by
| (2) |
with envelope function a(t), starting frequency f0, and linear frequency sweep rate β. There are three key advantages for implementing coded pulse waveforms for imaging [16]: 1) improved SNR at equivalent peak acoustic pressures; 2) deeper penetration with enhanced SNR; and 3) increased frame rate compared with long pulses. Waveforms that extend the time–bandwidth product of the ultrasound beam without sacrificing spatial resolution can improve the SNR by more than 15 dB [14]. We hypothesize that coded pulses also improve sensitivity for UCSDI without sacrificing spatial resolution. Electrical heart mapping based on UCSDI would especially benefit from these advantages. Improved SNR not only allows identifying structures at a greater depth, but also enables imaging at higher frequencies, leading to better spatial resolution. An increased frame rate further provides better temporal averaging, potentially facilitating real-time UCSDI for guiding interventional treatment of heart and brain disorders. With longer pulses, coded excitation retains comparable SNR to shorter pulses at reduced acoustic pressure. Whereas coded excitation is employed to improve SNR, the longer pulses can degrade axial spatial resolution. However, the spatial resolution can be restored by using pulse compression, a signal processing algorithm widely used in radar and ultrasound imaging systems [17]. In this paper, we employed pulse compression of the AE signal to preserve spatial resolution. similar to ultrasound or radar imaging, the pulse compression for UCSDI is actually carried out by cross-correlation of the coded input pulse with the measured AE signal. Assuming the impulse response of the transducer for the AE signal is h(t) and input pulse is p(t) as expressed in (2), AE signal s(t) can be approximated as the convolution of p(t) and h(t):
| (3) |
Then, the cross-correlation for pulse compression is [18]
| (4) |
where • denotes the cross-correlation. The auto-correlation of p(t) in square brackets results in a compressed short pulse. The peak amplitude of this pulse is larger than that of p(t) by a factor of , where K denotes the time–bandwidth product [18].
Therefore, for a given electric current field, the AE signal can be optimized by using an ultrasound transducer with an appropriate center frequency and aperture to produce the desired beam shape and time profile. In this paper, we studied the effect of ultrasound transducer frequency and coded pulse excitations on AE sensitivity and spatial resolution.
II. Methods
A. Instrumentation
To study the frequency and pulse shape dependency of the AE signal, a time-varying dipole was produced in 0.9% NaCl solution, similar to what we have described previously [8]. a 200-Hz alternating current (ac) was injected through two stimulating electrodes by a function generator (33220A, Agilent Technologies Inc., Santa Clara, CA). One of two single-element focused ultrasound transducers (V392 and V395, Panametrics NDT, Waltham, MA) with different center frequencies (1 and 2.25 MHz) and bandwidths (0.64 and 1.77 MHz at −6 dB) were used to modulate resistivity in the presence of electrical current flow to produce AE signals. Both transducers have the same element size (38 mm in diameter) and focal length (69 mm). A B-scan was performed for each transducer to evaluate the sensitivity and spatial resolution for UCSDI.
The experimental setup is displayed in Fig. 1. Two platinum electrodes (S+ and S−) were separated by 10 mm to produce an electric dipole in saline. Both electrodes were cylinders with an exposed area of 3 mm (length) and 0.3 mm (diameter). An Ag/AgCl recording electrode (R) was placed 5 mm from the cathode of the stimulating electrodes. A spherically-focused single element transducer was immersed in a water tank below the electrodes. A pulse/receiver (5077PR, Panametrics) was used to excite the transducer and collect the pulse-echo (PE) signal for routine ultrasound imaging of geometry. The dipole was imaged with B-scan using each transducer at room temperature (24°c) and same experimental conditions. For each B-scan, the transducer was scanned along the x-axis direction with 20 mm scan range and steps of 0.5 mm. At each scan point, an A-line was acquired with 10 averages. All PE, AE, and current signals were acquired by a data acquisition system (NI-PXI 1042S, National Instruments Corp., Austin, TX). The timing between the instruments and data acquisition system were described in a previous work [6]. A Single B-scan was completed in 3 min.
Fig. 1.
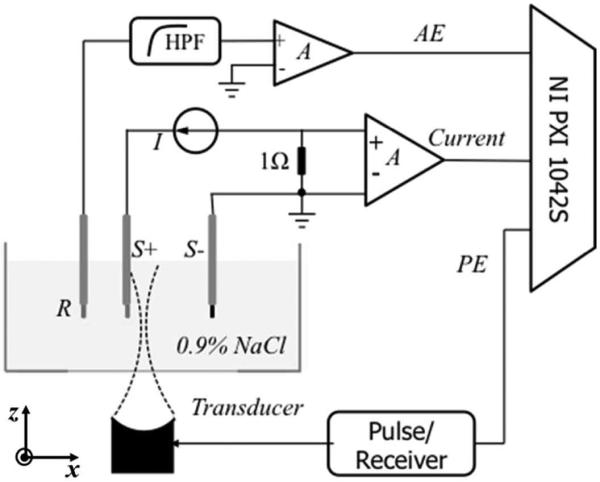
Experimental bench-top setup for ultrasound current source density imaging (UCSDI).
To compare results from different transducers, we characterized the beam size and acoustic pressure for each transducer using a calibrated hydrophone (HGL-0200, Onda Corp., Sunnyvale, CA) [19]. The ultrasound beam size was evaluated by the full-width at half-maximum (FWHM) of the intensity image at the focus. For the 1-MHz transducer, the beam size was 3.9 mm (lateral) and 2.2 mm (axial); the peak pressure at the focus was 4.3 MPa. For the 2.25-MHz transducer, the beam size was 2.0 mm (lateral) and 0.9 mm (axial) with a peak focal pressure of 3.7 MPa.
For UCSDI with coded excitation, chirp pulses were generated by a function generator (33220A, Agilent Technologies Inc.) and amplified by a power amplifier (AG 1021, T&C Power Conversion Inc., Rochester, NY). For each transducer, the chirp pulse was properly configured so that its center frequency matched the optimal transducer response. A Hanning window was chosen as the envelope function a(t). We measured and simulated AE signals with chirps at different time durations T and frequency sweep rates β to study how they affected the AE signal. The peak acoustic pressure for each chirp was also measured using the hydrophone.
B. Simulation
B-mode UCSD images were simulated using Matlab (The MathWorks Inc., Natick, MA) to verify the experimental results. The ultrasound pressure was simulated using Field II [20], [21]. The transducer was configured as a single concave element with focal length of 68 mm. The impulse response of both transducers was assumed to be a Gaussian pulse. The dipole electric field and recording lead fields were modeled using Comsol Multiphysics (Comsol Inc., Burlington, MA), similar to a previous study [6]. Fig. 2 depicts the simulated current density distribution of an electric dipole. Figs. 2(a) and 2(b) are the cross-sectional images of the current density magnitude |J| and z-component Jz, respectively. Hot and cold colors represent the positive and negative polarity of the current density. Both images are normalized by the maximum of |J|. Unlike the magnitude of the current density, Jz is maximized only at the ends of each stimulating electrode.
Fig. 2.

Simulated cross-sectional images of an electric current dipole. (a) The amplitude of current density in the x–z plane and (b) the z component of current density distribution. Hot and cold colors in (b) present the positive and negative polarity of current density, respectively.
The lead field JL was simulated with the same approach [6]. The AE signal at each position and time was numerically calculated using (1).
C. Data Processing
AE signals were converted into complex form and filtered using Hanning window filters in both slow and fast time. For slow time, the Hanning window was centered at 200 Hz to match the frequency of the injected current. The bandwidth at 3 dB was 70 Hz. The Hanning window filter was matched for the center frequency and bandwidth of the ultrasound transducer. Each AE signal was further demodulated to remove the ultrasound signature along the direction of the ultrasound beam to represent the instant current density along the direction of the ultrasound beam [8].
III. Results
A. Frequency Dependence
Color UCSDI B-mode maps (lateral versus depth) of the current dipole using short square pulse excitations at different ultrasound frequencies are presented in Fig. 3. The images display the measured AE signals after data processing, which was described in the previous section. The injected current in saline is equivalent (112 mA peak-to-peak) for both cases. All A-lines are measured at the instant when injected ac current is maximized. Figs. 3(a) and 3(b) provide the experimental results using the 1.0-MHz and 2.25-MHz transducers, respectively. For comparing spatial resolution, normalized A-lines from the color B-mode images are denoted by solid black lines in Figs. 3(c) and 3(d). To compare the UCSDI A-lines with the actual current density distribution, the z component of electric current density Jz is displayed in Figs. 3(c) and 3(d).
Fig. 3.
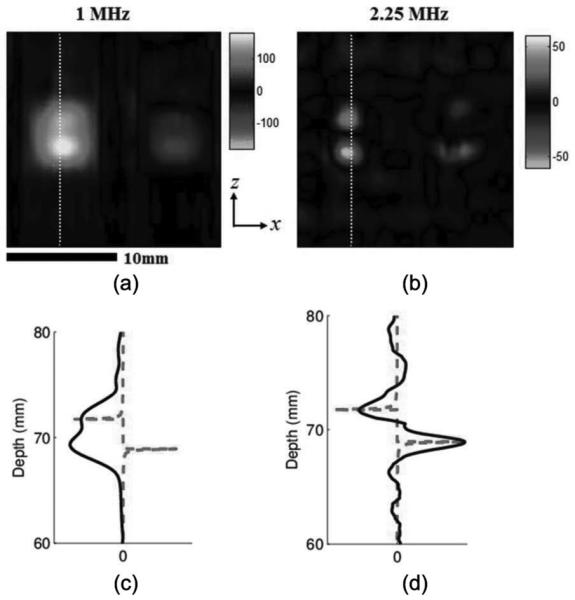
Effect of ultrasound frequency on ultrasound current source density imaging (UCSDI) (experiment): Color UCSDI B-mode images using two ultrasound transducers with different center frequencies: (a) 1.0 MHz and (b) 2.25 MHz. Colors represent amplitude and polarity of the acoustoelectric (AE) signal related to the electrical field distribution. Scale of color bars represents the amplitude of the measured signal in millivolts with a gain of 700. Solid curves in (c) and (d) are select filtered and basebanded A-lines denoted by dotted white lines in (a) and (b). The dashed curve in (c) and (d) is the z component of the electric current density distribution Jz.
The images in Fig. 3 demonstrate that the high-frequency transducer has better spatial resolution. The pattern of the UCSDI image [Fig. 3(b)] from the 2.25-MHz transducer is consistent with the image of Jz [Fig. 2(b)] predicted by our model. It clearly resolves the two maximum current densities of each electrode and their polarities. The distance between the two extremes was 2.8 mm, similar to the length of the stimulating electrodes. Between the two poles, the current distribution changes relatively slowly in the axial direction (z) and symmetrically in the lateral direction, such that only small-amplitude AE signals were detected because of integral cancellation between the US pressure field and current density distribution, as predicted by (1). Fig. 3(d) further illustrates the relationship between UCSDI and current density Jz. The lateral FWHM was measured at 2.2 mm. However, for the 1-MHz transducer, the axial size of the focal zone is comparable to the distance between the two maxima points of Jz. The poles appeared as one bright area with a FWHM of 4.4 mm (x) and 5.3 mm (z). As a result, the two dipoles overlapped in the image because of poor spatial resolution.
In terms of sensitivity, the peak amplitude of the AE signal was 1.61 μV/mA for the 1-MHz transducer and 0.55 μV/mA for the 2.25-MHz transducer. After considering differences in acoustic pressure, the signal amplitude from the 1-MHz transducer was 2.6 times larger than that produced by the 2.25-MHz transducer.
The simulations, displayed in Fig. 4, were consistent with the experimental results, further confirming the frequency dependence and tradeoff between resolution and sensitivity. Whereas the dipole appeared as one structure using the 1-MHz transducer, both poles of the dipole were resolvable using the 2.25-MHz transducer.
Fig. 4.
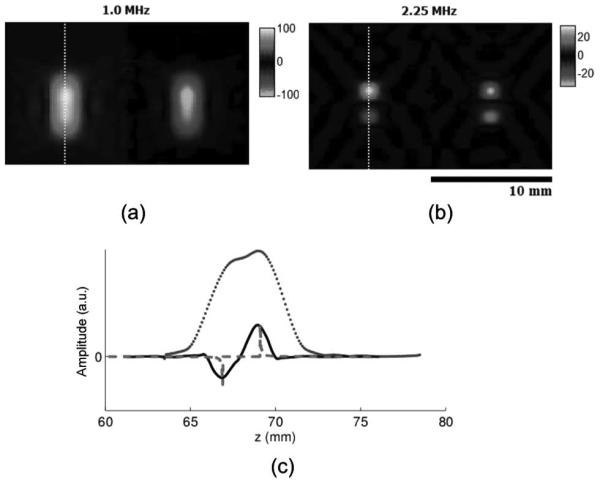
Effect of ultrasound frequency on ultrasound current source density imaging (UCSDI) (simulation): Color UCSDI B-mode images at two different US excitation frequencies: (a) 1.0 MHz and (b) 2.25 MHz. The scale of the two color bars represents the simulated signal amplitude in the same arbitrary unit. (c) Traces corresponding to white lines in B-mode images (dotted for 1.0 MHz and solid for 2.25 MHz) and corresponding current density Jz (dashed line).
B. Coded Excitation
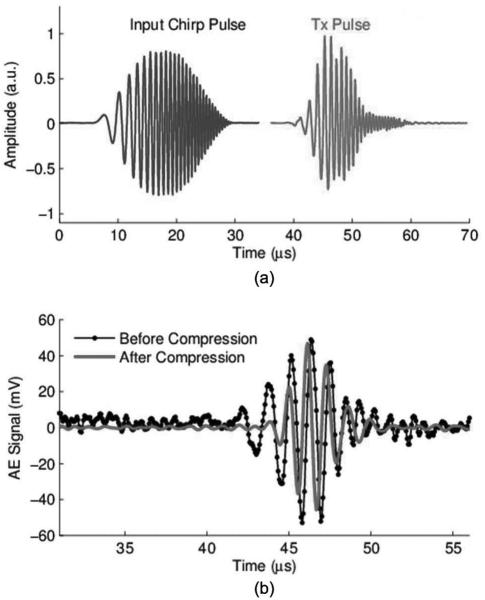
We also examined effects of coded excitation on the AE signal. The transducer beam was focused at the cathode of the dipole (S+ in Fig. 1). The chirp pulse and ultrasound transmitted waveform (measured using a hydrophone) are depicted in Fig. 5(a). The chirp pulse with 25 cycles was convolved with a Hanning envelope. The time–bandwidth product of this chirp pulse was 10.7. note that the transducer has limited bandwidth, so the transmitted pulse, which is the convolution between the input chirp pulse and the impulse response of the ultrasound transducer, does not appear exactly the same as the input chirp waveform.
Fig. 5.
(a) Input chirp waveform and transmitted ultrasound pulse captured with hydrophone; (b) uncompressed (dotted line) and compressed (solid line) waveforms of the detected acoustoelectric (AE) signal using the 1-MHz ultrasound transducer. The amplitude of the compressed signal was normalized to the amplitude of the original signal.
Fig. 5(b) displays the experimentally measured AE signal before and after pulse compression, respectively. We observe from Fig. 5 that the compressed signal has a smaller pulse width than the uncompressed version and that this compression process suppresses noise.
For comparison with traditional excitation, a square pulse was also used to produce AE signals subject to the same experimental conditions. To compare sensitivity and resolution between chirp and square pulses, we measured the peak AE amplitude and calculated the FWHM for each ultrasound excitation and current injection level. The results for the 1-MHz transducer are displayed in Fig. 6.
Fig. 6.
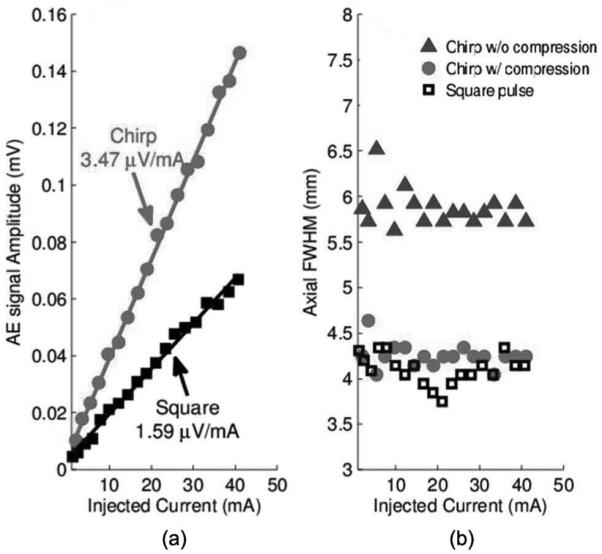
(a) Sensitivity and (b) axial width of the acoustoelectric (AE) signal using the 1-MHz transducer. Plot symbols denote experimental measurements, and solid lines represent the best linear fit.
From Fig. 6(a), it is clear that the amplitude of the AE signal amplitude using chirps [as in Fig. 5(a)] is double (6 dB) that using a square pulse. In addition, the axial width for chirp excitation (6.0 mm) was worse than that of square pulses (4.3 mm) because of the extended duration of the excitation pulse. However, after pulse compression, the width was reduced to 4.4 mm, comparable to the square pulse. The same experiment was conducted with a 2.25-MHz transducer. The results, depicted in Fig. 7, also indicated the chirp pulse yielded a stronger AE signal. Pulse compression was also able to retain the spatial resolution using chirp excitation.
Fig. 7.
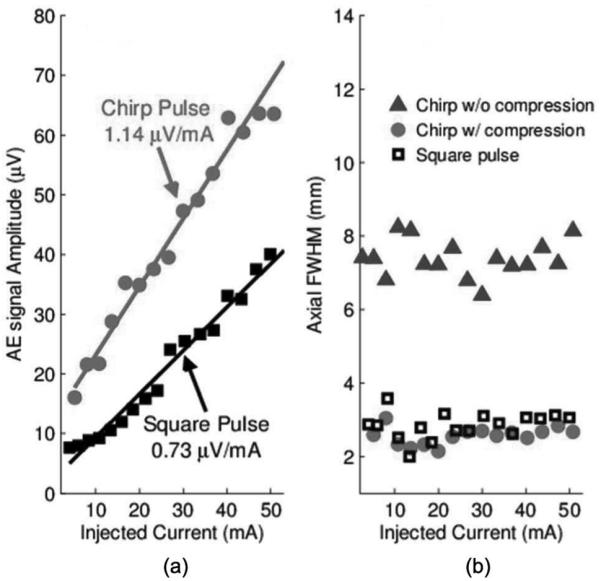
(a) Sensitivity and (b) axial width of the acoustoelectric (AE) signal using the 2.25-MHz transducer.
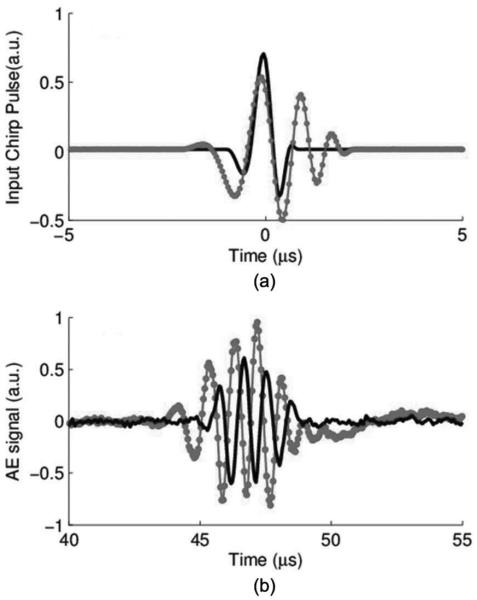
To investigate the effect of the frequency sweep rate β and time duration T on AE signals, we generated chirp pulses with two different time durations (T = 2 and 5 μs), as depicted in Fig. 8(a). The center frequency of each chirp was configured to match the optimal response of the selected ultrasound element. For each T, chirp pulses with a series of different β were generated to excite the transducer.
Fig. 8.
(a) Input chirp pulses and (b) detected acoustoelectric (AE) signals with a T of 2 μs (solid line) and 5 μs (dotted line).
With the same experimental setup, AE signals were experimentally measured with the transducer focused at the cathode (S+ in Fig. 1) of the electric dipole for each T and β combination. Typical AE signals with 20 averages from each T are plotted in Fig. 8(b). Simulations of the AE signal were also conducted for each corresponding scenario. The amplitudes of the AE signal are displayed in Fig. 9.
Fig. 9.
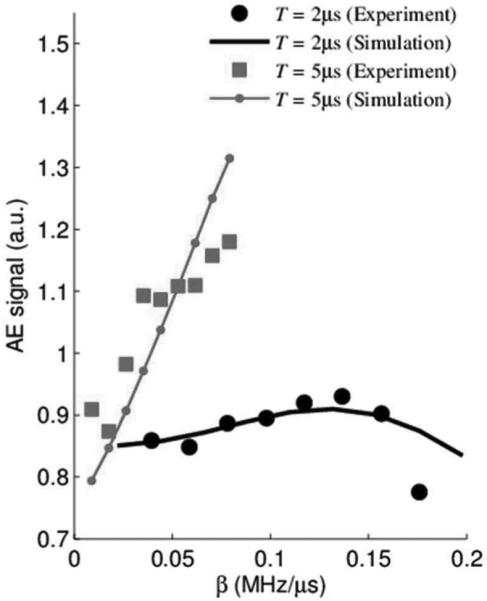
Acoustoelectric (AE) signal amplitude versus frequency sweep rate β. Thin and thick curves correspond to T = 2 μs and T = 5 μs, respectively. Square and circle symbols represent experimental results; thin line and thick curve are results from simulations.
These preliminary results indicate that both the chirp's pulse duration T and frequency sweep rate β are both important parameter for optimizing the strength of the AE signal. That is, longer pulse durations and faster sweeps yield larger AE signal signals under the same conditions. The nonlinearity of the AE signal as a function of sweep rate β can be simply explained by the fact that the AE signal depends on both the spectrum of the excitation pulse (i.e., chirp) and the frequency response of the ultrasound transducer. As β increases, this overlap varies in a nonlinear manner, which was verified with simulation.
IV. Discussion and Conclusion
In this paper, we studied the sensitivity and resolution of UCSDI from two aspects: 1) center frequency and bandwidth of the ultrasound transducer and 2) shape of the excitation pulse. We demonstrated the tradeoff between detection sensitivity and spatial resolution using transducers with different center frequencies. For the electric dipole experiment, the 1.0-MHz transducer produced an AE signal with peak amplitude of 1.61 μV/mA, whereas the 2.25-MHz transducer produced only 0.55 μV/mA at a similar acoustic pressure. However, the higher frequency transducer had better spatial resolution, revealing more details related to the current density distribution. For coded excitation, we detected the AE signal at a sensitivity of 3.47 μV/mA using the 1-MHz transducer and 25-cycle chirp excitation. Sensitivity was twice that of square excitation. Pulse compression was proven to be effective for preserving the spatial resolution for coded excitation. The results illustrate that ultrasound frequency and beam shape significantly affect UCSDI resolution and sensitivity. In addition, β and T of the chirps affect the amplitude of the AE signal. Choice of the ultrasound parameters, therefore, can fulfill different requirements for imaging current flow in the heart and brain using UCSDI. Further control of the ultrasound pulse shape will help optimize sensitivity and facilitate translation of UCSDI to the clinic for the diagnosis and treatment of arrhythmia and epilepsy.
Acknowledgments
This work is support by the National Institutes of Health grant number R01EB009353.
Biographies

Yexian Qin received his B.S. degree in physics from the University of Science and Technology of China, Hefei, China, in 1997, and his Ph.D. degree in physics from Purdue University, West Lafayette, IN, in 2007. After graduation, Dr. Qin joined Intelligent Automation Inc., Rockville, MD, as a research scientist, where he developed high-resolution acoustic nondestructive testing and imaging techniques, surface wave acoustic microscopy, and designed novel ultrasound transducers. In 2010, he joined the Experimental Ultrasound and Neural Imaging Laboratory to develop novel biomedical ultrasound imaging techniques.

Zhaohui Wang (M'10) received his B.S. degree in electronics in 1993 from Shandong University, Weihai, Shandong, China; his M.E. degree in circuits and systems in 2002 from the University of Science and Technology of China, Hefei, Anhui, China; his M.S. degree in biomedical engineering in 2005 from the University of Toledo, Toledo, OH; his M.S. degree in mechanical engineering in 2008 from the University of Arizona, and his Ph.D. degree in electrical and computer engineering in 2011 from the University of Arizona. He is now a Postdoctoral Fellow at the University of Pittsburgh, Pittsburgh, PA.

Pier Ingram received his B.A. degree at the University of Oxford and his M.S. degree in optical sciences at the University of Arizona. As a Research Specialist, he is able to exercise a variety of skills, including electronics, coding, testing, and experimentation. He has been with the Experimental Ultrasound and Neural Imaging Laboratory since its inception in 2007.

Qian Li Received her B.S. degree in physics from the University of Science and Technology of China in 2008 and her M.S. degree in optical sciences from the University of Arizona, in 2011. She is currently a Ph.D. candidate at the University of Arizona, working as a research associate in the Experimental Ultrasound and Neural Imaging Laboratory. Her research interests include ultrasound current source density imaging and its application to cardiac imaging.

Russell Witte received a B.S. degree in physics with honors from the University of Arizona, Tucson, AZ, in 1993 and a Ph.D. degree in bioengineering from Arizona State University, Tempe, AZ, in 2002. His graduate work exploited chronic, implantable microelectrode arrays to characterize sensory coding, learning, and cortical plasticity in the brain. He then moved to Ann Arbor and the University of Michigan, where he developed noninvasive imaging techniques to explore the neuromuscular and nervous systems. While at the Bio medical Ultrasound Laboratory, he helped devise several methods for enhancing image contrast using ultrasound combined with other forms of energy. He then made a bold move in 2007 and accepted a position as Assistant Professor of Radiology, Biomedical Engineering, and Optical Sciences at the University of Arizona. His laboratory currently develops novel techniques that integrate light, sound, and electricity for medical imaging. His research potentially impacts applications ranging from epilepsy and arrhythmia to cancer.
References
- [1].Klemm HU, Steven D, Johansen C, Ventura R, Rostock T, Lutomsky B, Risius T, Meinertz T, Willems S. Catheter motion during atrial ablation due to the beating heart and respiration: Impact on accuracy and spatial referencing in three-dimensional mapping. Heart Rhythm. 2007;4(5):587–592. doi: 10.1016/j.hrthm.2007.01.016. [DOI] [PubMed] [Google Scholar]
- [2].Goldberger JJ. Atrial fibrillation ablation: Location, location, location. J. Cardiovasc. Electrophysiol. 2006;17(12):1271–1273. doi: 10.1111/j.1540-8167.2006.00669.x. [DOI] [PubMed] [Google Scholar]
- [3].Malkin R, Kramer N, Schnitz B, Gopalakrishnana M, Curry A. Advances in electrical and mechanical cardiac mapping. Physiol. Meas. 2005;26(1):R1–R14. doi: 10.1088/0967-3334/26/1/r01. [DOI] [PubMed] [Google Scholar]
- [4].Olafsson R, Witte RS, Jia C, Huang S-W, O'Donnell M. Detection of electrical current in a live rabbit heart using ultrasound. 2007 IEEE Ultrasonics Symp. 2007:989–992. [Google Scholar]
- [5].Witte RS, Olafsson R, Huang SW, O'Donnell M. Imaging current flow in lobster nerve cord using the acoustoelectric effect. Appl. Phys. Lett. 2007;90(16) art. no. 163902. [Google Scholar]
- [6].Olafsson R, Witte RS, Huang S-W, O'Donnell M. Ultrasound current source density imaging. IEEE Trans. Biomed. Eng. 2008;55(7):1840–1848. doi: 10.1109/TBME.2008.919115. [DOI] [PMC free article] [PubMed] [Google Scholar]
- [7].Olafsson R, Witte RS, Jia CX, Huang SW, Kim K, O'Donnell M. Cardiac activation mapping using ultrasound current source density imaging (UCSDI) IEEE Trans. Ultrason. Ferroelectr. Freq. Control. 2009;56(3):565–574. doi: 10.1109/TUFFC.2009.1073. [DOI] [PMC free article] [PubMed] [Google Scholar]
- [8].Wang ZH, Olafsson R, Ingram P, Li Q, Qin Y, Witte RS. Four-dimensional ultrasound current source density imaging of a dipole field. Appl. Phys. Lett. 2011;99(11):113701. doi: 10.1063/1.3632034. [DOI] [PMC free article] [PubMed] [Google Scholar]
- [9].Parmenter RH. The acousto-electric effect. Phys. Rev. 1953;89(5):990–998. [Google Scholar]
- [10].Jossinet J, Lavandier B, Cathignol D. The phenomenology of acousto-electric interaction signals in aqueous solutions of electrolytes. Ultrasonics. 1998;36(1–5):607–613. doi: 10.1016/s0041-624x(00)00029-9. [DOI] [PubMed] [Google Scholar]
- [11].Malmivuo J, Plonsey R. Bioelectromagnetism: Principles and Applications of Bioelectric and Biomagnetic Fields. Oxford University Press; New York, NY: 1995. [Google Scholar]
- [12].Foster FS, Hunt JW. The design and characterization of short pulse ultrasound transducers. Ultrasonics. 1978;16(3):116–122. [Google Scholar]
- [13].Yang R, Li X, Liu J, He B. 3D current source density imaging based on the acoustoelectric effect: A simulation study using unipolar pulses. Phys. Med. Biol. 2011;56(13):3825–3842. doi: 10.1088/0031-9155/56/13/006. [DOI] [PMC free article] [PubMed] [Google Scholar]
- [14].O'Donnell M. Coded excitation system for improving the penetration of real-time phased-array imaging-systems. IEEE Trans. Ultrason. Ferroelectr. Freq. Control. 1992;39(3):341–351. doi: 10.1109/58.143168. [DOI] [PubMed] [Google Scholar]
- [15].Brookner E. Phased-array radars. Sci. Am. 1985;252(2):94–102. [Google Scholar]
- [16].Misaridis T, Jensen JA. Use of modulated excitation signals in medical ultrasound. Part I: Basic concepts and expected benefits. IEEE Trans. Ultrason. Ferroelectr. Freq. Control. 2005;52(2):177–191. doi: 10.1109/tuffc.2005.1406545. [DOI] [PubMed] [Google Scholar]
- [17].Rao N, Mehra S. Medical ultrasound imaging using pulse compression. Electron. Lett. 1993;29(8):649–651. [Google Scholar]
- [18].Rao NAHK. Investigation of a pulse compression technique for medical ultrasound: A simulation study. Med. Biol. Eng. Comput. 1994;32(2):181–188. doi: 10.1007/BF02518916. [DOI] [PubMed] [Google Scholar]
- [19].Witte RS, Hall T, Olafsson R, Huang S-W, O'Donnell M. Inexpensive acoustoelectric hydrophone for mapping high intensity ultrasonic fields. J. Appl. Phys. 2008;104(5) doi: 10.1063/1.2974622. art. no. 054701. [DOI] [PMC free article] [PubMed] [Google Scholar]
- [20].Jensen JA. Field: A program for simulating ultrasound systems. Med. Biol. Eng. Comput. 1996;34(suppl. 1, pt. 1):351–353. [Google Scholar]
- [21].Jensen J, Svendsen N. Calculation of pressure fields from arbitrarily shaped, apodized, and excited ultrasound transducers. IEEE Trans. Ultrason. Ferroelectr. Freq. Control. 1992;39(2):262–267. doi: 10.1109/58.139123. [DOI] [PubMed] [Google Scholar]


