Background: We hypothesized that C/EBP homologous protein mediates hepatocyte apoptosis in nonalcoholic steatohepatitis.
Results: Paradoxically, Chop deletion protects from steatohepatitis by inducing apoptosis in activated macrophages.
Conclusion: CHOP-dependent macrophage apoptosis in NASH highlights the cell type-specific complexity of the ER stress response.
Significance: Therapeutic manipulation of mediators of ER stress response may have opposite effects in different cell populations; therefore, such studies should be interpreted cautiously.
Keywords: Apoptosis, Endoplasmic Reticulum Stress, Inflammation, Liver Injury, Macrophages, Fatty Liver
Abstract
Nonalcoholic fatty liver disease is a heterogeneous disorder characterized by liver steatosis; inflammation and fibrosis are features of the progressive form nonalcoholic steatohepatitis. The endoplasmic reticulum stress response is postulated to play a role in the pathogenesis of nonalcoholic fatty liver disease and nonalcoholic steatohepatitis. In particular, C/EBP homologous protein (CHOP) is undetectable under normal conditions but is induced by cellular stress, including endoplasmic reticulum stress. Chop wild type (Chop+/+) and knock-out (Chop−/−) mice were used in these studies to elucidate the role of CHOP in the pathogenesis of fatty liver disease. Paradoxically, Chop−/− mice developed greater liver injury, inflammation, and fibrosis than Chop+/+ mice, with greater macrophage activation. Primary, bone marrow-derived, and peritoneal macrophages from Chop+/+ and Chop−/− were challenged with palmitic acid, an abundant saturated free fatty acid in plasma and liver lipids. Where palmitic acid treatment activated Chop+/+ and Chop−/− macrophages, Chop−/− macrophages were resistant to its lipotoxicity. Chop−/− mice were sensitized to liver injury in a second model of dietary steatohepatitis using the methionine-choline-deficient diet. Analysis of bone marrow chimeras between Chop−/− and Chop+/+ mice demonstrated that Chop in macrophages protects from liver injury and inflammation when fed the methionine-choline-deficient diet. We conclude that Chop deletion has a proinflammatory effect in fatty liver injury apparently due to decreased cell death of activated macrophages, resulting in their net accumulation in the liver. Thus, macrophage CHOP plays a key role in protecting the liver from steatohepatitis likely by limiting macrophage survival during lipotoxicity.
Introduction
Nonalcoholic fatty liver disease is a group of heterogeneous disorders characterized by obesity and insulin resistance (1). Nonalcoholic steatohepatitis (NASH),4 a progressive form, is present in 10–30% of nonalcoholic fatty liver disease patients. It is characterized by liver injury, which can result in cirrhosis. Histologically NASH is distinguished from nonalcoholic fatty liver disease by lobular inflammation and fibrosis (2). Due to increasing prevalence and associated morbidity and mortality, understanding the mediators of these disorders is important. Furthermore, identification of factors involved in the pathogenesis of NASH is key to the development of preventive strategies. Data from animal and human studies point toward insulin resistance, hepatocyte apoptosis, and inflammation as keystones of disease pathogenesis (3–5). Animal models have implicated changes in lipid metabolism, adipocytokines, FFA, and innate immunity in the onset of hepatic insulin resistance with subsequent steatosis (6, 7). These factors also modulate hepatocyte apoptosis, which is a salient feature, correlating with histologic severity and fibrosis in NASH (8). Inflammation on initial liver biopsy in patients with NASH was an independent predictor of progression to advanced fibrosis (5). Despite all of these potential and emerging mediators, the exact cellular and subcellular molecular mediators of these processes are not fully defined.
The endoplasmic reticulum (ER) has a well defined stress response and an emerging role in the regulation of lipid and carbohydrate metabolism (9). Classically, upon the accumulation of misfolded proteins in the ER lumen, the unfolded protein response (UPR) is activated under conditions of ER stress. The UPR is mediated by three ER transmembrane proteins, inositol-requiring enzyme 1α (IRE1α), protein kinase RNA-activated-like ER kinase, and activating transcription factor 6α (ATF6α). The UPR mediators activate signals that reduce translation rate, thus limiting new proteins entering the ER and increasing the folding capacity of the ER. The sum total of these events is aimed at restoring ER homeostasis. However, under conditions of a sustained and unrelenting ER stress, apoptosis ensues. The exact pathways that mediate ER stress-induced apoptosis are not well defined. C/EBP homologous protein (CHOP), a transcription factor, activated downstream of protein kinase RNA-activated-like ER kinase, is a potent mediator of ER stress-induced apoptosis (10). However the role of CHOP in mediating either hepatocyte apoptosis or hepatic inflammation in NASH is unknown.
CHOP is a basic leucine zipper domain transcription factor undetectable in normal cells and induced by cellular stress including ER stress (11, 12). CHOP-deficient cells are resistant to cell death induced by ER stress-inducing agents (10). Mice lacking CHOP, Chop−/−, develop normally, and under normal chow conditions female mice develop increased adiposity over several months (13). Chop−/− mice are protected from diabetes in several mouse models of type 2 diabetes mellitus by decreasing beta cell apoptosis and improving beta cell proliferation (14). In isolated cells CHOP is implicated in palmitic acid (PA)-induced expression of the proapoptotic protein PUMA and potentially in mediating hepatocyte apoptosis under high concentrations of PA (15, 16). However, CHOP has both proapoptotic and proinflammatory properties, depending on the stimulus, disease, and tissue context, and its precise role in fatty liver disease remains unclear (17). Herein, we examined the role of CHOP in animal models of NASH. Our principal findings are that CHOP protects mice from the development of steatohepatitis. CHOP deletion sensitizes to the development of liver injury and inflammation, the latter due to sustained survival of activated hepatic macrophages in CHOP deficient mice, thus potentiating steatohepatitis. These findings demonstrate a novel role for CHOP as a disease-preventing factor in NASH and highlight the complexity of the UPR in specific hepatic cell types.
EXPERIMENTAL PROCEDURES
Animal Husbandry
Chop−/− mice have been described (10). They were a gift from Dr. David Ron. Experimental protocols involving the use of animals were approved by the University Committee on Use and Care of Animals at the University of Michigan, the Institutional Animal Use and Care Committee at Mayo Clinic, and at the Sanford Burnham Medical Research Institute. Mice were housed with 12 h of light and dark cycles and ad libitum access to water and diets. 45% kcal high fat diet (HFD) (catalogue no. D07081501) or a 10% kcal fat control diet (CD) (catalogue no. D12450B) were from Research Diets and fed for 16 weeks. The methionine- and choline-deficient (MCD, catalogue 960439) diet and its control methionine- and choline-sufficient (MCS, catalogue no. 960441) diet were from MP Biochemicals and fed for 3 weeks.
Animal Procedures
Body mass and fasting blood glucose levels were measured after a 6-h fast. Glucose and insulin tolerance tests were performed after a 6-h fast, and pyruvate tolerance tests were performed after a 16-h fast as previously described (14). Chimeric mice were generated as described (18). Allowing 6 weeks for reconstitution, mice were fed either MCS or MCD diet for 3 weeks. Blood and liver tissues were collected from euthanized mice.
Histologic Analyses
Steatohepatitis was evaluated in H&E-stained formalin-fixed paraffin-embedded 5 μm liver sections according to a validated system for nonalcoholic fatty liver disease (2). Hepatocyte apoptosis was identified through TUNEL staining of 5 μm formalin fixed-tissue sections by the Cancer Center Research Laboratory Tissue Core using the Apoptag peroxidase in situ apoptosis detection kit (Millipore) according to the manufacturer's instructions. Picrosirius red staining for collagen was as described (19). Immunohistochemistry was performed using F4/80 antibody (eBioscience) at 1:50 dilution, as described (18). Quantification of the F4/80-positive surface area in each tissue section was performed with KS400 Image Analysis Software (Carl Zeiss, Inc.) and expressed as a percent of total surface area of each liver section.
Detection of Apoptotic Macrophages
The Click-iT TUNEL Alexa Fluor 488 imaging assay (Invitrogen) was used to detect apoptotic cells in 5 μm cryosections according to the manufacturer's instructions. Next, F4/80 was detected as described using 1:500 diluted Alexa Fluor 594 donkey anti-rat secondary antibody (Invitrogen). Sections were then mounted in Prolong antifade with DAPI, and images were acquired with an inverted Ziess laser-scanning confocal microscope (Ziess LSM 510, Carl Ziess Inc.). For quantification dual F4/80- and TUNEL-positive cells were counted in 10 random 400× fields by a blinded observer.
Serum Measurements
Total serum cholesterol at weeks 4 and 8 was determined with the cholesterol E assay (Wako). The terminal cholesterol and triglyceride (TG) levels were analyzed by the Metabolomics and Obesity Center, University of Michigan. Serum FFAs at weeks 4, 8, and 16 were measured using HR series NEFA-HR assay (Wako). ALT levels were determined using a Siemens Advia 2400 auto analyzer at the University of Michigan, Department of Chemical Pathology.
Quantitative Polymerase Chain Reaction
Total RNA was isolated from the livers. mRNA expression was normalized to 18 S or β-actin, performed as previously described (20, 21) using primers summarized in Table 1 (22, 23).
TABLE 1.
Sequences for quantitative PCR primers
F, forward; R, reverse; PDI, protein disulfide isomerase; Gadd34 growth arrest and DNA damage 34; α2-SMA, α2 smooth muscle actin; Col-1A1, collagen 1a1; DR-5, death receptor 5; TIMP1, tissue inhibitor of metalloproteinases 1.
| Gene | 5′ to 3′ Sequence | |
|---|---|---|
| 18 S | F | CGCTTCCTTACCTGGTTGAT |
| R | GAGCGACCAAAGGAACCATA | |
| Actin | F | GATCTGGCACCACACCTTCT |
| R | GGGGTGTTGAAGGTCTCAAA | |
| BiP | F | GGTGCAGCAGGACATCAAGTT |
| R | CCCACCTCCAATATCAACTTGA | |
| PDI | F | CAAGATCAAGCCCCACCTGAT |
| R | AGTTCGCCCCAACCAGTAGT | |
| CHOP | F | CTGCCTTTCACCTTGGAGAC |
| R | CGTTTCCTGGGGATGAGATA | |
| ATF4 | F | ATGGCCGGCTATGGATGAT |
| R | CGAAGTCAAACTCTTTCAGATCCATT | |
| Gadd34 | F | CCCGAGATTCCTCTAAAAGC |
| R | CCAGACAGCAAGGAAATGG | |
| sXBP1 | F | GAGTCCGCAGCAGGTG |
| R | GTGTCAGAGTCCATGGGA | |
| WFS-1 | F | GTAGCAAGTGGCCCGTCTTC |
| R | TGCAGTTGAGGCAGCTGATG | |
| Erp72 | F | TCCCATTGCTGTAGCGAAGAT |
| R | GGGGTAGCCACTCACATCAAAT | |
| Erp57 | F | CGCCTCCGATGTGTTGGAA |
| R | CAGTGCAATCCACCTTTGCTAA | |
| α2-SMA | F | GTCCCAGACATCAGGGAGTAA |
| R | TCGGATACTTCAGCGTCAGGA | |
| Col-1A1 | F | GCTCCTCTTAGGGGCCACT |
| R | CCACGTCTCACCATTGGGG | |
| TGF-β1 | F | CTCCCGTGGCTTCTAGTGC |
| R | GCCTTAGTTTGGACAGGATCTG | |
| TIMP1 | F | AGGTGGTCTCGTTGATTTCT |
| R | GTAAGGCCTGTAGCTGTGCC | |
| FAS | F | TATCAAGGAGGCCCATTTTGC |
| R | TGTTTCCACTTCTAAACCATGCT | |
| FAS-Ligand | F | TCCGTGAGTTCACCAACCAAA |
| R | GGGGGTTCCCTGTTAAATGGG | |
| TRAIL | F | ATGGTGATTTGCATAGTGCTCC |
| R | GCAAGCAGGGTCTGTTCAAGA | |
| DR-5 | F | CGGGCAGATCACTACACCC |
| R | TGTTACTGGAACAAAGACAGCC | |
| Il-6 | F | TAGTCCTTCCTACCCCAATTTCC |
| R | TTGGTCCTTAGCCACTCCTTC | |
| Il-1β | F | GCAACTGTTCCTGAACTCAACT |
| R | ATCTTTTGGGGTCCGTCAACT | |
| CRP | F | ATGGAGAAGCTACTCTGGTGC |
| R | ACACACAGTAAAGGTGTTCAGTG | |
| MIP-1α | F | TTCTCTGTACCATGACACTCTGC |
| R | CGTGGAATCTTCCGGCTGTAG | |
| MCP-1 | F | TTAAAAACCTGGATCGGAACCAA |
| R | GCATTAGCTTCAGATTTACGGGT | |
| TNF-R1 | F | CCGGGAGAAGAGGGATAGCTT |
| R | TCGGACAGTCACTCACCAAGT | |
| TNF-α | F | CCCTCACACTCAGATCATCTTCT |
| R | GCTACGACGTGGGCTACAG | |
| PPARα | F | AGAGCCCCATCTGTCCTCTC |
| R | ACTGGTAGTCTGCAAAACCAAA | |
| PPARδ | F | TCCATCGTCAACAAAGACGGG |
| R | ACTTGGGCTCAATGATGTCAC | |
| PPARγ | F | TCGCTGATGCACTGCCTATG |
| R | GAGAGGTCCACAGAGCTGATT | |
| C/EBPα | F | TGGACAAGAACAGCAACGAG |
| R | TCACTGGTCAACTCCAGCAC | |
| C/EBPβ | F | ACCGGGTTTCGGGACTTGA |
| R | GTTGCGTAGTCCCGTGTCCA | |
| C/EBPγ | F | ACGTGCCCAAATGAGCAAGC |
| R | CTGAGGAACCTGCTGTAAGC |
Protein Isolation and Western Blotting
Liver protein extracts in radioimmune precipitation assay buffer were resolved by SDS-PAGE as described (18). The following primary antibodies were used: p-eIF2α (Invitrogen), eIF2α (Cell Signaling Technology), CHOP, ATF4, C/EBPα, C/EBPβ, PPARγ, Fas, and actin (Santa Cruz Biotechnology), and α-tubulin (Sigma). Densitometry was performed using Image J (National Institutes of Health). For each experiment the protein of interest was normalized to its loading control and then expressed relative to vehicle control-treated conditions.
Macrophage Isolation
Bone marrow harvested from the hind legs of euthanized mice by flushing with Hanks' balanced salt solution was plated in sterile Petri dishes in bone marrow differentiation medium consisting of RPMI, 10% fetal bovine serum, and 20% L929 cell-conditioned medium (18). Medium was changed on days 3 and 5, and differentiated macrophages were used for experiments on day 7. Cells were treated with PA as previously described, and apoptosis was assessed by DAPI-stained nuclear morphology (24).
Lipidomics
Lipidomics analysis for liver total lipid fatty acid content and serum FFA was performed by the Metabolomics and Obesity Center of the University of Michigan. TG and FFA were separated by thin-layer chromatography. Fatty acid composition was done by transmethylation to their methyl esters and gas chromatography. Liver TG content was measured using the Infinity TG reagent (Sigma) as described (25).
Statistical Analysis
Data are presented as the mean ± S.E. unless indicated otherwise. Statistical analysis was performed using two-tailed Student's t tests. Statistical significance was set at p ≤ 0.05.
RESULTS
CHOP Deletion Sensitizes Mice to the Development of Dietary Obesity
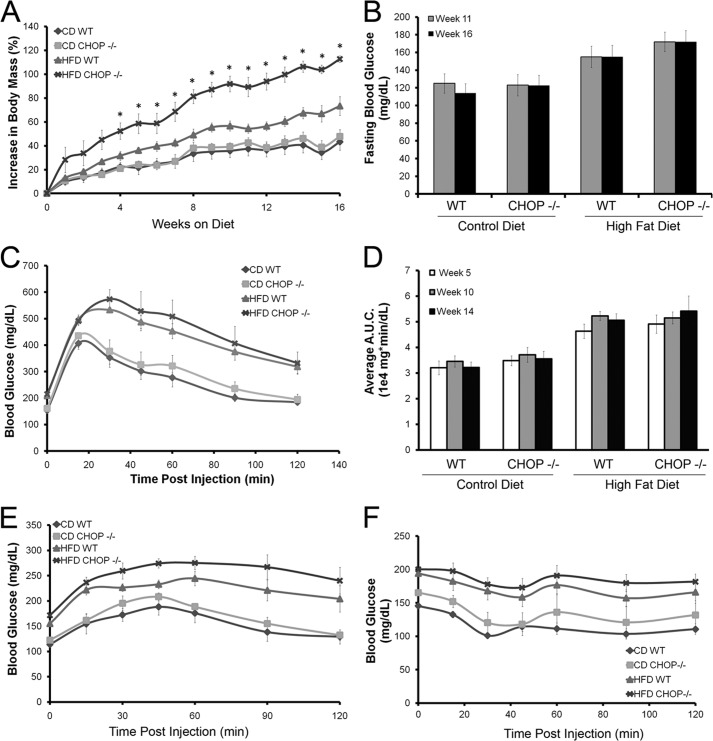
HFD-fed mice gained weight; however, Chop−/− mice gained significantly more weight, 110 ± 3% at week 16 compared with HFD-fed Chop+/+ mice, 84 ± 8% (p < 0.005, Fig. 1A). Weight gain was associated with features of insulin resistance in both genotypes. HFD-fed Chop−/− and Chop+/+ mice developed significant fasting hyperglycemia (Fig. 1B). Glucose tolerance testing performed at weeks 5, 10 (data not shown), and 14 (Fig. 1C) demonstrated a significantly greater increase in blood glucose and delayed glucose disposal in HFD-fed compared with CD-fed mice, i.e. the area under the glucose disposal curve upon glucose tolerance testing (Fig. 1D). Similarly, hepatic gluconeogenesis, tested by pyruvate tolerance testing at week 15 (Fig. 1E), demonstrated sustained elevation of blood sugars in the HFD-fed groups compared with the CD-fed groups. Insulin tolerance testing at week 16 (Fig. 1F) demonstrated impaired insulin sensitivity among the HFD-fed mice. Given the role of FFAs in lipotoxicity, circulating levels were measured at weeks 4, 8, and 16 and were not elevated in the HFD-fed Chop−/− mice despite greatest weight gain (Table 2). Total cholesterol levels were significantly elevated at week 4 in both Chop−/− and Chop+/+ HFD-fed mice and remained elevated at weeks 8 and 16 compared with the CD-fed mice (data not shown and Table 2). Overall, both HFD-fed Chop+/+ and Chop−/− mice were obese with several features of insulin resistance compared with CD-fed mice; however, HFD-fed Chop−/− mice demonstrated a greater increase in body mass but not greater insulin resistance.
FIGURE 1.
Metabolic characteristics of HFD-fed and CD-fed littermate CHOP wild type (Chop+/+) and knock-out (Chop−/−) mice (n = 5–6 per group). A, percent increase in body mass is shown for all four groups. Chop−/− HFD-fed mice demonstrated the greatest increase in body mass; this was significant at week 4 and remained significant for the duration of the study (*, p < 0.05). B, fasting blood glucose was measured at weeks 11 and 16. HFD-fed mice developed progressive hyperglycemia (p < 0.05, compared with CD-fed mice). No differences were observed between Chop+/+ and Chop−/− mice (p = not significant). C, shown are glucose disposal curves after intraperitoneal injection of glucose at week 14. HFD-fed mice developed progressive glucose intolerance. No differences were seen between Chop+/+ and Chop−/− mice. D, the area under the curve (A.U.C.) of the glucose tolerance test done at weeks 5, 10, and 14 demonstrated progressive glucose intolerance in the HFD-fed mice (p < 0.05, compared with CD-fed mice). No differences were observed between Chop+/+ and Chop−/− mice (p = ns). E, pyruvate tolerance testing done at week 15 showed enhanced hepatic glucose production among HFD-fed Chop+/+ and Chop−/− mice (p < 0.05, compared with CD-fed mice) without a genotypic difference between the two groups (p = ns). F, an intraperitoneal insulin tolerance test at week 16 demonstrated progressive insulin resistance in the HFD-fed mice (p < 0.05, compared with CD-fed mice) without genotypic differences between Chop+/+ and Chop−/− mice (p = not significant).
TABLE 2.
NEFA (nonesterified fatty acid) at weeks 4, 8, 16 and serum lipids at week 16 in high fat fed mice
| Serum lipids | CD wild type | CD Chop−/− | HFD wild type | HFD Chop−/− |
|---|---|---|---|---|
| NEFAa (meq/liter) | 1.172 ± 0.065 | 1.137 ± 0.133 | 1.222 ± 0.125 | 1.134 ± 0.103 |
| NEFAb (meq/liter) | 0.848 ± 0.087 | 0.688 ± 0.121 | 0.800 ± 0.044 | 0.630 ± 0.020 |
| Triglyceridec (mg/dl) | 75 ± 7 | 94 ± 8 | 91 ± 4 | 70 ± 5 |
| Cholesterolc (mg/dl) | 101.7 ± 8.7 | 114.8 ± 9.8 | 163.7 ± 9.5 | 188.3 ± 19.2 |
| NEFAc (meq/liter) | 0.941 ± 0.139 | 1.193 ± 0.153 | 0.0.865 ± 0.048 | 1.017 ± 0.118 |
a Week 4 (fasted).
b Week 8 (fasted).
c Week 16 (fed).
Chop−/− Mice Develop Steatohepatitis
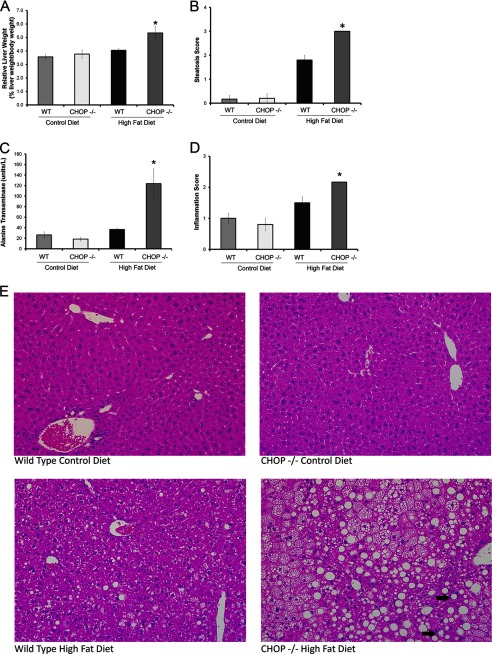
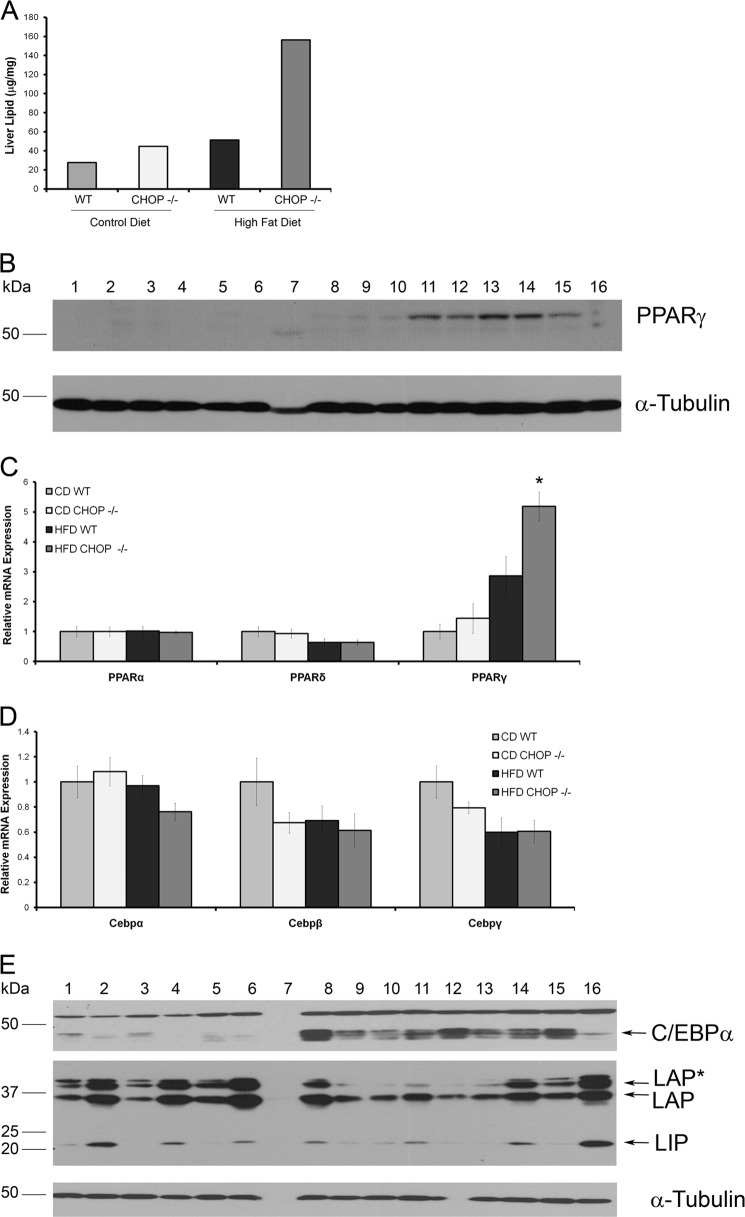
HFD-fed Chop−/− mice demonstrated significant hepatomegaly. Due to significant differences in body weight gain, liver mass was normalized to body weight and was significantly elevated in the Chop−/− HFD-fed mice (p < 0.05, Fig. 2A). Both HFD-fed groups demonstrated liver steatosis, although the histologic steatosis score (Fig. 2B) was significantly greater in the HFD-fed Chop−/− mice (p < 0.001). Alanine transaminase (ALT) levels (Fig. 2C, p < 0.05) and lobular inflammation were significantly greater in HFD-fed Chop−/− mice compared with Chop+/+ mice (Fig. 2D, p < 0.05), indicative of significant liver injury and inflammation, respectively. Representative liver sections are shown in Fig. 2E. The increase in liver mass was due to excess lipid deposition in hepatocytes. Liver total lipid content was 3-fold greater in the HFD-fed Chop−/− mice as compared with Chop+/+ mice (Fig. 3A). The increase in lipid in the HFD-fed Chop−/− mice liver was associated with increased expression of PPARγ protein and mRNA as compared with the Chop+/+ mice (Fig. 3, B and C). The expression of C/EBPα, C/EBPβ, PPARα, and PPARδ was unchanged (Fig. 3, C–E). Thus, CHOP deletion sensitized to the development of steatosis and steatohepatitis, as Chop−/− mice developed hepatomegaly, liver injury, and histologic steatohepatitis upon HFD-feeding.
FIGURE 2.
Liver injury develops in HFD fed CHOP knock-out (Chop−/−) mice (n = 5–6 per group). A, relative liver weight of all four experimental groups is shown. Chop−/− mice developed significant hepatomegaly upon HFD-feeding for 16 weeks (*, p < 0.05). B, histologic steatosis score for all four groups is shown. HFD-fed Chop−/− mice had the greatest hepatic steatosis, significantly greater than the Chop+/+ group (*, < 0.001). C, alanine transaminase levels from all four groups are shown. HFD-fed Chop−/− mice had the greatest elevations in serum alanine transaminase (*, p < 0.05, compared with HFD-fed Chop+/+). D, histologic inflammation score for the four groups is shown. Significantly greater inflammation was observed in the HFD-fed Chop−/− mice (p < 0.05, compared with HFD-fed Chop+/+). E, representative H&E-stained liver sections from all four groups are shown. The bottom right panel from HFD-fed Chop−/− mice demonstrates characteristic features of steatohepatitis. The arrows point to inflammatory foci surrounding steatotic hepatocytes.
FIGURE 3.
PPARγ gene expression in HFD-fed mouse livers. A, liver lipid content in CD-fed Chop+/+, Chop−/−, and HFD Chop+/+ and Chop−/− is shown. B, Western blot analysis for PPARγ in CD-fed Chop+/+ (lanes 1–3), Chop−/− (lanes 4–6), and HFD-fed Chop+/+ (lanes 7–10), and Chop−/− (lanes 11–15) is shown. Lane 16 is epididymal fat, included as the control. α-Tubulin is the loading control. C, relative mRNA expression for PPARα, PPARδ, and PPARγ from all four experimental groups is shown. PPARγ expression was significantly increased in HFD-fed Chop−/− mice compared with HFD-fed Chop+/+ mice (*, p < 0.05). D, relative mRNA expression for C/EBPα, C/EBPβ, and C/EBPγ from all four groups shows that levels were comparable. E, Western blot analysis for C/EBPα and C/EBPβ in CD-fed Chop+/+ (lanes 1–3), Chop−/− (lanes 4–6), HFD-fed Chop+/+ (lanes 8–10), and Chop−/− (lanes 11–15) is shown. Lane 16 is tunicamycin-injected Chop+/+ liver. Lane 7 was unloaded in error. α-Tubulin is the loading control. Nonspecific bands were seen for both C/EBPα and C/EBPβ; therefore, the arrows point to the correct bands based on predicted molecular weight. C/EBPβ isoforms are indicated. LAP*, the full-length liver-enriched transcriptional activator protein; LAP, 21 amino acids are truncated at the N terminus; LIP, liver-enriched transcriptional inhibitory protein.
Chop−/− Mice Develop Hepatocyte Apoptosis and Fibrosis
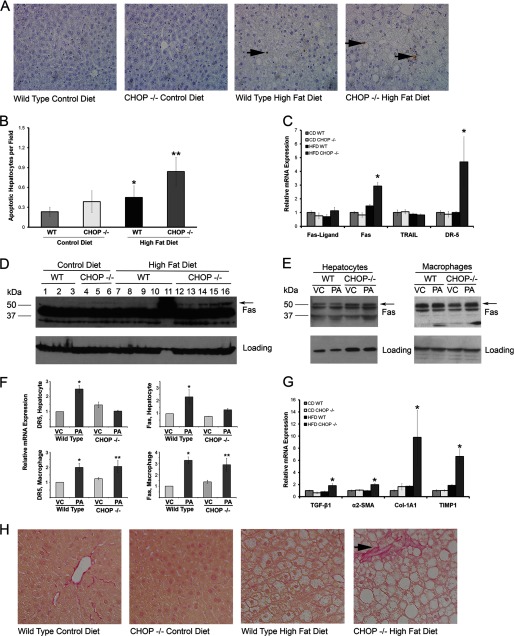
Hepatocyte apoptosis is a pathogenic event in progressive forms of NASH (8). Given the presence of histologic steatohepatitis in HFD-fed Chop−/− mice, hepatocyte apoptosis was assessed. Indeed, hepatocyte apoptosis was increased in HFD-fed Chop+/+ and Chop−/− mice compared with CD-fed Chop+/+ mice (Fig. 4, A and B, p < 0.05). Increased death receptor expression correlates with apoptosis in NASH; therefore, liver mRNA expression for the death receptors Fas and death receptor 5 (DR-5) was assessed by quantitative PCR. The HFD-fed Chop−/− had a significantly greater increase in expression of both death receptors (p < 0.05, Fig. 4C), although no increase was observed in their ligands, FasL and TRAIL. Furthermore, whole liver Fas protein levels were increased in HFD-fed Chop−/− mice (Fig. 4D). Whole liver DR5 expression could not be assessed due to a lack of specific antibodies. We next dissected the contribution of isolated hepatocytes and macrophages to increased Fas and DR5 expression using an in vitro model of PA lipotoxicity (24). We found a slight increase in Fas protein in PA-treated Chop−/− macrophages (Fig. 4E) without a corresponding increase in hepatocytes. Fas and DR5 mRNA were also induced upon PA treatment in Chop+/+ and Chop−/− macrophages (Fig. 4F). Fas and DR5 mRNA were increased only in Chop+/+ hepatocytes (Fig. 4F). These findings suggest that macrophages contribute to the significantly greater Fas and DR5 mRNA expression, and Fas protein expression, observed in vivo, due to greater macrophage accumulation under these conditions (Fig. 5, B and C). In this experiment CHOP deletion did not protect hepatocytes from apoptosis, in fact, apoptosis was greatest in HFD-fed Chop−/−, consistent with histologic and biochemical steatohepatitis. In keeping with chronic inflammation and ongoing apoptosis, in HFD-fed Chop−/− mice pericellular fibrosis was increased compared with the HFD-fed Chop+/+ mice (Fig. 4H). The expression of key genes that regulate hepatic fibrosis, transforming growth factor β1, α-2 smooth muscle actin, collagen 1a1, and tissue inhibitor of metalloproteinases 1 were all increased in HFD-fed Chop−/− mice (Fig. 4G). Taken together, these data identify paradoxically greater death receptor expression and hepatic fibrosis in Chop−/− mice on a HFD.
FIGURE 4.
Hepatocyte apoptosis and fibrosis occur in mice with steatohepatitis (n = 5–6 per group). A, representative photomicrographs of liver sections stained with Apoptag to detect apoptotic nuclei are shown from all four groups. The arrows point to apoptotic hepatocyte nuclei. The far right panel is from HFD-fed Chop−/− mice. B, Apoptag-stained liver sections were quantified for each of the CD-fed and HFD-fed Chop+/+ and Chop−/− livers. Increased hepatocyte apoptosis was seen in the HFD-fed Chop−/− mice when compared with the HFD-fed Chop+/+ mice (**, p < 0.05). Increased apoptosis was also seen in HFD-fed Chop+/+ mice compared with CD-fed Chop+/+ mice (*, p < 0.05). C, death receptor expression by quantitative PCR in all four groups is shown. HFD-fed Chop−/− mice had a significant increase in mRNA expression of Fas and death receptor 5 (DR-5) (*, p < 0.05). D, whole liver Fas expression by Western blotting is shown. Lane numbers, dietary groups, and genotypes are indicated. The arrow points to the band specific for Fas based on predicted molecular weight. The prominent nonspecific band was seen in all samples. Glyceraldehyde 3-phosphate dehydrogenase (GAPDH) was used as a loading control. E, a Western blot for Fas in isolated hepatocytes (left panel) from Chop+/+ (WT) and Chop−/− is shown. The arrow points to the predicted Fas band. GAPDH was used as the loading control. Western blot for Fas in isolated bone marrow-derived macrophages (right panel) from Chop+/+ (WT) and Chop−/− is shown. The arrow points to the predicted Fas band. Actin was used as the loading control. Cells were treated with 800 μm PA or vehicle (VC) for 8 h. F, relative mRNA expression for DR5 and Fas in isolated primary hepatocytes and bone marrow-derived macrophages treated with 800 μm PA for 8 h or vehicle (VC) is shown. Both Fas and DR5 were induced in primary wild type hepatocytes (*, p < 0.05, compared with WT-VC) upon PA treatment. In macrophages, mRNA for DR5 and Fas were induced in wild type (p < 0.05, compared with WT-VC) and induced in Chop−/− macrophages (**, p < 0.05, compared with Chop−/−-VC). G, expression of genes that regulate hepatic fibrosis by quantitative PCR in all four groups is shown. HFD-fed Chop−/− mice had a significant increase in mRNA expression of transforming growth factor-β1 (TGF-β1), α2 smooth muscle actin (α2-SMA), collagen 1-α 1 (Col1-A1), and tissue inhibitor of metalloproteinases 1 (TIMP1) (*, p < 0.05). H, representative photomicrographs of Sirius red-stained liver sections from all four groups are shown. The arrow points to characteristic pericellular fibrosis seen in the HFD-fed Chop−/− mice.
FIGURE 5.
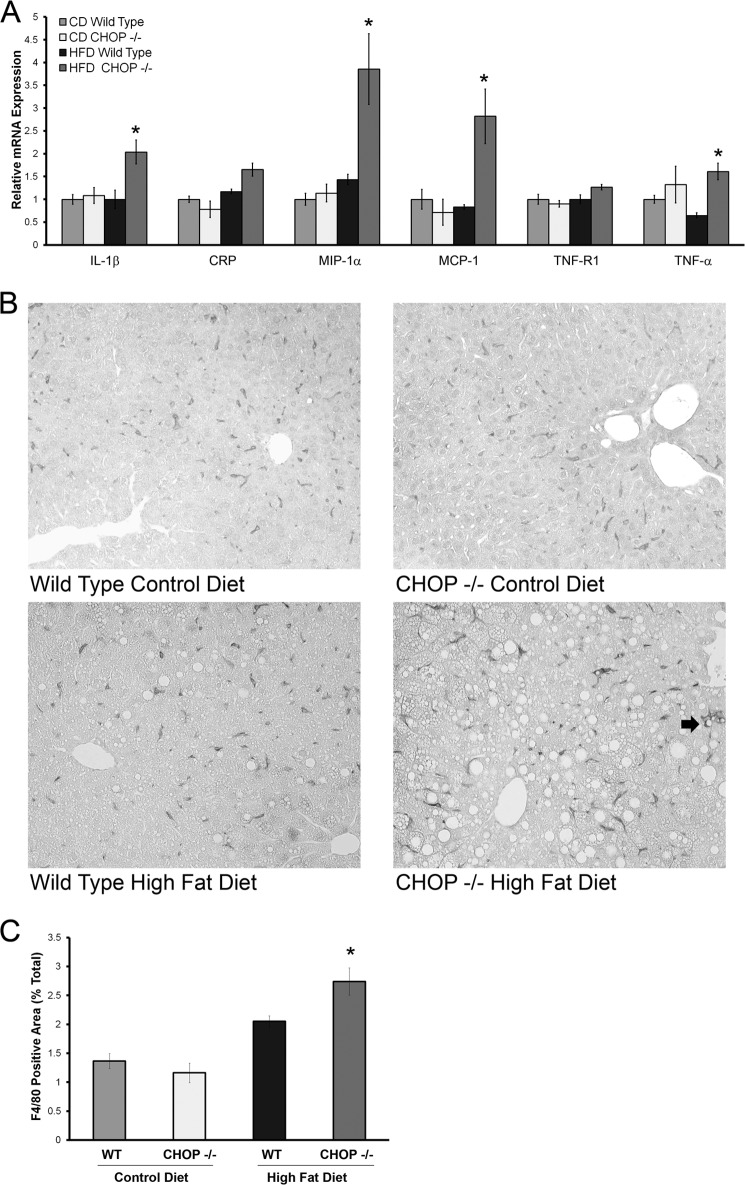
Inflammation and Kupffer cell activation in HFD-fed CHOP knock-out (Chop−/−) mice. A, relative gene expression of several inflammatory markers from livers of CD and HFD fed mice is shown. A significant increase in expression of interleukin 1β (IL-1β), MIP-1α, MCP-1, and TNF-α was seen (*, p < 0.05, compared with HFD-fed Chop+/+). B, representative photomicrographs of F4/80-stained liver sections from CD and HFD-fed Chop+/+ and Chop−/− mice are shown. The arrow in the bottom right picture points to a cluster of F4/80-positive cells in HFD-fed Chop−/− liver. C, quantitative morphometry for the F4/80-positive area expressed as a percent of total area of each liver section is shown. In HFD-fed Chop−/− there was a significant increase in F4/80 positive surface area (p < 0.05 compared with HFD-fed Chop+/+).
CHOP Deletion Promotes Inflammation and Macrophage Activation
Inflammation distinguishes NASH from benign steatosis. Therefore, in the HFD-fed Chop−/− and Chop+/+ mice inflammatory gene expression was analyzed. Hepatic expression of inflammatory mediators, interleukin 1β, macrophage inflammatory protein-1α (MIP-1α), macrophage chemoattractant protein-1 (MCP-1), and tumor necrosis factor-α was significantly greater in the HFD-fed Chop−/− mice (Fig. 5A). Both MIP-1α and MCP-1 are produced by activated macrophages and are key chemokines in the ensuing inflammatory response (26–28). Injury-activated macrophages in the liver may be derived from Kupffer cells or liver-resident macrophages or recruited from bone marrow-derived monocytes (29, 30). Activated macrophages form a feed-forward loop in perpetuating liver inflammation and injury; therefore, we assessed macrophage activation in this model of NASH by F4/80 immunohistochemistry, a murine macrophage-specific marker. An increase in F4/80-positive macrophages was evident in HFD-fed Chop−/− mice (Fig. 5B). Quantification of F4/80 positivity (Fig. 5C) was consistent with a significant increase in F4/80-positive cells under HFD in Chop−/− mice. Altogether these data demonstrate greater numbers of activated macrophages in HFD-fed Chop−/− mice.
Palmitate Activates Macrophages and Induces the UPR
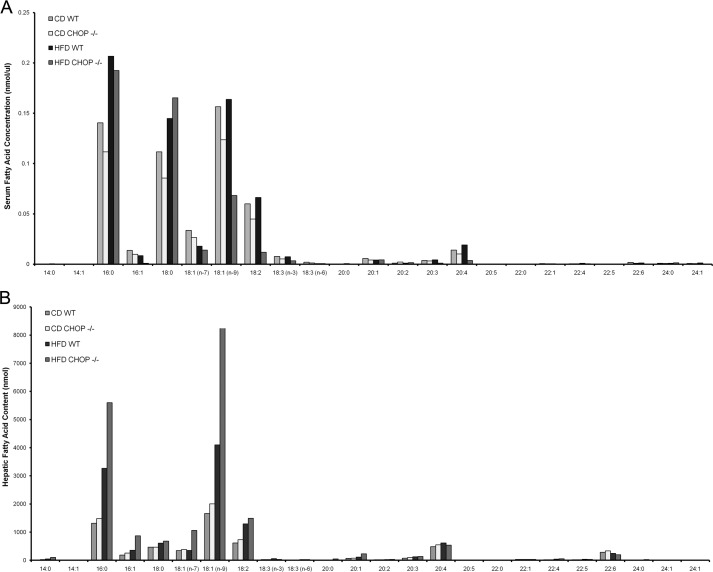
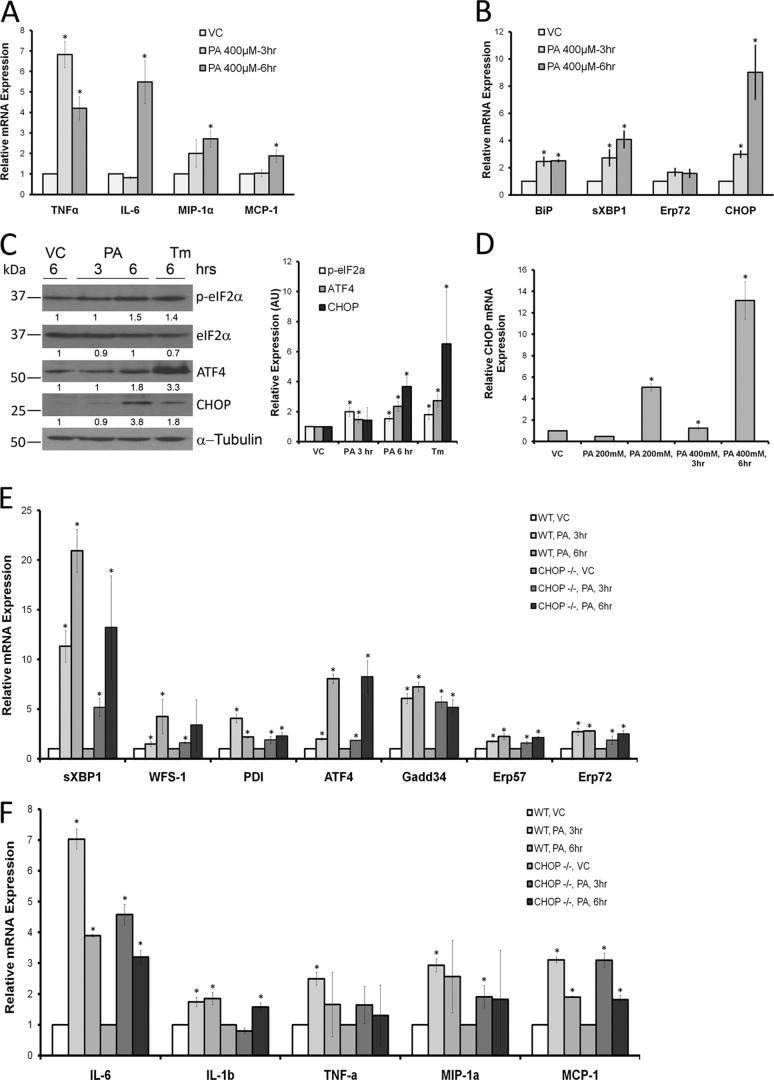
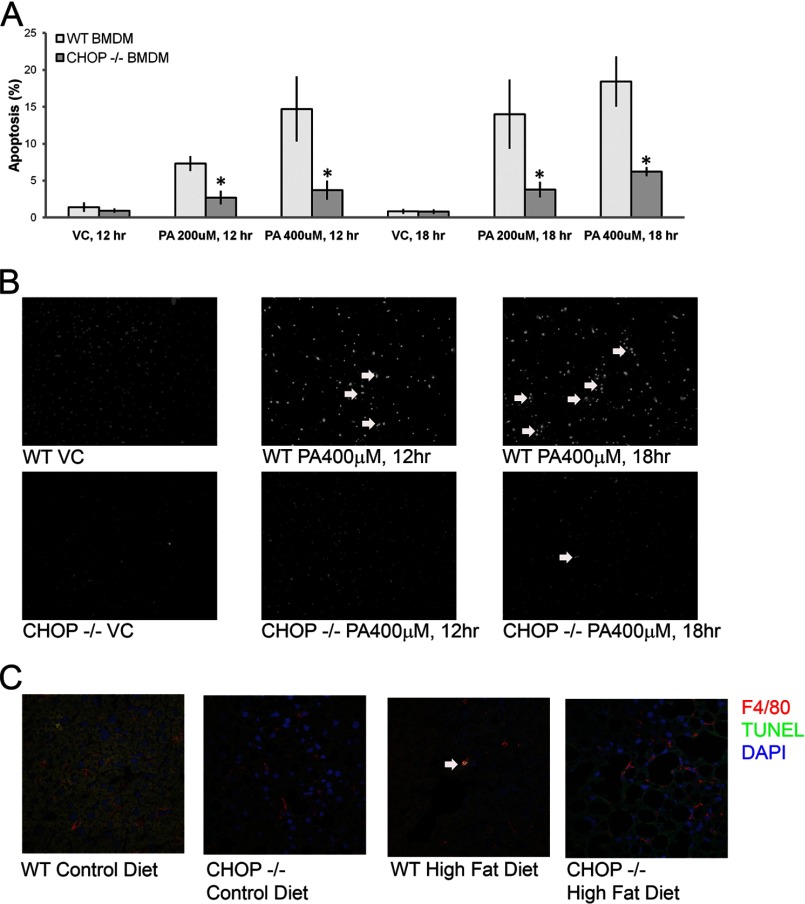
Based on the activation of macrophages seen histologically in HFD-fed Chop−/− mice, a mouse macrophage cell line was challenged with PA. PA was utilized in these studies because it is physiologically abundant, a known mediator of apoptosis in models of lipotoxicity, and enriched in the sera and livers of HFD-fed mice in these studies (Fig. 6). RAW 264.7 cells were activated upon treatment with PA in a concentration (200 μm, not shown)- and time-dependent manner (Fig. 7A). PA-induced activation was associated with the UPR including increased CHOP expression (Fig. 7B). mRNA abundance of several UPR markers, binding immunoglobulin protein (BiP), spliced XBP1, Erp72, and CHOP, was significantly increased. CHOP protein expression was also enhanced, as shown by immunoblot analysis of PA-treated RAW 264.7 cells (Fig. 7C). PA treatment induced phosphorylation of eIF2α and increased protein expression of ATF4 and CHOP. Thus, PA activated macrophages; this activation was associated with the UPR. PA-induced macrophage activation and its association with the UPR were further confirmed in primary bone marrow (BM)-derived macrophages. CHOP was detected only in macrophages from Chop+/+ mice and induced by PA (Fig. 7D). Consistent with the data from RAW 264.7 cells, signaling events emanating from activation of inositol-requiring enzyme 1α (IRE1α) and protein kinase RNA-activated-like ER kinase and suggestive of activation of ATF6α were detected in primary macrophages as well (Fig. 7E). UPR markers were comparable between Chop+/+ and Chop−/− macrophages. Both Chop+/+ and Chop−/− macrophages were comparably activated upon PA treatment (Fig. 7F). As CHOP is a mediator of apoptosis under conditions of sustained ER stress and its deletion prevents ER stress-induced apoptosis, we assessed apoptosis in primary macrophages from Chop+/+ and Chop−/− mice upon treatment with PA. In Chop+/+ macrophages, PA treatment caused apoptosis in a time- and concentration-dependent manner (Fig. 8A). Apoptosis in Chop−/− macrophages was significantly reduced (p < 0.05). Apoptotic BM-derived macrophages are shown in Fig. 8B. Thus, CHOP mediates apoptosis in macrophages under conditions of PA-induced activation and UPR; this is abrogated in Chop−/− macrophages. Next, we assessed macrophage apoptosis in vivo by colocalization using immunofluorescence for F4/80 and the TUNEL assay. Macrophage apoptosis was a rare event (0.02 cells/400× field Chop+/+ CD); however, this was observed most frequently in HFD-fed Chop+/+ (0.2 cells/400× field) and not observed in HFD-fed Chop−/− livers, consistent with a role for CHOP in mediating macrophage apoptosis in vivo (Fig. 8C).
FIGURE 6.
Serum and liver fatty acid composition. A, serum FFA content from CD-fed and HFD-fed wild type (Chop+/+) and Chop−/−mice is shown. B, liver total lipid fatty acid composition from CD-fed and HFD-fed wild type (Chop+/+) and CHOP knock-out (Chop−/−) mice is shown.
FIGURE 7.
Macrophage activation and UPR induction by PA. A, relative mRNA expression of inflammatory markers from RAW 264.7 macrophages treated with PA is shown. A significant increase in expression of TNF-α, IL-6, MIP-1α, and MCP-1 was seen (*, p < 0.05). VC, vehicle. B, relative mRNA expression of UPR markers from RAW 264.7 macrophages treated with PA is shown. A significant increase in expression of binding immunoglobulin protein (BiP), sXBP1, and CHOP was seen (*, p < 0.05). Erp72, was also induced, although this did not achieve statistical significance. C, a representative Western blot analysis of PA-treated RAW 264.7 macrophages shows phosphorylation of eIF2α and induction of ATF4 and CHOP protein (left panel). α-Tubulin (Tm) is the loading control. Densitometric quantification of bands relative to vehicle-treated conditions is shown under each Western blot image. The panel on the right shows quantification of these bands from four experiments (*, p < 0.05, compared with vehicle). AU, absorbance units. D, relative CHOP mRNA expression of PA-treated wild type primary bone marrow-derived macrophages (BMDMs) shows a concentration- and time-dependent induction of CHOP mRNA. CHOP mRNA was not detected in BMDM from Chop−/− mice. E, relative gene expression of several UPR markers from PA-treated BMDM is shown. A significant increase in expression of sXBP1, WFS-1, protein disulfide isomerase (PDI), ATF4, growth arrest and DNA damage 34 (Gadd34), Erp57, and Erp72 was seen (*, p < 0.05) in BMDM from Chop+/+ and Chop−/− mice. F, relative gene expression of several inflammatory markers in PA treated BMDM from Chop+/+ and Chop−/− mice shows a significant increase in expression of IL-6, IL-1β, TNF-α, MIP-1α, and MCP-1 (*, p < 0.05).
FIGURE 8.
Cell death in Chop+/+ and Chop−/− macrophages. A, BMDMs from Chop+/+ (WT) and Chop−/− (KO) were treated with PA. Apoptosis in both was concentration- and time-dependent but was significantly abrogated in BMDM from Chop−/− mice (*, p < 0.05). VA, vehicle. B, representative fluorescent photomicrographs of BMDM nuclei stained with DAPI from PA-treated Chop+/+ and Chop−/− are shown. The white arrows point to apoptotic nuclei. Cells were treated with 400 μm palmitic acid for the indicated times. C, immunofluorescence for F4/80 is shown in red, and a TUNEL assay is in green for CD-fed and high fat diet-fed Chop+/+ and Chop−/− mice. The arrow points to an apoptotic F4/80 positive macrophage in HFD-fed Chop+/+ liver.
Sensitization to Liver Injury Is Independent of Obesity and Mediated by Macrophages
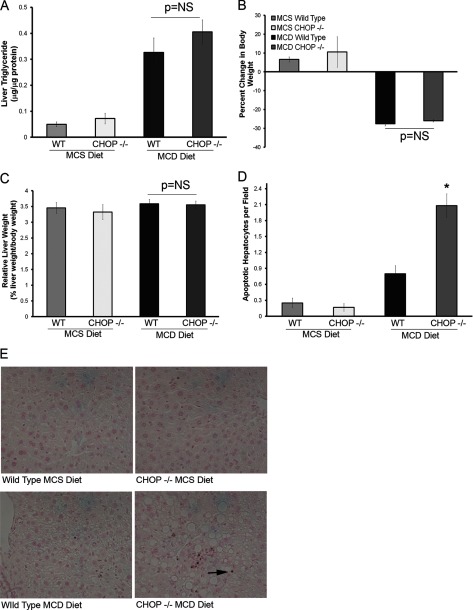
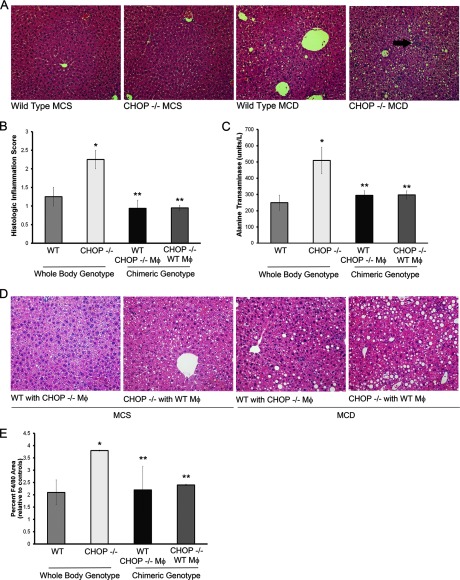
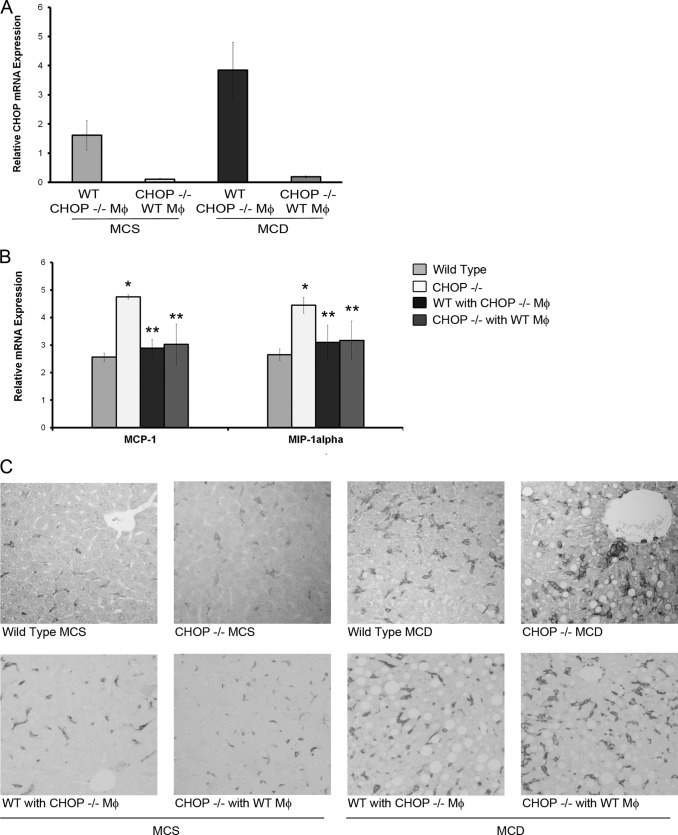
Due to greater weight gain and obesity in HFD-fed Chop−/− mice, the sensitization to liver injury could be attributed to greater obesity and hepatic steatosis. Therefore, Chop−/− mice were challenged with an alternative diet. The methionine- and choline-deficient diet (MCDD), and its CD, which is supplemented in methionine and choline diet, were fed to Chop+/+ and Chop−/− mice. MCDD-fed mice developed similar steatosis (histologic steatosis score: 1.25 ± 0.25 Chop+/+ and 1.5 ± 0.23 Chop−/−) and TG content (Fig. 9A) and had similar body weights and liver masses (Fig. 9, B and C). Similar to the HFD data, Chop−/− mice had an increase in hepatocyte apoptosis (Fig. 9, D and E). MCDD-fed Chop+/+ and Chop−/− mice developed steatohepatitis (Fig. 10A). Chop−/− mice had a significant increase in inflammatory foci (Fig. 10B), liver injury as reflected by the greater increase in serum ALT (p < 0.05, Fig. 10C), and macrophage accumulation (Fig. 10, D and E). To further dissect the contribution of CHOP in macrophages to liver injury, reciprocal bone marrow transplantation was performed to generate chimeric mice. Where Chop mRNA was not detected in Chop−/− mice transplanted with Chop−/− bone marrow, it was detected in the liver in whole body Chop−/− mice transplanted with Chop+/+ bone marrow (Fig. 11A), indicative of bone marrow engraftment and the presence of bone marrow-derived cells in the liver. ALT elevation, liver inflammation, and macrophage accumulation were significantly reduced in the chimeric mice compared with whole body Chop−/− mice fed the MCDD (Figs. 10, B–D, and 11B, p < 0.05 compared with MCDD-fed Chop−/− mice). We had fewer chimeric Chop−/− mice transplanted with Chop−/− bone marrow and Chop+/+ transplanted with Chop+/+ bone marrow. However, they were a phenocopy of the whole body genotypes. The ALT in Chop−/− to Chop−/− was 480 IU/ml, the NASH activity score was 7.5, and the TG content was 0.66 μg TG/μg of liver protein. The ALT in Chop+/+ to Chop+/+ was 203.5 IU/ml, the NASH activity score was 2.15, and the TG content was 0.4 ± 0.13 μg TG/μg of liver protein. TG content of reciprocally transplanted MCDD-fed chimeric mice was comparable to the Chop−/− to Chop−/−- and Chop+/+ to Chop+/+-transplanted mice. It was 0.4 ± 0.05 μg of TG/μg liver protein in Chop+/+-transplanted with Chop−/− bone marrow and 0.5 ± 0.1 μg of TG/μg liver protein in Chop−/−-transplanted with Chop+/+ bone marrow. The NASH activity score was 3.6 ± 0.3 for Chop−/− mice reconstituted with Chop+/+ marrow and 3.4 ± 0.5 for Chop+/+ reconstituted with Chop−/− marrow. Thus, data from MCDD-feeding demonstrate that CHOP deletion sensitizes to the development of liver injury independent of obesity and hepatic steatosis. Unexpectedly, chimeric Chop+/+ mice reconstituted with Chop−/− bone marrow also demonstrated protection from liver injury, inflammation, and macrophage accumulation. However, the abrogation of liver injury, inflammation, and macrophage accumulation in chimeric Chop−/− mice transplanted with Chop+/+ bone marrow supports a role for CHOP-mediated macrophage apoptosis as a modulator of the injury-inflammation response, as any and all CHOP expression in this group is donor-derived, and we see a corresponding decrease in injury, inflammation, and macrophage accumulation.
FIGURE 9.
Liver steatosis and hepatocyte apoptosis in MCD diet-fed CHOP knock-out (Chop−/−) mice. A, Liver TG content of MCS and MCD-fed mouse livers is shown. MCD-fed Chop+/+ and Chop−/− livers showed a significant increase in liver TG compared with MCS-fed mice of both genotypes. Both MCD-fed Chop+/+ and Chop−/− mice had comparable TG content. NS, not significant. B, percent change in body weight of MCS and MCD-fed Chop+/+ and Chop−/− mice is shown. MCD-fed mice lost body weight. There were no genotypic differences between the Chop+/+ and Chop−/− groups. C, relative liver weight of MCS and MCD-fed Chop+/+ and Chop−/− mice is shown. Relative liver weights were comparable across all four groups. D, Apoptag-stained liver sections were quantified for the MCS and MCD diet-fed groups. Hepatocyte apoptosis was significantly increased in the MCD diet-fed Chop−/− livers (*, p < 0.05). E, Apoptag-stained liver sections from MCS- and MCD-fed Chop+/+ and Chop−/− mice are shown. The arrows point to apoptotic hepatocytes.
FIGURE 10.
Macrophages mediate liver injury and inflammation in CHOP knock-out (Chop−/−) mice. Mice were fed the MCD diet and its CD, MCS diet. Data from whole body Chop+/+ and Chop−/− mice and from chimeric mice generated by bone marrow transplantation of Chop−/− mice with Chop+/+ bone marrow and reciprocally transplanted Chop+/+ mice with Chop−/− bone marrow are shown. A, representative H& E-stained liver sections from MCD-fed and MCS-fed Chop+/+ and Chop−/− mice are shown. The arrow points to an inflammatory focus. B, histologic scores for inflammation are shown from MCD-fed Chop+/+ and Chop−/− mice (whole body genotype), and chimeric mice from both groups (chimeric genotype) are shown. Inflammatory foci were significantly increased in Chop−/− mice (*, p < 0.05, compared with MCD-fed Chop+/+). Chimeric mice showed a significant attenuation in inflammation compared with MCD-fed Chop−/− mice (**, p < 0.05). MCS-fed mice had no liver inflammation and hence are not shown. C, MCD-fed Chop−/− mice had significantly greater elevation of serum ALT than Chop+/+ mice (*, p < 0.05); this was attenuated in chimeric mice (**, p < 0.05). MCS fed Chop+/+, Chop−/−, and chimeric mice had normal ALTs and are not shown. D, representative H&E-stained liver sections from chimeric mice fed the MCS and MCD diets are shown. E, quantitative morphometry for the F4/80-positive area expressed as a percent of total area and normalized to MCS fed controls is shown. There was a significant increase in F4/80 positive surface area in MCD-fed Chop−/− (p < 0.05 compared with MCD-fed Chop+/+). The increase in F4/80 was significantly reduced in chimeric mice (p < 0.05 compared with MCD-fed Chop−/−).
FIGURE 11.
Inflammation and macrophage accumulation in bone marrow chimeric mice. A, bone marrow reconstitution was assessed in chimeric mice by quantitative PCR for Chop expression. Chop mRNA was detected in Chop+/+ mice and not detected in Chop−/− mice. mRNA expression was normalized to Chop+/+ mouse transplanted with Chop+/+ bone marrow. CHOP was detected in liver samples of chimeric Chop−/− mice transplanted with Chop+/+ bone marrow 9 weeks after transplantation indicating successful bone marrow reconstitution. B, relative gene expression of inflammatory markers from livers of MCD diet fed Chop+/+, Chop−/− (whole body genotypes) and reciprocally transplanted chimeric mice is shown. A significant increase in expression of MIP-1α and MCP-1 was seen in MCD-fed Chop−/− mice (*. p < 0.05, compared with MCD fed-Chop+/+), and this was attenuated in MCD-fed chimeric mice (**, p < 0.05, compared with to MCD fed-Chop−/−). Data are normalized to MCS diet fed control animals. C, representative photomicrographs of F4/80 liver sections from MCS and MCD diet-fed Chop+/+ and Chop−/− mice (top row) and reciprocally transplanted chimeric mice (bottom row) are shown.
DISCUSSION
The principle findings of this study demonstrate a novel role for C/EBP homologous protein in nonalcoholic steatohepatitis. The loss of CHOP led to (i) development of steatohepatitis, (ii) activation of the innate immune system in steatohepatitis, and (iii) decreased macrophage apoptosis under conditions of FFA-induced ER stress.
CHOP deletion led to the development of significant steatohepatitis in mice. Chop−/− male mice became more obese compared with their littermate controls, consistent with published studies (13, 31). Obese Chop−/− mice developed hepatomegaly. Histologically hepatocyte steatosis and biochemically total liver TG were greatly elevated in the Chop−/− mice. Increased hepatic expression of PPARγ protein and mRNA were found in Chop−/− mice. We propose increased PPARγ expression, as the mechanism for the enhanced steatosis observed in Chop−/− mice was recently shown in adipose tissue (31). CHOP binds to C/EBPβ and prevents its DNA binding, thus functioning as an inhibitory regulator (12). In the absence of CHOP, the transcriptional activity of C/EBPβ is increased. C/EBPβ up-regulates PPARγ and is the likely mechanism for the increased PPARγ expression observed in our experiments (32).
Hepatomegaly in Chop−/− mice was accompanied by an increase in liver injury and inflammation, consistent with the development of steatohepatitis. Liver injury assessed by serum ALT, a marker of hepatocellular damage, was significantly elevated in the HFD-fed Chop−/− mice. Histologically, this group of mice had features of lobular inflammation and pericellular fibrosis, both characteristic features of NASH. In addition, inflammatory and fibrogenic gene expression were significantly increased in the HFD-fed Chop−/− mice. These unique findings in the liver were independent of insulin resistance, serum lipids, and circulating FFA, which were identical among the HFD-fed Chop+/+ and Chop−/− mice. The sum of these findings suggests that CHOP is a negative regulator of steatosis and inflammation in the liver.
Previous studies have demonstrated a disease-promoting role for CHOP in mouse models of type II diabetes mellitus (14, 33) and in isolated hepatocytes have shown a role for CHOP in PA-induced expression of the proapoptotic protein PUMA and delaying PA-induced cell death; however, cell death was not studied in vivo in the liver (15, 16). In contrast to our expectations, we found no decrease in hepatocyte apoptosis in vivo in HFD-fed Chop−/− mice. This occurred despite increased lipid storage in hepatocytes and adipose tissue, both of which may protect from lipotoxicity due to effective storage of excess fat. This also suggests that the UPR in steatotic hepatocytes is not of a magnitude sufficient to activate apoptosis. Under such conditions, a decrease in apoptosis would be expected in the HFD-fed Chop−/− mice.
Inflammation is a key feature of NASH. In fact, progressive fibrosis correlates with the degree of inflammation in patients with NASH, and those without inflammation do not develop progressive disease (5). Macrophages mediate liver injury. In models designed to dissect the contribution of each of these populations to injury-associated macrophages, evidence supports substantial recruitment of circulating BM-derived monocytes in liver injury states (30, 34, 35). Activated macrophages, manifest both as clusters of cells and increased numbers of macrophages, are seen in livers from NASH patients and in HFD-fed rats (29). In experimental steatohepatitis with the MCD diet, depletion of the macrophage population ameliorates liver injury and inflammation (36). In our study macrophages were significantly increased in the HFD-fed and the MCD-fed Chop−/− mice. This suggests a role for CHOP in the recruitment, activation, or persistence of activated macrophages in liver disease. It is possible that other liver and immune cell types contribute to injury and inflammation in these models, although our data support a role for macrophages.
Previous studies in atherosclerosis disease models have demonstrated that CHOP deletion decreases macrophage apoptosis both in cultured macrophages and in vivo in atherosclerotic plaques (37, 38). Furthermore, in RAW 264.7 macrophages nitric oxide (NO)-induced apoptosis is CHOP-dependent (39). In our experiments PA treatment activated RAW 264.7 macrophages and induced the UPR. We utilized PA as it is physiologically abundant and present in highest concentrations compared with other fatty acids in HFD-fed livers in this experiment. In addition to RAW 264.7 macrophages, the UPR was induced in BM-derived macrophages upon treatment with PA, and they were activated as well. Chop−/−- and Chop+/+ BM-derived macrophages were equally activated upon PA treatment. This activation was not due to lipopolysaccharide contamination of bovine serum albumin (BSA), as control cells were treated with BSA. Treatments with cholesterol and nitric oxide activate the UPR in macrophages, similar to our results with PA. Additionally, the deletion of CHOP protected macrophages from PA-induced apoptosis, suggesting that activation-induced macrophage cell death appears to be due to a sustained ER stress and that activated macrophages likely persist in Chop−/− livers, thus amplifying inflammation. Macrophage apoptosis was rarely detected in vivo yet was greatest in HFD-fed Chop+/+ livers and undetected in HFD-fed Chop−/− livers, consistent with CHOP-dependent macrophage cell death.
To further dissect the dependence of liver injury on obesity and steatosis and confirm our findings in a second model of liver injury, we utilized the MCD diet. This diet induces steatohepatitis without other features of NASH including insulin resistance. Consistent with our HFD data, MCD diet-fed Chop−/− mice developed significantly greater steatohepatitis both histologically and by ALT elevation, than wild type controls. This is consistent with a published study in which Chop−/− mice developed greater liver injury, inflammation, and steatosis upon MCD diet challenge (40). Thus, the sensitizing effects of CHOP to steatohepatitis were independent of obesity, being present both in the HFD-fed mice and the MCD diet-fed mice. Furthermore, the reduction in liver injury and inflammation in MCD diet-fed Chop−/− mice transplanted with Chop+/+ bone marrow supports a role for CHOP-induced macrophage apoptosis in vivo. Unexpectedly, liver injury and inflammation were also mitigated in reciprocally transplanted mice. This may be due to technical limitations of using bone marrow transplantation, such that chimeric mice (Chop+/+ mice reconstituted with Chop−/− bone marrow) have sufficient residual Chop+/+ function in resident macrophages. We utilized a knock-out strain; therefore, our transplants were performed with syngeneic donors. Furthermore, we used same sex donors to mitigate gender-based differences in inflammation; therefore, we are unable to assess the relative proportions of donor-derived and recipient-derived macrophages in Chop+/+ mice reconstituted with Chop−/− bone marrow. We hope to address this with future studies with tissue-specific deleted mice.
To summarize, in this study we have demonstrated a dual role for CHOP in preventing steatohepatitis. In our model, CHOP protects hepatocytes from excess storage of ectopic TG. In the absence of CHOP, hepatocytes develop exuberant steatosis likely driven by the uninhibited lipogenic action of PPARγ. In addition, in liver macrophages, CHOP mediates ER stress-induced cell death (Fig. 12). Macrophages deficient in CHOP are protected from cell death. We propose CHOP as a disease susceptibility gene in the pathogenesis of NASH, especially relevant, as it has pervasive in vivo effects. Our future studies are focused on creating tissue-specific deletion mutants to delineate the relative contribution of each of these novel roles of CHOP in preventing the onset and progression of nonalcoholic steatohepatitis. Because CHOP deletion has been shown to protect different cell types from ER stress-induced cell death (14, 33, 38, 41), there is interest in testing the potential for CHOP antagonists to ameliorate human disease. In this context, there should be caution associated with the damaging effects of CHOP deletion in the liver.
FIGURE 12.
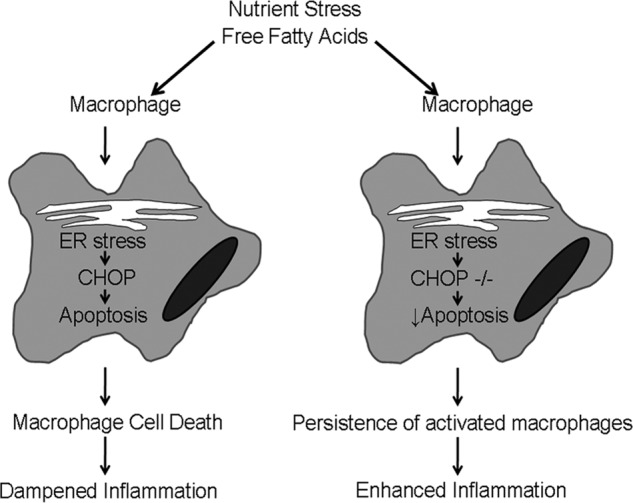
C/EBP homologous protein prevents steatohepatitis. Our model proposes that in the pathogenesis of nonalcoholic steatohepatitis nutrient stress, manifest as elevated FFA, activates macrophages in the liver. Macrophage activation results in the UPR and ER stress, presumably due to the increased secretory load of activated macrophages. CHOP is activated downstream of the UPR. Activated macrophages undergo CHOP-dependent apoptosis with the biologic consequence of dampened inflammation. However, in the absence of CHOP, activated macrophages die less and thus persist in the liver with the consequence of enhanced inflammation.
Acknowledgments
We are grateful to all members of the Kaufman laboratory for useful discussions, Dr. David Ron for sharing Chop−/− mice, and Dr. Gregory J. Gores for useful discussions and manuscript review. We also thank Courtney Hoover for superb secretarial support. The following cores were utilized: Cancer Center Research Laboratory Tissue Core and Metabolomics and Obesity Center at the University of Michigan and the Optical Microscopy Core and Histology Core Facility at the Mayo Clinic.
This work was supported, in whole or in part, by National Institutes of Health Grants K08 DK097178, DK07198, and a Pilot and Feasibility award from the Mayo Clinic Center for Cell Signaling in Gastroenterology (P30DK084567) (to H. M.) and DK042394, DK088227, DK093074, HL052173, and HL057346 (to R. J. K.).
- NASH
- nonalcoholic steatohepatitis
- ER
- endoplasmic reticulum
- UPR
- unfolded protein response
- ATF6α
- activating transcription factor α
- CHOP
- C/EBP homologous protein
- HFD
- high fat diet
- CD
- control diet
- MCD
- methionine- and choline-deficient diet
- MCS
- methionine- and choline-sufficient diet
- TG
- triglyceride
- PPARγ
- peroxisome proliferator-activated receptor gamma
- C/EBPα
- ccaat-enhancer-binding protein α
- C/EBPβ
- ccaat-enhancer-binding protein β
- ALT
- alanine transaminase
- MIP-1α
- macrophage inflammatory protein-1 α
- MCP-1
- macrophage chemoattractant protein-1
- sXBP-1
- spliced X-box-binding protein-1
- eIF2α
- eukaryotic translation initiation factor 2α
- FFA
- free fatty acid
- BMDM
- bone marrow-derived macrophages
- PA
- palmitic acid
- BM
- bone marrow.
REFERENCES
- 1. Vernon G., Baranova A., Younossi Z. M. (2011) Systematic review. The epidemiology and natural history of non-alcoholic fatty liver disease and non-alcoholic steatohepatitis in adults. Aliment. Pharmacol. Ther. 34, 274–285 [DOI] [PubMed] [Google Scholar]
- 2. Kleiner D. E., Brunt E. M., Van Natta M., Behling C., Contos M. J., Cummings O. W., Ferrell L. D., Liu Y. C., Torbenson M. S., Unalp-Arida A., Yeh M., McCullough A. J., Sanyal A. J. (2005) Design and validation of a histological scoring system for nonalcoholic fatty liver disease. Hepatology 41, 1313–1321 [DOI] [PubMed] [Google Scholar]
- 3. Cohen J. C., Horton J. D., Hobbs H. H. (2011) Human fatty liver disease. Old questions and new insights. Science 332, 1519–1523 [DOI] [PMC free article] [PubMed] [Google Scholar]
- 4. Wieckowska A., Zein N. N., Yerian L. M., Lopez A. R., McCullough A. J., Feldstein A. E. (2006) In vivo assessment of liver cell apoptosis as a novel biomarker of disease severity in nonalcoholic fatty liver disease. Hepatology 44, 27–33 [DOI] [PubMed] [Google Scholar]
- 5. Argo C. K., Northup P. G., Al-Osaimi A. M., Caldwell S. H. (2009) Systematic review of risk factors for fibrosis progression in non-alcoholic steatohepatitis. J. Hepatol. 51, 371–379 [DOI] [PubMed] [Google Scholar]
- 6. Hebbard L., George J. (2011) Animal models of nonalcoholic fatty liver disease. Nat. Rev. Gastroenterol. Hepatol. 8, 35–44 [DOI] [PubMed] [Google Scholar]
- 7. Malhi H., Gores G. J. (2008) Molecular mechanisms of lipotoxicity in nonalcoholic fatty liver disease. Semin. Liver Dis. 28, 360–369 [DOI] [PMC free article] [PubMed] [Google Scholar]
- 8. Feldstein A. E., Canbay A., Angulo P., Taniai M., Burgart L. J., Lindor K. D., Gores G. J. (2003) Hepatocyte apoptosis and fas expression are prominent features of human nonalcoholic steatohepatitis. Gastroenterology 125, 437–443 [DOI] [PubMed] [Google Scholar]
- 9. Malhi H., Kaufman R. J. (2011) Endoplasmic reticulum stress in liver disease. J. Hepatol. 54, 795–809 [DOI] [PMC free article] [PubMed] [Google Scholar]
- 10. Zinszner H., Kuroda M., Wang X., Batchvarova N., Lightfoot R. T., Remotti H., Stevens J. L., Ron D. (1998) CHOP is implicated in programmed cell death in response to impaired function of the endoplasmic reticulum. Genes Dev. 12, 982–995 [DOI] [PMC free article] [PubMed] [Google Scholar]
- 11. Fornace A. J., Jr., Nebert D. W., Hollander M. C., Luethy J. D., Papathanasiou M., Fargnoli J., Holbrook N. J. (1989) Mammalian genes coordinately regulated by growth arrest signals and DNA-damaging agents. Mol. Cell. Biol. 9, 4196–4203 [DOI] [PMC free article] [PubMed] [Google Scholar]
- 12. Ron D., Habener J. F. (1992) CHOP, a novel developmentally regulated nuclear protein that dimerizes with transcription factors C/EBP and LAP and functions as a dominant-negative inhibitor of gene transcription. Genes Dev. 6, 439–453 [DOI] [PubMed] [Google Scholar]
- 13. Ariyama Y., Shimizu H., Satoh T., Tsuchiya T., Okada S., Oyadomari S., Mori M. (2007) Chop-deficient mice showed increased adiposity but no glucose intolerance. Obesity 15, 1647–1656 [DOI] [PubMed] [Google Scholar]
- 14. Song B., Scheuner D., Ron D., Pennathur S., Kaufman R. J. (2008) Chop deletion reduces oxidative stress, improves beta cell function, and promotes cell survival in multiple mouse models of diabetes. J. Clin. Invest. 118, 3378–3389 [DOI] [PMC free article] [PubMed] [Google Scholar]
- 15. Cazanave S. C., Elmi N. A., Akazawa Y., Bronk S. F., Mott J. L., Gores G. J. (2010) CHOP and AP-1 cooperatively mediate PUMA expression during lipoapoptosis. Am. J. Physiol. Gastrointest. Liver Physiol. 299, G236–G243 [DOI] [PMC free article] [PubMed] [Google Scholar]
- 16. Pfaffenbach K. T., Gentile C. L., Nivala A. M., Wang D., Wei Y., Pagliassotti M. J. (2010) Linking endoplasmic reticulum stress to cell death in hepatocytes. Roles of C/EBP homologous protein and chemical chaperones in palmitate-mediated cell death. Am. J. Physiol. Endocrinol. Metab. 298, E1027–E1035 [DOI] [PMC free article] [PubMed] [Google Scholar]
- 17. Goodall J. C., Wu C., Zhang Y., McNeill L., Ellis L., Saudek V., Gaston J. S. (2010) Endoplasmic reticulum stress-induced transcription factor, CHOP, is crucial for dendritic cell IL-23 expression. Proc. Natl. Acad. Sci. U.S.A. 107, 17698–17703 [DOI] [PMC free article] [PubMed] [Google Scholar]
- 18. Cao S. S., Song B., Kaufman R. J. (2012) PKR protects colonic epithelium against colitis through the unfolded protein response and prosurvival signaling. Inflamm. Bowel Dis. 18, 1735–1742 [DOI] [PMC free article] [PubMed] [Google Scholar]
- 19. Junqueira L. C., Bignolas G., Brentani R. R. (1979) Picrosirius staining plus polarization microscopy, a specific method for collagen detection in tissue sections. Histochem. J. 11, 447–455 [DOI] [PubMed] [Google Scholar]
- 20. Lutfalla G., Uze G. (2006) Performing quantitative reverse-transcribed polymerase chain reaction experiments. Methods Enzymol. 410, 386–400 [DOI] [PubMed] [Google Scholar]
- 21. Back S. H., Scheuner D., Han J., Song B., Ribick M., Wang J., Gildersleeve R. D., Pennathur S., Kaufman R. J. (2009) Translation attenuation through eIF2α phosphorylation prevents oxidative stress and maintains the differentiated state in beta cells. Cell Metab. 10, 13–26 [DOI] [PMC free article] [PubMed] [Google Scholar]
- 22. Wang X., Seed B. (2003) A PCR primer bank for quantitative gene expression analysis. Nucleic Acids Res. 31, e154. [DOI] [PMC free article] [PubMed] [Google Scholar]
- 23. Spandidos A., Wang X., Wang H., Dragnev S., Thurber T., Seed B. (2008) A comprehensive collection of experimentally validated primers for polymerase chain reaction quantitation of murine transcript abundance. BMC Genomics 9, 633. [DOI] [PMC free article] [PubMed] [Google Scholar]
- 24. Malhi H., Bronk S. F., Werneburg N. W., Gores G. J. (2006) Free fatty acids induce JNK-dependent hepatocyte lipoapoptosis. J. Biol. Chem. 281, 12093–12101 [DOI] [PubMed] [Google Scholar]
- 25. Miao B., Zondlo S., Gibbs S., Cromley D., Hosagrahara V. P., Kirchgessner T. G., Billheimer J., Mukherjee R. (2004) Raising HDL cholesterol without inducing hepatic steatosis and hypertriglyceridemia by a selective LXR modulator. J. Lipid Res. 45, 1410–1417 [DOI] [PubMed] [Google Scholar]
- 26. Sherry B., Tekamp-Olson P., Gallegos C., Bauer D., Davatelis G., Wolpe S. D., Masiarz F., Coit D., Cerami A. (1988) Resolution of the two components of macrophage inflammatory protein 1 and cloning and characterization of one of those components, macrophage inflammatory protein 1β. J. Exp. Med. 168, 2251–2259 [DOI] [PMC free article] [PubMed] [Google Scholar]
- 27. Valente A. J., Rozek M. M., Sprague E. A., Schwartz C. J. (1992) Mechanisms in intimal monocyte-macrophage recruitment. A special role for monocyte chemotactic protein-1. Circulation 86, III20–25 [PubMed] [Google Scholar]
- 28. Qian B. Z., Li J., Zhang H., Kitamura T., Zhang J., Campion L. R., Kaiser E. A., Snyder L. A., Pollard J. W. (2011) CCL2 recruits inflammatory monocytes to facilitate breast-tumour metastasis. Nature 475, 222–225 [DOI] [PMC free article] [PubMed] [Google Scholar]
- 29. Fan J., Zhong L., Wang G., Wu X., Li M., Jing D., Zhang P. (2001) The role of Kupffer cells in non-alcoholic steatohepatitis of rats chronically fed with high-fat diet. Zhonghua Gan Zang Bing Za Zhi 9, 16–18 [PubMed] [Google Scholar]
- 30. Obstfeld A. E., Sugaru E., Thearle M., Francisco A. M., Gayet C., Ginsberg H. N., Ables E. V., Ferrante A. W., Jr. (2010) C-C chemokine receptor 2 (CCR2) regulates the hepatic recruitment of myeloid cells that promote obesity-induced hepatic steatosis. Diabetes 59, 916–925 [DOI] [PMC free article] [PubMed] [Google Scholar]
- 31. Han J., Murthy R., Wood B., Song B., Wang S., Sun B., Malhi H., Kaufman R. J. (2013) ER stress signalling through eIF2α and CHOP, but not IRE1α, attenuates adipogenesis in mice. Diabetologia 56, 911–924 [DOI] [PMC free article] [PubMed] [Google Scholar]
- 32. Tang Q. Q., Zhang J. W., Daniel Lane M. (2004) Sequential gene promoter interactions by C/EBPbeta, C/EBPα, and PPARgamma during adipogenesis. Biochem. Biophys. Res. Commun. 318, 213–218 [DOI] [PubMed] [Google Scholar]
- 33. Oyadomari S., Koizumi A., Takeda K., Gotoh T., Akira S., Araki E., Mori M. (2002) Targeted disruption of the Chop gene delays endoplasmic reticulum stress-mediated diabetes. J. Clin. Invest. 109, 525–532 [DOI] [PMC free article] [PubMed] [Google Scholar]
- 34. Klein I., Cornejo J. C., Polakos N. K., John B., Wuensch S. A., Topham D. J., Pierce R. H., Crispe I. N. (2007) Kupffer cell heterogeneity. Functional properties of bone marrow-derived and sessile hepatic macrophages. Blood 110, 4077–4085 [DOI] [PMC free article] [PubMed] [Google Scholar]
- 35. Duffield J. S., Forbes S. J., Constandinou C. M., Clay S., Partolina M., Vuthoori S., Wu S., Lang R., Iredale J. P. (2005) Selective depletion of macrophages reveals distinct, opposing roles during liver injury and repair. J. Clin. Invest. 115, 56–65 [DOI] [PMC free article] [PubMed] [Google Scholar]
- 36. Zhan Y. T., An W. (2010) Roles of liver innate immune cells in nonalcoholic fatty liver disease. World J. Gastroenterol. 16, 4652–4660 [DOI] [PMC free article] [PubMed] [Google Scholar]
- 37. Thorp E., Li G., Seimon T. A., Kuriakose G., Ron D., Tabas I. (2009) Reduced apoptosis and plaque necrosis in advanced atherosclerotic lesions of Apoe−/− and Ldlr−/− mice lacking CHOP. Cell Metab. 9, 474–481 [DOI] [PMC free article] [PubMed] [Google Scholar]
- 38. Feng B., Yao P. M., Li Y., Devlin C. M., Zhang D., Harding H. P., Sweeney M., Rong J. X., Kuriakose G., Fisher E. A., Marks A. R., Ron D., Tabas I. (2003) The endoplasmic reticulum is the site of cholesterol-induced cytotoxicity in macrophages. Nat. Cell Biol. 5, 781–792 [DOI] [PubMed] [Google Scholar]
- 39. Gotoh T., Oyadomari S., Mori K., Mori M. (2002) Nitric oxide-induced apoptosis in RAW 264.7 macrophages is mediated by endoplasmic reticulum stress pathway involving ATF6 and CHOP. J. Biol. Chem. 277, 12343–12350 [DOI] [PubMed] [Google Scholar]
- 40. Soon R. K., Jr., Yan J. S., Grenert J. P., Maher J. J. (2010) Stress signaling in the methionine-choline-deficient model of murine fatty liver disease. Gastroenterology 139, 1730–1739 [DOI] [PMC free article] [PubMed] [Google Scholar]
- 41. Malhotra J. D., Miao H., Zhang K., Wolfson A., Pennathur S., Pipe S. W., Kaufman R. J. (2008) Antioxidants reduce endoplasmic reticulum stress and improve protein secretion. Proc. Natl. Acad. Sci. U.S.A. 105, 18525–18530 [DOI] [PMC free article] [PubMed] [Google Scholar]


