Background: Histone H3 clipping has been reported in chicken liver tissues and not in brain.
Results: Glutamate dehydrogenase (GDH) is a histone H3-specific protease that clips free and chromatin-bound histone H3.
Conclusion: GDH has the potential to act as a chromatin modifier and thereby regulates chromatin metabolism.
Significance: GDH has been for the first time implicated in an epigenetic process.
Keywords: Chromatin, Chromatin Histone Modification, Cysteine Protease, Glutamate Dehydrogenase, Histone Modification, CLH3p, H3 Protease, Soluble Chromatin
Abstract
Clipping of histone tails has been reported in several organisms. However, the significance and regulation of histone tail clipping largely remains unclear. According to recent discoveries H3 clipping has been found to be involved in regulation of gene expression and chromatin dynamics. Earlier we had provided evidence of tissue-specific proteolytic processing of histone H3 in White Leghorn chicken liver nuclei. In this study we identify a novel activity of glutamate dehydrogenase (GDH) as a histone H3-specific protease in chicken liver tissue. This protease activity is regulated by divalent ions and thiol-disulfide conversion in vitro. GDH specifically clips H3 in its free as well as chromatin-bound form. Furthermore, we have found an inhibitor that inhibits the H3-clipping activity of GDH. Like previously reported proteases, GDH too may have the potential to regulate/modulate post-translational modifications of histone H3 by removing the N-terminal residues of the histone. In short, our findings identify an unexpected proteolytic activity of GDH specific to histone H3 that is regulated by redox state, ionic concentrations, and a cellular inhibitor in vitro.
Introduction
In eukaryotes, DNA is tightly wrapped around highly basic and evolutionarily conserved histone proteins in the form of chromatin (1). The fundamental subunit of chromatin is the nucleosome that consists of 146 base pairs of DNA and an octamer of histone proteins containing two molecules of each, H2A, H2B, H3, and H4. The main functions of chromatin are to package the several billions of base pairs of DNA, prevent DNA damage, and regulate replication and transcription. Nucleosomes are highly dynamic structurally and functionally (2, 3). The structure of the nucleosome can be remodeled in various ways, including replacement of canonical histones with specialized histone variants, post-translational modification of histones, sliding of the nucleosome particle, and partial or complete removal of histones from the DNA (4–6). The regulation of chromatin structure is controlled by the dynamic interplay between sequence-specific DNA-binding proteins, histone variants, histone-modifying enzymes, chromatin-associated proteins, histone chaperones, ATP-dependent nucleosome remodelers, proteolytic clipping of histone tails, etc. The role of chemical and physical changes in the chromatin has been well established (7–11); very little is known about how proteolytic clipping of histone tails regulates gene expression.
H2A-specific protease activity has been reported to produce a pentadecapeptide from the C terminus of H2A by cutting between Val-114 and Leu-115. The resulting H2A-H2B dimer has been demonstrated to have a reduced affinity for the H3-H4 tetramer, which thereby destabilizes the structure of nucleosome (12–14). Based on in vitro biochemical experiments, it is speculated that this function may facilitate transcription or replication. In Chlamydia trachomatis, chromatin decondensation, which occurs during the early life cycle, has been correlated with C-terminal proteolysis of the histone H1-like Hc1 protein by the EUO gene-encoded protease (15). In Tetrahymena, transcriptionally inactive micronuclei and transcriptionally active macronuclei were found to be different in terms of histone composition. Macronuclear linker histone H1 and histone H3 were found to be proteolytically cleaved, a process that has been described as a physiologically and developmentally regulated event (16–18). Nucleotide-stimulated proteolysis of H1 has been found in human lymphocytes (19). Also, 21 amino acid residues from the N-terminal tail of histone H4 seem to be proteolytically removed from the macronuclear genome during conjugation in Tetrahymena. Disappearance of histone H3 has also been observed in foot mouth disease virus-infected cells (20–22). Recently, cathepsin L has been shown to cleave the N terminus of histone H3, an event that is required for stem cell differentiation in mammals (23). In yeast, an unidentified serine protease has been found to cleave histone H3 and regulate the expression of stationary and sporulation-specific genes (24). A cysteine protease activity in chicken liver, specific for histone H3 (CLH3p), has been reported by us (25).
It is well documented that the enzyme glutamate dehydrogenase is localized in the nucleus in addition to mitochondrial matrix and endoplasmic reticulum (ER).2 However, the role of glutamate dehydrogenase (GDH) in the nucleus has not been elucidated yet. Here, in vitro biochemical studies show that CLH3p is in fact GDH, which has H3 protease activity. Mass spectrometric analysis of the CLH3p band purified in our previous study (25) revealed the protease to be GDH, but we were initially inclined to disregard it as a possible artifact. However, just for confirmation, we purified GDH from rough endoplasmic reticulum (RER) where its presence is already reported (26). Surprisingly, we found GDH to possess the H3 tail-clipping activity. We also show that this activity of GDH can be affected by alteration in redox state (through thiol-disulfide conversion) and the concentration of metal ions in vitro besides other factors such as pH, temperature, and salt concentration. GDH was found to interact with the core histone tails but clip only histone H3 in its free and chromatin-bound form. Furthermore, we detected the presence of a physiological inhibitor of the protease activity possessed by GDH. Thus, we have identified a novel H3-clipping activity of GDH purified from RER that may regulate gene expression by modulating chromatin structure and function.
EXPERIMENTAL PROCEDURES
Purification of H3-specific Protease from the Microsomes
Liver, brain, and blood from freshly sacrificed adult White Leghorn chicken were used in this study. Chicken tissues from sacrificed chickens were transported on ice from the slaughter house under approval from the Institutional Biosafety Committee. The animals were not sacrificed by the authors of this study. Microsomal extracts were prepared as described earlier (27). Liver tissue was homogenized in solution (0.34 m sucrose, 15 mm Tris-Cl, pH 7.5, 15 mm NaCl, 60 mm KCl, 0.5 mm spermidine, 0.15 mm spermine, 0.2 mm EDTA, 0.5 mm EGTA, 15 mm β-ME, 0.2 mm PMSF) to make 10% homogenate followed by centrifugation at 5000 × g and 27,000 × g to pellet the nuclei and mitochondria, respectively. Microsomal fraction was collected by centrifugation at 105,000 × g and extracted with 0.2% Triton X-100 followed by precipitation with 30% ammonium sulfate. Desalted extract was heat-treated (50 °C for 1 h). Clear supernatant was applied on HiTrap DEAE-Sepharose (GE Healthcare) and eluted with linear (50–250 mm) NaCl gradient in 25 mm Tris-Cl, pH 7.5, buffer containing 0.2 mm EDTA, 1 mm β-ME, and 10% glycerol. Protein fractions eluted between 60 and 250 mm NaCl were collected and applied on HiTrap Heparin HP column (GE Healthcare) and eluted with linear 50–500 mm NaCl gradient in buffer (25 mm Tris-Cl, pH 7.0, buffer containing 0.2 mm EDTA, 1 mm β-ME, and 10% glycerol). Protein fractions eluted between 330 and 450 mm NaCl gradient were collected and further purified by hydroxyapatite chromatography and eluted with a linear (20–50 mm) sodium phosphate, pH 7.2, gradient. The eluted proteins were precipitated with 40% ammonium sulfate and then further purified through size-exclusion chromatography (Biosuite 125 column, Waters) with 20 mm sodium phosphate, pH 7.2, buffer containing 100 mm NaCl at a flow rate of 0.55 ml/min. Purification of the protease (H3-clipping activity) was monitored at every step by in vitro protease assay. For quantification purposes, the amount of pure GDH that cleaves 50% of the total intact H3 in an assay in 15 min at 37 °C was arbitrarily set as 1 unit. The total amount of proteins in fractions obtained after each step was determined by the Bradford protein assay. Total activity was calculated as the activity (units) measured in the volume of fraction used for the assay multiplied by the fraction total volume. Specific activity of the protease was determined as the ratio of total activity to total amount of proteins after each step of purification. Yield was calculated by determining the activity retained after each step as a percentage of the activity in microsomal extract. The amount of activity in the microsomal extract was taken to be 100%. The ratio of specific activity of a fraction after any step to that of the microsomal fraction gave the purification fold obtained. We attempted to determine the in vivo protease expression profile in other tissues (brain, kidney, heart, erythrocyte, heart, and muscle) by preparing whole cell extracts and subjecting the extracts to immunoblot analysis. Protease from chicken brain and rat liver tissues was partially purified following the same protocol used for the preparation of histone H3-specific protease from chicken liver tissue up to the microsomal extract preparation step after which the extract was subjected to Superose 6 column chromatography using dialysis buffer (25 mm Tris-Cl, pH 7.5, 100 mm NaCl, 1 mm β-ME, 0.2 mm EDTA, 10% glycerol).
Identification of Proteins by Mass Spectrometry
In the active fractions from the Biosuite 125 column, a protein band that correlated with H3-clipping activity was identified by mass spectrometry (28). An ∼55-kDa protein band was excised from SDS-PAGE gel and subjected to in-gel digestion. The dried peptides were subjected to standard nano-RP-LC. Peptides were identified by LTQ-Orbitrap MS/MS analysis on MASCOT using Proteome Discoverer 1.3 software having Swiss-Prot as database. The protein that correlated with H3-clipping activity was identified as glutamate dehydrogenase.
Immunoprecipitation
Active fractions after HiTrap DEAE-Sepharose column were pooled and used as input for immunoprecipitation. GLUD1 antibody (anti-GDH) (Sigma, SAB2100932-50UG) and protein G-Sepharose were used for pulling down the antigen-antibody complex. Protein G-Sepharose beads alone were taken as negative control. Histone H3 protease activity and the presence of GDH were determined in immunoprecipitation fractions.
Preparation of ER Proteins
Proteins from chicken liver ER were prepared according to the procedure described previously (26).
Preparation of Histones from Chicken Brain
Nuclei were purified by centrifugation. Nuclei were then washed with 0.5 m NaCl. Histones were extracted from purified nuclei by 0.4 n H2SO4 or purified by chromatography over a hydroxyapatite column at 2.5 m NaCl as described earlier (25).
Preparation of Recombinant GDH
Competent Escherichia coli BL21 (DE3) was transformed with mouse GLUD1 ORF clone (with N-His tag) carrying bacterial expression vector pReceiver-B01 (Creative Biogene), and the transformants were plated on antibiotic containing LB-agar medium. The transformed cells were then grown until A600 reached 0.6, after which 0.5 mm IPTG was added to the culture, and the cells were allowed to grow at 37 °C for 3 h. The cells were harvested and lysed by sonication in lysis buffer (20 mm sodium phosphate buffer, pH 7.4, 500 mm NaCl, 10 mm β-ME, 1 mm EDTA, protease inhibitor mixture (PIC), and PMSF) containing 2% Triton X-100, and proteins were extracted from inclusion bodies using 7 m urea. Soluble proteins were dialyzed against dialysis buffer (25 mm Tris-Cl, pH 7.5, 200 mm NaCl, 0.2 mm EDTA, 10 mm β-ME, 10% glycerol). For further purification, nickel nitrilotriacetic acid column chromatography was used. As a negative control, uninduced cells were subjected to the same purification procedure, and the activity of the resultant fraction (mock GDH) was determined via an assay. The recombinant GDH (rGDH) prepared above was separated on a Sephacryl S-200 size-exclusion column, and the elution profile was compared with that of chicken liver GDH separated on the same column. Fractions were resolved on 10% SDS-PAGE.
In Vitro Characterization of Protease Activity of GDH
To examine the H3-clipping activity, an in vitro assay was developed as described earlier (25). In brief, core histones were incubated with microsomal/ER extracts or fractions from purification steps for about 1–2 h at 37 °C in a buffer (10 mm HEPES, pH 5.5, 100 mm NaCl, 0.2 mm EDTA, 1 mm β-ME, 10% glycerol). Reaction was stopped by boiling the whole reaction content in SDS-PAGE loading dye followed by 15% SDS-PAGE. H3-clipping activity was correlated with disappearance of H3 band in SDS-PAGE gel. Effect of temperature on the H3-clipping activity was tested by preincubating purified protease at different temperatures (40, 50, 60, 70, and 80 °C) for 2 h and then mixing with core histones. Finally, the protease-histone mixtures too were incubated at the mentioned temperatures for 2 h. To find out the optimum pH for protease activity, histone and protease were incubated at different pH (pH 7.5, 5.5, and 8.8). Optimum salt concentrations for protease assay were also tested by incubating histone and protease mixtures in the presence of increasing concentrations (0.15, 0.2, 0.4, 0.6, 0.8, 1.0, 1.2 m) of NaCl. The effect of ions on protease activity was examined by an in vitro assay as described above in the presence of increasing concentrations of ions. The various ions used are: Mg2+ (magnesium chloride: 1, 2, 4, and 5 mm), Ca2+ (calcium chloride: 1, 2, 4, and 5 mm), Zn2+ (zinc chloride: 0.1, 0.25, 0.35, and 0.5 mm), Cd2+ (cadmium sulfate, 0.1, 0.5, and 1 mm), Cu2+ (copper sulfate, 0.01, 0.05, and 0.1 mm), and Ni2+ (nickel sulfate, 0.1, 0.25, and 0.5 mm). Protease activity in the presence of divalent cations was also tested in presence of EDTA. To further characterize the protease activity, assays were performed in the presence of various concentrations of β-mercaptoethanol (1, 2, 5, 10, and 20 mm), which is a disulfide bond (-S-S-) reducing agent, diamide (50, 75, 100, 250, and 500 μm), which oxidizes the sulfhydryl (-SH) group, and both (0.1, 0.2, 0.4, 0.5, and 1 mm β-mercaptoethanol and constant 500 μm diamide concentration). The substrate specificity of the protease was tested through in vitro assays performed with individual recombinant histones (H3, H2B, H2A, H4) gifted by Professor Karolin Luger at Colorado State University. In vivo hexameric GDH from liver microsomal extract separated on Superose 6 chromatography was treated with 20 mm β-mercaptoethanol containing dialysis buffer for 5 h before using in protease assay.
Histone-GDH Interactions
A biotin peptide pulldown assay was performed to determine the interaction of GDH with synthetic peptides: H3 (1–23)-Biotin, H3 (25–37)-Biotin, H4 (1–23)-Biotin (Biopeptide Co.), and H3 (13–37)-Biotin (from BioConcept Labs Pvt. Ltd.). The peptide-bound resin (Avidin-agarose, Pierce) was prepared as described (29). The avidin-bound peptides were resuspended in 400 μl of PBS to prepare 50% slurry. 100 μl of this slurry was used for each pulldown assay wherein peptide beads were equilibrated with binding buffer (10 mm HEPES, pH 5.5, 100 mm NaCl, 1 mm β-ME, 0.2 mm EDTA, and 10% glycerol). Avidin beads without peptide were taken as the negative control. Precleared liver endoplasmic reticulum protease extract (active fractions from gel filtration) was added to peptide-bound as well as control beads and incubated with rotation at 4 °C for 1 h. Beads were spun at low speed, and flow-through was collected. Beads were washed 10 times with binding buffer, and bound fraction was eluted with (10 mm HEPES, pH 5.5, 200/300/500 mm NaCl, 1 mm β-ME, 0.2 mm EDTA, and 10% glycerol). Input (liver endoplasmic reticulum), flow-through, washes, and elutions were tested for H3-clipping activity and the presence of GDH by immunoblotting.
Expression and Purification of GST-fused Histone Tails
Constructs for expression and purification of histone tails were gifted by the Roeder Laboratory (The Rockefeller University). The N-terminal tail sequences of histones corresponded to residues 1–38 for H2A, 1–33 for H2B, 1–41 for H3, and 1–36 for H4. The purification of the GST-tagged tails of core histones was carried out as described earlier (30). The constructs were transformed in BL21 (DE3) pRARE strain. Cultures were induced with 1 mm isopropyl 1-thio-β-d-galactopyranoside for 3 h. Whole cell lysates were prepared from 1 liter of culture by sonication and then incubated with 0.4 ml of glutathione-Sepharose 4B beads (Amersham Biosciences) in buffer (20 mm Tris-Cl, pH 7.5, 250 mm NaCl, 2 mm EDTA, 2 mm EGTA, 1% Triton X-100) for 2 h at 4 °C. The protein-bound resins were washed with wash buffer (20 mm Tris-Cl, pH 7.5, 250 mm NaCl, 2 mm EDTA, and 2 mm EGTA). Elution was performed 10 times using 1 ml of wash buffer, pH 8.0, containing 20 mm glutathione. The elutions were concentrated and dialyzed against buffer (25 mm Tris-Cl, pH 7.5, 100 mm NaCl, 0.2 mm EDTA, 1 mm β-ME, and 10% glycerol).
Histone Protease Interactions by Surface Plasmon Resonance (SPR)
All experiments were carried out using Biacore T200 SPR sensor (Biacore) with Biacore T200 Evaluation Software 1.0 and sensor chip CM5 (carboxymethylated dextran surface). All assays were carried out at 25 °C. Purified GDH was immobilized (6002 relative units) via amine coupling in the experimental flow cell. Purified recombinant core histones in protease assay buffer were individually injected as analyte on the reference and experimental flow cell at a flow rate of 20 μl/min. The flow cell system was then regenerated with 10 mm glycine, pH 2.5.
Histone H3-clipping Site Identification Edman Degradation
Pure recombinant histone H3 was subjected to digestion by the protease, and the digest was resolved by 18% SDS-PAGE. The histone H3 sub-bands were excised and sequenced by the Edman Degradation method.
Western Blotting
The following primary antibodies were used for Western blotting: General H3 (1:3000) (Abcam, 1791), TBP (1:1000), GAPDH (1:3000) (Abcam, 37168), Lamin A (1:1000) (Abcam, 26300), PDIA4 (1:1000) (Sigma, SAB2103112–50UG), tubulin (1:500) (Sigma, T3526), and GLUD1 (anti-GDH) (1:500) (Sigma, SAB2100932-50UG). Secondary antibodies were IR dye-labeled, purchased from LI-COR. Signals were detected using a LI-COR automated infrared imaging system.
Preparation of Soluble Chromatin from Chicken Brain
Soluble chromatin was prepared from chicken brain tissue. 10% tissue homogenate was prepared as mentioned earlier. Nuclei were isolated, washed 4 times with HB buffer (20 mm HEPES, pH 7.5, 0.4 m NaCl, 1 mm β-mercaptoethanol, 10% glycerol, 0.1% Nonidet P-40, 1 mm EDTA, and PIC with hand homogenization after every wash. Chromatin was further washed twice with 0.4 m NaCl containing HAP buffer (50 mm phosphate buffer, pH 6.8, 1 mm β-mercaptoethanol, and PIC) with homogenization. The chromatin thus prepared was resuspended and sonicated in 0.1 m NaCl containing HAP buffer (lacking the PIC). The sonicated chromatin was centrifuged to yield soluble chromatin as supernatant. Free DNA was prepared from chromatin by phenol-chloroform-isoamyl alcohol method.
Preparation of Histone H3-specific Protease Inhibitor
Microsomal extract was prepared from chicken brain tissue following the protocol for preparation of microsomes from liver tissue. This extract was subjected to Superose 6 size exclusion chromatography. The inhibitor-containing fractions were pooled and resolved by high resolution size exclusion chromatography (Biosuite 125 HPLC column).
Image Acquisition, Processing, and Quantification
Ethidium bromide-stained gels were visualized and photographed using the Fujifilm LAS-4000 mini gel doc system. The image processing software Multi Gauge provided with the gel-doc was used for processing. For imaging Coomassie and silver-stained gels, the HP Scanjet G2410 scanner was used. Li-Cor images were processed with the Odyssey software package. The Microsoft Office Picture Manager was used for the cropping and minor processing of the gel pictures. Quantification of protein band intensities was done using the ImageJ software.
RESULTS
Purification of a Histone H3-specific Protease Activity from Microsomes of Chicken Liver
Histone H3-clipping activity has been reported earlier in several organisms such as chicken, mammals, yeast, and Tetrahymena. However, biochemical characterization as well as physiological significance of H3-clipping proteases is not clear. To study subcellular distribution and for further characterization of the chicken liver H3-specific protease activity, we decided to make the extracts from nuclei and a cytosolic preparation, microsomes, which include ER and Golgi complexes and are closely associated with nuclei. Because the preparation of nuclei by the ultracentrifugation method yields only a very small amount of pure nuclei, we found it more feasible to purify the protease from the microsomes, which could be prepared in larger amounts from the same amount of tissue. Purity of the extracts was verified by Western blotting using antibodies specific to ER and nuclear proteins (Fig. 1, A–C). We then, as shown in schematic (Fig. 1, A and B), employed various protein purification procedures to purify the H3-specific protease activity from the microsomes. Progress of the purification from all the steps was monitored by an in vitro protease assay, as described under “Experimental Procedures.” In our entire study clipping activity has been correlated with the degradation of histone H3 upon incubation of core histones with the microsomal extracts or fractions from purification steps. We assayed the activity of the protease by incubating it with brain core histones for different time points and quantified the activity in terms of the amount of intact H3 present (Fig. 1, D and E).
FIGURE 1.
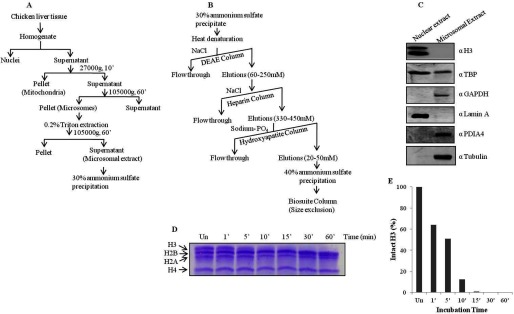
Scheme to purify H3-clipping activity from microsomes. A, shown is a schematic of the preparation of microsomal extract from chicken liver tissue. B, shown is a scheme for the purification of H3-clipping protease from microsomal extract. C, Western blot analysis determined the purity of the microsomal extract prepared. Antibodies used for the Western blot are indicated on the right of the respective figure panels. D and E, shown is a time point assay of protease activity purified according to the above scheme and its quantification.
Identification of the Histone H3 Protease
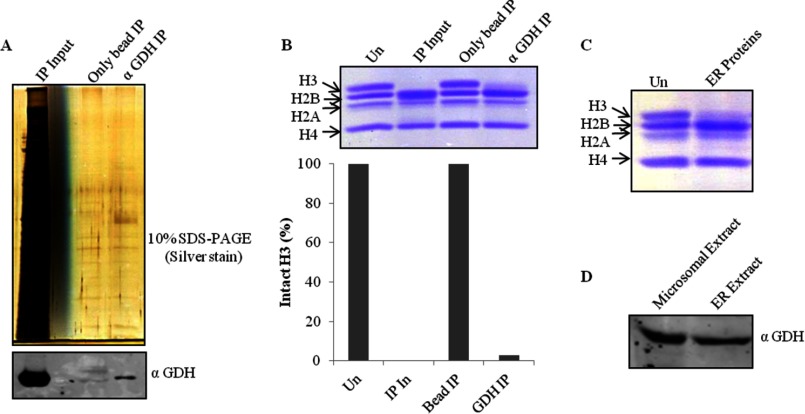
After the final step of purification i.e. size exclusion chromatography (Biosuite 125) (Fig. 2A), the protein band (Fig. 2B, upper panel), which was congruent with H3-clipping activity (Fig. 2C), was analyzed by mass spectrometry (supplemental Table S1). Based on the mass analysis, the protein band was identified as GDH (Fig. 2D). The presence of GDH in active fractions was verified by Western blotting (Fig. 2B, lower panel). The purification profile was monitored in terms of specific activity (1 unit of enzyme was arbitrarily defined as the amount of enzyme required to cleave 50% of intact histone H3 in 15 min at 37 °C) of GDH and its enrichment after every purification step (Fig. 3, A and B). Further evidence for the protease activity of GDH was provided by conducting immunoprecipitation using GDH antibody (Fig. 4A, upper panel) and confirming the presence of GDH in the immunoprecipitate by immunoblotting (Fig. 4A, lower panel). The protease activity of the immunoprecipitated GDH was assayed and quantified (Fig. 4B). To enable comment on the cellular localization of the protease, we tried a biochemical approach. As it is already known that GDH is present in RER (26), we modified our procedure to prepare pure RER and exclude Golgi bodies from the microsomal fraction. The RER protein fraction showed protease activity (Fig. 4C). Immunoblot analysis of the fraction confirmed the presence of GDH in the active fraction (Fig. 4D).
FIGURE 2.
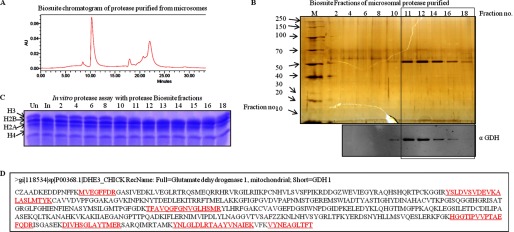
Purification of H3 protease activity from chicken liver microsomes. A, shown is biosuite 125 size-exclusion column chromatography of purified protease (Fig. 1B). B, fractions from Biosuite 125 size-exclusion column (final step in the purification protocol) were analyzed on 10% SDS-PAGE (upper panel). M stands for protein marker/ladder. Numbers on the top of the gel picture denote fraction numbers. Western analysis of the same fractions was performed using anti-GDH (anti-GLUD1) antibody to determine the presence of GDH (lower panel). C, the histone-clipping assay using the Biosuite 125 column fractions (numbers on top of the lanes) show the activity of the protease. Un, undigested brain core histones for control. In, input The contents of H3-clipping assay were resolved by 15% SDS-PAGE. D, shown is mass-spectrometric identification of the protease band purified after the Biosuite 125 column. The sequence is chicken GDH. The sequences in red underlined font are the sequences of the peptides detected and are identified by mass spectrometry.
FIGURE 3.
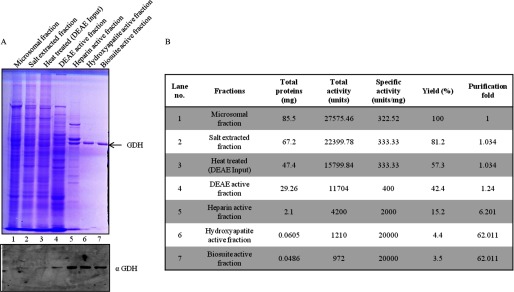
Purification profile of GDH. A, shown is purification of GDH (Fig. 1B). The active fractions after each step of purification were loaded on 10% SDS-polyacrylamide gel (upper panel) to analyze the purification profile of GDH. These fractions were also probed by immunoblotting using anti-GDH (anti-GLUD1) antibody to confirm the purification of GDH (lower panel). B, a purification table of GDH is shown.
FIGURE 4.
Immunoprecipitation of GDH. A, immunoprecipitation (IP) fractions eluted from anti-GDH antibody beads or unmodified beads as control were resolved and visualized on 10% silver-stained SDS-PAGE (upper panel). Western blot analysis of the fractions for the detection of GDH was conducted using anti-GDH (anti-GLUD1) antibody (lower panel). B, shown is a H3 protease activity assay with immunoprecipitation fractions and quantification of the activity. In, input. C, shown is thr presence of protease activity in the ER. A small volume from the fractions containing ER proteins was incubated with brain core histones that were then resolved by 15% SDS-PAGE. Un, undigested core histones. D, shown is an immunoblot analysis of microsomal and ER extract using anti-GDH antibody.
Mammalian GDH Purified from Rat Liver Shows Histone H3-clipping Activity
To determine if GDH from mammals also possesses the histone H3-clipping activity, we chose rat as a suitable model. Microsomal extract prepared from rat liver tissue was used for a time point protease assay (Fig. 5, A and B), which proved the presence of protease activity in the mammalian system also. The protease activity was partially purified from the microsomal extract by size exclusion chromatography. The presence of GDH in the active fractions (Fig. 5, C and D) was confirmed.
FIGURE 5.
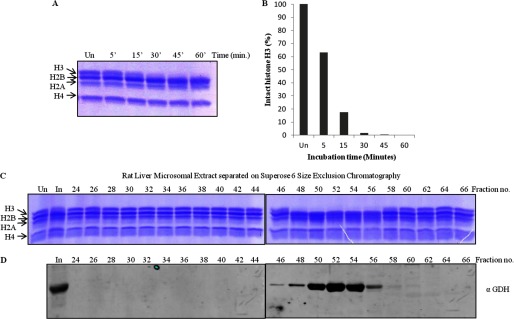
Rat liver GDH has histone H3-clipping activity. A, shown is a time point assay with microsomal extract from rat liver. The extract prepared from the liver tissue was incubated with core histones at 37 °C for different durations (minutes of incubation are shown on the top of the gel). Un, undigested, denoting undigested core histones. The reaction mixtures were resolved on 15% SDS-polyacrylamide gel. B, shown is quantification of protease activity from rat liver. The protease activity of rat liver microsomal extract was quantified in terms of the amount of intact H3 present after the assay in A. C and D, shown is coelution of protease activity and GDH. Partial purification of protease activity of GDH from the rat liver microsomal extract was performed. The microsomal extract from rat liver tissue was subjected to size exclusion chromatography on a Superose 6 column. The chromatography fractions were assayed for the presence of the histone H3-specific tail-clipping activity (C) and GDH by immunoblotting using anti-GDH (anti-GLUD1) antibody (D). In, input.
Recombinant GDH Shows Histone H3-clipping Activity
Because we had already confirmed the protease activity of mammalian GDH, we expressed and purified recombinant (His-tagged) mouse GDH from E. coli (Fig. 6, A and B). The protease activity of recombinant GDH was determined by a time point assay, quantified, and compared with mock GDH (Fig. 6, C and D). The results revealed that the recombinant GDH had very low specific activity of 34.78 units/mg of protein. Because the protease activity was low, we subjected the purified rGDH to size-exclusion chromatography (Fig. 6E, upper panel). The elution profile was compared with that of GDH purified from chicken liver (Fig. 6E, lower panel). We observed that rGDH did not show the typical elution profile expected for monomeric active GDH. To further confirm that the protease activity was shown by GDH (and not by any contaminating protein), we performed a protease assay with GDH purified from rat, chicken (Fig. 6F, left panel), and with the recombinant GDH (Fig. 6F, right panel) in the absence and presence of increasing concentrations of E-64, a specific cysteine protease inhibitor. We observed and quantified (Fig. 6G) the gradual inhibition of protease activity of GDH in presence of E-64.
FIGURE 6.
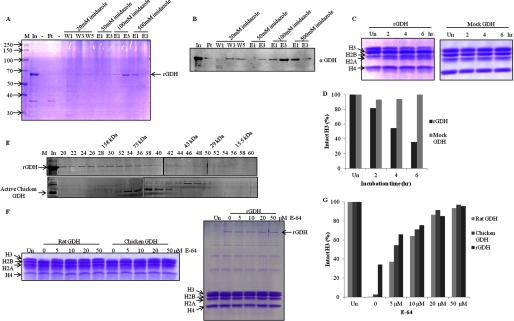
Recombinant mouse GDH shows histone H3-specific protease activity. A, shown is purification of recombinant mouse GDH. The His-tagged mouse GDH was purified from inclusion bodies by urea extraction followed by nickel nitrilotriacetic acid affinity column. M, protein molecular weight marker; In, urea-extracted proteins from inclusion bodies; Ft, flow-through; W1, W2, and W3, first, third, and fifth washes; E1 and E3, first and third elutions at the mentioned imidazole concentrations. The band corresponding to recombinant GDH is marked as rGDH. B, the presence of mouse rGDH through its purification profile was detected by immunoblotting using anti-GDH (anti-GLUD1) antibody of the fractions in A. C, shown is a time point assay of protease activity of rGDH (left panel) and mock GDH (right panel). Un, undigested. D, shown is quantification of protease activity of rGDH compared with mock GDH. E, shown is a comparison of gel filtration profiles of rGDH (upper panel) and chicken liver GDH (lower panel) on Sephacryl S-200 size-exclusion chromatography column. Fractions (numbers on top of the gel) were resolved on 10% SDS-PAGE. M, marker; In, input. Elution positions of molecular weight standards are shown on top. F, shown is an inhibition assay with E-64. The protease activity of GDH purified from rat and chicken liver microsomes was shown to be inhibited by increasing concentrations of E-64 (0, 5, 10, 20, 50 μm) (left panel). E-64 also inhibited protease activity of recombinant mouse GDH (right panel). G, shown is quantification of the protease activity of GDH in the presence of the inhibitor.
Activity of GDH Is Regulated by Temperature, Salt Concentration, pH, Ions, and Thiol-disulfide Conversion in Vitro
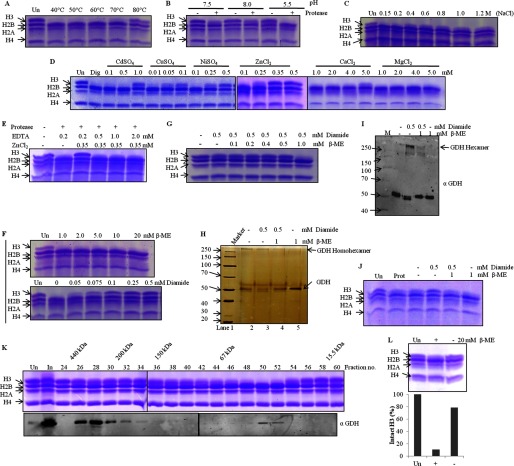
Proteases are characterized by their biochemical properties, like optimum pH, temperature, molecular weight, effect of ions, and critical amino acid(s) required for the catalytic activity. Therefore, to study the structure-function relationship of GDH and identify the optimum conditions for the activity, we performed protease assays at increasing temperatures, different pH values, varying concentrations of various divalent ions, and in the presence of reducing and oxidizing agents. First, we performed a temperature-dependent assay (Fig. 7A) and found the protease activity of GDH to be quite stable up to 60 °C. Decline in the activity beyond 60 °C is due to thermal denaturation. Also we found that it shows maximum activity at pH 5.5 (Fig. 7B). Inhibition of the protease activity above 0.2 m sodium chloride (Fig. 7C) suggests that protease functions at physiological salt concentrations. Because the protease is a cysteine protease, as demonstrated in our previous study (25), to find out the effect of ions on this activity of GDH we performed in vitro protease assays in presence of various ions such as Ca2+, Mg2+, Ni2+, Zn2+, Cd2+, and Cu2+ (Fig. 7D). The metal ions like Ni2+, Zn2+, Cd2+, and Cu2+ showed inhibitory effect on the clipping activity of GDH, whereas Ca2+ and Mg2+ ions did not show any significant inhibition. This specific inhibition by certain divalent metal ions concurs with the fact that GDH has cysteine residues essential for the protease activity (31). The inhibitory effect of metal ions was found to be suppressed in the presence of EDTA, which chelates the ions, indicating that binding of metal ions is reversible (Fig. 7E). Inhibition of the protease activity by metal ions reveals that protease activity of GDH may be regulated by cellular ionic concentrations. The requirement of cysteine thiol group for the activity of GDH was further confirmed by in vitro protease assays in the presence of β-ME, a disulfide reducing agent, or diamide, an oxidizing agent. Although β-ME did not exert any inhibitory effect, we found complete inhibition of the protease activity in the presence of diamide, suggesting that GDH shows activity only in reducing conditions (Fig. 7F). This inhibitory effect of diamide was reversed by β-mercaptoethanol, which further suggests that thiol-disulfide conversion regulates the activity of the protease (Fig. 7G). Furthermore, we found an interesting correlation between H3-clipping activity of GDH and its altered mobility in non-reducing SDS-PAGE after treatments with diamide or β-mercaptoethanol or both (Fig. 7H). To confirm the result, we performed immunoblot analysis of the same with anti-GDH antibody (Fig. 7I). We found that only monomeric GDH profile correlated with the maximum H3-clipping activity (Fig. 7J). Hexameric form of GDH is already known to be present in vivo. To show that the protease activity of GDH correlated with the in vivo presence of monomeric GDH and not hexameric GDH, we first resolved the microsomal extract on a size exclusion column, tracked the protease activity via assays performed with the fractions of the chromatography (Fig. 7K, upper panel), and finally determined the presence of GDH monomer and hexamer in the fraction via immunoblotting (Fig. 7K, lower panel). We saw that the in vitro activity profile coincided with that of in vivo monomeric GDH, whereas hexameric GDH did not show any significant protease activity. However, upon incubation of hexameric GDH with 20 mm β-mercaptoethanol for 5 h, protease activity was observed (Fig. 7L).
FIGURE 7.
Activity of GDH is regulated by divalent ions, temperature, pH, salt, and thiol-disulfide conversion. Lanes marked Un have undigested histones as references, and M stands for protein marker/ladder. Dig, digestion of H3 upon incubation of core histones with the protease under optimal in vitro assay conditions. A–J, GDH activity on brain core histones was assayed after GDH preincubation for 2 h at various temperatures (A), with buffers at various pH values (B) or supplemented with NaCl (C), divalent cation salts (D), ZnCl2 in the presence of EDTA (E), β-mercaptoethanol (F, top panel), diamide (F, bottom panel), or β-mercaptoethanol with diamide (G). The effect of diamide and/or β-mercaptoethanol on GDH was analyzed after a 1-h treatment by silver-stained SDS-PAGE (H), by Western blotting with anti-GDH antibody (I), with molecular weight markers, and by determining H3-clipping activity (J). K, shown is the presence of monomeric as well as hexameric GDH in vivo. Chicken liver microsomal extract was separated on Superose 6 column, and the fractions were used for protease assay (upper panel). Elution position of molecular mass standards are shown on top of the gel. The protease activity elution coincided with that of monomeric GDH (and not hexameric GDH) in immunoblot analysis using anti-GDH (anti-GLUD1) antibody (lower panel). L, in vivo inactive hexameric GDH shows clipping activity (upper panel) after incubation with β-mercaptoethanol. The H3-clipping activity of hexameric GDH (with or without incubation with β-mercaptoethanol) was quantified (lower panel).
GDH Interacts with Tails of Core Histones but Clips Only Histone H3
To examine the binding of GDH with the core histone tails, we employed two methods; peptide pulldown assays with biotin-fused histone H3 and H4 tail peptides and in vitro clipping assays in the presence of increasing amounts of GST-histone tails. We found GDH to interact with H3 (1–23), H3 (13–37), and H4 (1–23) peptides but not with H3 (25–37) peptide (Fig. 8, A, B, and D). In these assays we observed that GDH eluted at lower salt concentration (200 mm NaCl) from H3 (13–37) peptide as compared with the salt concentration (300 mm NaCl) required to elute GDH from H4 (1–23) peptide. Elutions from H3 (13–37) and from only avidin beads were assayed for the presence of GDH by immunoblotting (Fig. 8C). These results suggest that GDH interacts with H3 N-terminal tail but not with the region beyond the proposed cleavage site (between residues 23 and 27) (see below) (25). Binding of GDH with the core histones was further analyzed by adding purified GST-histone tails in the protease reaction containing core histones and protease. We purified the GST fusion of all the core histone tails to study the interaction between GDH and core histones. We found that GST-tails of all core histones inhibited the protease activity of GDH, which reveals that it probably interacts with all core histone tails but clips only H3 (Fig. 8, E–H). For control we also performed the clipping assays in the presence of equivalent amounts of only GST, BSA, and buffer (pH 7.5 buffer in which GST-histone tails were dissolved) (Fig. 8, H and I). Only GST, BSA, and buffer did not show any significant inhibition. The inhibition due to GST-H3 was quantified with that due to only GST as reference in terms of amount of intact H3 (Fig. 8J).
FIGURE 8.
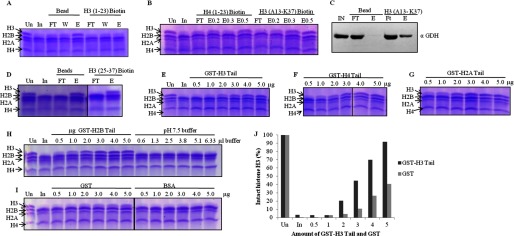
GDH interacts with all the core histones but clips only H3. In all gel pictures, lanes marked Un have undigested chicken brain core histones for reference. In is brain core histones digested by input, which is GDH active fraction. A, GDH pulldown by biotin-modified H3 (1–23) peptide conjugated to avidin beads using unmodified beads as control was fractionates into flow-through (FT), wash (W), and elution (E) preparations, incubated with brain core histones, and analyzed for H3-clipping activity on 15% SDS-PAGE. B, shown is a clipping assay from the fractions of peptide pulldown of GDH with biotin-labeled H3 (13–37) peptide and H4 (1–23) peptide. E0.2, E0.3, and E0.5 denote elutions in the presence of 0.2, 0.3, and 0.5 m NaCl. C, immunoblot analysis determines the presence of GDH in the peptide pulldown fractions using H3 (13–37) peptide. D, shown is a clipping assay from the fractions of peptide pulldown of GDH with H3 (25–37) peptide. E–H, shown is competitive inhibition of GDH by GST-histone tails. GST-tagged tails of histone H3 (residues 1–41) (E), histone H4 (residues 1–36) (F), histone H2A (residues 1–38) (G), and histone H2B (residues 1–33) (first six lanes of panel H) were used. Increasing amounts of GST-tagged tails were added to the brain core histones and GDH in assay buffer, incubated at 37 °C for 1 h, and then resolved on 15% SDS-PAGE. The control experiments were performed by using increasing amounts of pH 7.5 buffer (last six lanes of panel H) in the reaction mixtures (instead of GST-histone tails) to verify that the inhibition was not caused by higher pH. Protease assay in the presence of pure GST and BSA proteins (I) served as controls. J, shown is quantification of protease activity inhibition due to GST-H3 tails as compared with same due to GST.
SPR Analysis Confirms the Interaction of GDH with Core Histones
SPR experiments conducted using immobilized GDH and the individual core histones as the analyte confirmed that GDH interacts preferentially and stably with histone H3 and H4 (Fig. 9, A and D). The interaction of GDH with histone H2A and H2B was relatively transient and less stable as indicated by dropping relative units during the association phase itself (Fig. 9, B and C). The binding kinetics for GDH-core histone interactions were globally fit to a 1:1 Langmuir binding reaction model with the on (kon) and off (koff) rate constants and Kd values listed (Fig. 9E). GDH displays altered binding kinetics and affinities during interactions with different core histones. The GDH-H3 interaction yields a kon rate of 102 m−1s−1 and a koff rate of 1.67 × 10⁻⁷ s−1. The calculated equilibrium dissociation constant Kd is 0.167 nm for GDH:H3. The GDH:H2A interaction yields a kon rate of 2.36 × 10⁵ m−1s−1 and a koff rate of 1.91 × 10⁻² s−1. The kon rate constants for GDH-H2B and GDH-H4 interactions are 2.94 × 10⁶ and 9.81 × 10⁴ m−1s−1, whereas the koff rate constants for the interactions are 2.49 × 10⁻² and 2.45 × 10⁻³ s−1.
FIGURE 9.
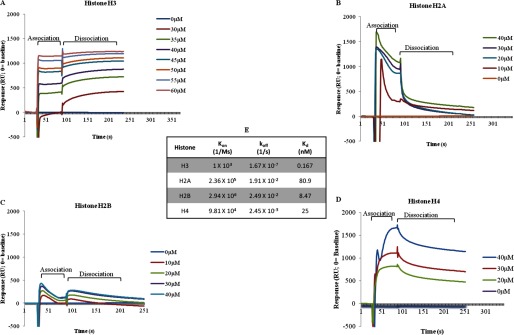
Surface plasmon resonance analysis of GDH interactions. A–D, interaction of GDH with core histones was analyzed by SPR-recombinant histone H3 (A), H2A (B), H2B (C), and H4 (D). E, binding kinetics of GDH is shown. The Kd, kon, and koff rate contants for the GDH-H3, GDH-H2A, GDH-H2B, and GDH-H4 interactions are shown.
Histone H3-clipping Site Exists after H3 Lys-23 and Lys-27
In our previous study (25), through analysis of the gel electrophoresis profile of in vitro digested histone H3 and intact core histones, we estimated one of the clipping sites to be near Lys-27. By immunoblot analysis of histones prepared from chicken liver using antibodies against the post-translational modifications H3K23ac, H3K27me2, and H3K27ac, we had observed the presence of Lys-27 and absence of Lys23 in in vivo clipped histone H3 (25). This indicated that the clipping site(s) existed between residues Lys-23 and Lys-27. For confirmation, we sequenced the histone H3 sub-bands produced by in vitro protease assay by Edman degradation method and found two cleavage sites, one between Lys-23 and Ala-24 and the other between Lys-27 and Ser-28 (Fig. 10).
FIGURE 10.

Cleavage sites preferred by GDH in histone H3. Two cleavage sites in histone H3 were revealed by Edman sequencing of clipped H3. Histone H3 sub-bands produced in in vitro protease assay were sequenced by Edman degradation method. The clipping sites identified in the H3 N-terminal tail sequence are indicated.
GDH Clips Free as Well as Chromatin-bound Histone H3
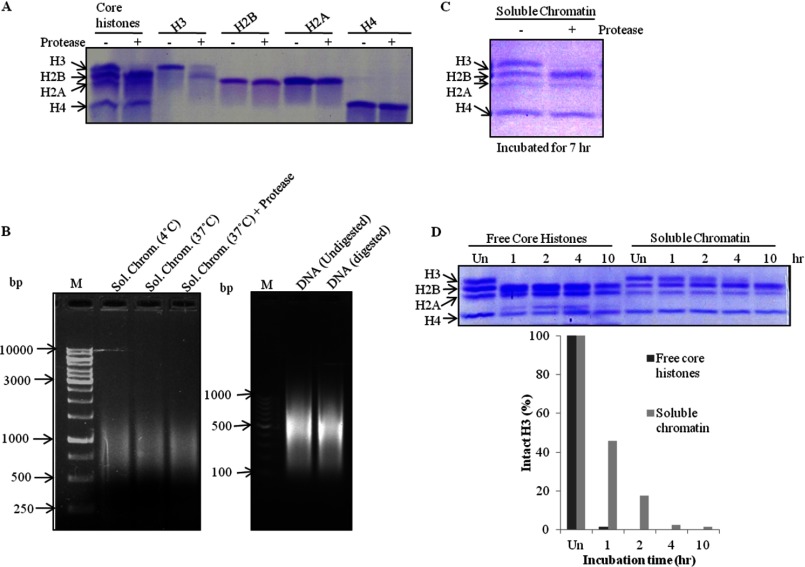
To ascertain the specificity of GDH, the most logical and convincing course of action was to determine if the enzyme showed its activity on non-substrate proteins similar to the substrate (histone H3). Because the histones are evolutionarily conserved and quite similar to each other in terms of the charges present on their N-terminal tail domains, the choice of core histones for the substrate-specificity assay was the most obvious one. We found our protease to be highly specific to histone H3, as it did not degrade any other core histone (Fig. 11A). Because histones exist in both forms, free form as well as chromatin-bound form in the cell, to examine whether GDH can also clip chromatin-bound H3 we prepared soluble chromatin from brain tissue and determined its integrity at 4 and 37 °C and also in the presence of GDH (at 37 °C) (Fig. 11B, left panel). We also determined the integrity of DNA extracted from digested and undigested chromatin (Fig. 11B, right panel). An assay was conducted by incubating the soluble chromatin in the presence of GDH. We observed the disappearance of intact H3 upon longer incubation (Fig. 11C). In our time point assay, free histone H3 was found to be more accessible to GDH than chromatin-bound H3 (Fig. 11D).
FIGURE 11.
GDH clips free as well as chromatin-bound histone H3. A, shown is a protease assay with the standard preparation of brain core histones and pure recombinant histones H3, H2B, H2A, and H4. B, integrity of soluble chromatin was evaluated after incubation for 7 h at 4 °C or at 37 °C without and with GDH (left panel), DNA purification, and electrophoresis on 1.2% agarose gel (right panel). M stands for DNA marker/ladder. C, shown is a protease assay with soluble chromatin incubated for 7 h at 37 °C. D, shown is a comparison of protease activity of GDH on free core histones and chromatin-bound histones using time point assay (upper panel) and its quantification (lower panel) after incubations for 1, 2, 4, or 10 h at 37 °C.
An Inhibitor of Protease Activity of GDH Exists in Brain Tissue
Assays with liver and brain microsomal extracts (LME and BME, respectively) showed the protease activity to be tissue-specific (Fig. 12A). Therefore, we also analyzed the tissue-specific expression of GDH in liver, brain, kidney, heart, muscle, and erythrocytes of chicken (Fig. 12, B and C, upper panel). There could be two reasons for the lack of histone H3-clipping activity in crude brain microsomal extract; first, the expression of GDH in brain is almost 7-fold less (Fig. 12C, lower panel) as compared with that in liver, and second, a physiological inhibitor of protease activity of GDH may exist in brain. Size exclusion chromatography of the brain microsomal extract led to the separation of the active GDH from the inhibitory factor. Protease assay with these gel filtration fractions revealed the presence of active GDH with protease activity in brain when incubated for a longer time (Fig. 12D). Moreover, an inhibition assay with the BER Superose 6 fractions (Fig. 13A, upper panel) showed the presence of a low molecular weight inhibitor in fraction 64 (BME64) (Fig. 13A, lower panel). To determine if the inhibition could be reversed by the addition of β-mercaptoethanol, we carried out an assay in the presence of excess β-mercaptoethanol (20 mm). We found the inhibition to be irreversible in reducing conditions (Fig. 13B). The BME64 fraction was further purified through a high resolution size-exclusion column (Fig. 13E), and inhibitor activity in the fractions was examined as above (Fig. 13F). On the basis of gel filtration profile of the inhibitor, we estimate the size of the inhibitor to be ∼15 kDa. An enzymatic activity can be inhibited by four mechanisms: competitive inhibition (wherein the inhibitor occupies/masks the active site), non-competitive inhibition (the inhibitor may bind to the enzyme or the enzyme-substrate complex irrespective of the binding of the substrate), uncompetitive inhibition (the inhibitor binds only to the enzyme-substrate complex), and irreversible inhibition (covalent interaction of inhibitor with the enzyme may occur inactivating the enzyme permanently). The possibility of inhibition by covalent disulfide bond formation between the protease and inhibitor was ruled out because the inhibition could not be reversed even in the presence of high β-mercaptoethanol concentration (Fig. 13B). The minimum inhibitory concentration of inhibitor was optimized (Fig. 13C) to determine an optimum dose for competitive assays, which helped us rule out competitive inhibition as a mechanism in play. This could be inferred because increasing concentrations of the substrate (histones) could not recover the activity (Fig. 13D). However, the mechanism of protease inhibition is not yet clear. Experiments are in progress to resolve this issue.
FIGURE 12.
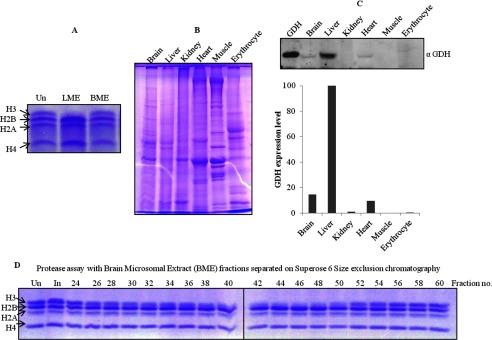
Tissue-specific expression of GDH. Un stands for undigested core histones. A, shown is protease activity of GDH in chicken liver (LME) and brain (BME) microsomal extracts incubated for 1 h at 37 °C and analyzed on 15% SDS-PAGE. B, whole cell extracts were prepared from various tissues (indicated on top of the gel) were run on 10% SDS-PAGE. C, an immunoblot analysis shows the presence of GDH. Equal amounts of whole cell extracts were transferred and immunoblotted using anti-GDH (anti-GLUD1) antibody to determine the expression of GDH in the different tissues (upper panel). The GDH present in the tissues was then quantified (lower panel). D, brain microsomal extract was fractionated by Superose 6 size exclusion chromatography. Protease activity in fractions, noted above the gel lanes, was determined by incubation with core histones for 4 h at 37 °C.
FIGURE 13.
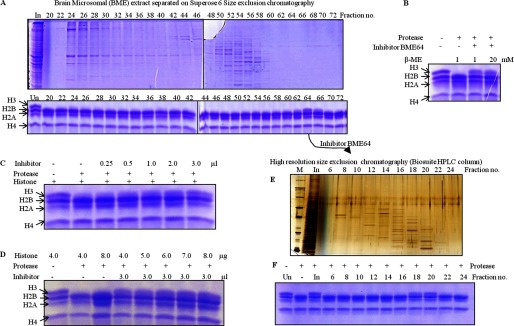
Identification of an inhibitor that inhibits the protease activity of GDH. A, BME was fractionated on the Superose 6 column, and the protein profile was evaluated on 10% SDS-PAGE (upper panel). The presence of an inhibitor specific to GDH was examined by incubating equal volumes of each fraction with core histones and GDH in assay buffer (lower panel) for 2 h at 37 °C. Reaction mixtures were resolved on 15% SDS-PAGE. Undigested brain core histones (Un) were loaded as reference. In, input. The BME fraction 64 was further purified through a high resolution size-exclusion column (Biosuite 125, Waters) (E) and tested for inhibitor activity as above (F). B, increasing concentrations of β-mercaptoethanol did not reverse the effect of inhibitor. Undigested histones and histones with GDH but without inhibitor were incubated as controls. The whole reaction mixture was resolved on 15% SDS-PAGE. C and D, increasing amounts of inhibitor from fraction 64 were added to the assay with proper controls (C). The addition of increasing amounts of core histones to the assay did not reverse inhibition (D). An assay with the highest amount of core histones with GDH and without inhibitor was used as the control (third lane). After incubation for 2 h at 37 °C, reaction products were resolved on 15% SDS-PAGE.
DISCUSSION
A few studies have demonstrated proteolysis of histones in different organisms. Despite significant progress in characterization of proteolytic processing of histones, the regulation and physiological role of it largely remains unclear. Our data suggest that the well known GDH possesses a novel H3-clipping activity in chicken tissues.
Assays with GDH prepared from rat liver tissue confirm that mammalian GDH also possesses the histone H3-specific clipping activity, thereby indicating that this protease activity of GDH may be evolutionarily conserved. We have also shown recombinant mouse GDH to possess the protease activity. However, the clipping activity of recombinant GDH was found to be less as compared with that of GDH purified from chicken and rat tissues. In fact, the activity of rGDH was almost 575 times lesser than that of chicken liver GDH, amounting to a specific activity of 34.78 units/mg of protein. We surmised that this could have been because of the presence of less monomeric rGDH and more hexameric rGDH. The size-exclusion chromatography profile of rGDH, however, shows that the rGDH prepared was neither hexameric GDH (else it would have eluted earlier) nor did its profile coincide completely with that of active chicken liver GDH. To confirm the same, we treated the rGDH with 20 mm β-mercaptoethanol for 5 h before setting an assay. We still did not observe any significant increase in activity (data not shown). This indicated that the rGDH prepared was probably misfolded or that it lacks some necessary post-translational modification(s) or cofactor(s). The inhibition of protease activity of biochemically purified GDH (from rat and chicken) and recombinant GDH (from E. coli) in the presence of a cysteine protease-specific inhibitor ruled out the possibility of histone H3 tail clipping by any contaminating proteins.
According to our in vitro characterization experiments, the activity of GDH is probably modulated by one or more of the following factors: physiological inhibitor, redox state, and cellular ionic concentration.
The physiologically relevant inhibition of protease activity purified in this study by divalent cations like Zn2+, Cu2+, etc. has also been demonstrated in our in vitro protease assays. However, cations like Ca2+ and Mg2+ do not show any significant effect on protease activity of GDH.
Also, previous studies (31) have shown that the activity of thiol-disulfide conversion-regulated enzymes can be altered/affected by the presence of divalent metal ions. Furthermore, cysteine proteases have the ability to bind metal ions like zinc, indicating that the possibility of the presence of a regulatory mechanism involving metal ions for GDH is not far-fetched indeed. Because we know that our protease activity is cysteine-dependent and that GDH has cysteine residues, the inhibition of the protease activity was expected.
We have shown the protease activity of GDH to be dependent on the presence of reducing environment in vitro. This suggests that the cysteine residue(s) in the molecule needs to be in its reduced thiol form and not in the oxidized disulfide state. Treatment with diamide, which oxidizes cysteine residues to form disulfide linkages, leads to hexamerization of GDH. Because only the monomeric form (and not the hexameric form) displays significant protease activity, it is likely that the cysteine residue(s) that is involved in hexamerization is also critical for protease activity (thus corroborating the inference that GDH is a cysteine protease). According to structural studies, it is the C-domain that is involved in multimerization of GDH (32, 33). Therefore, it is possible that this domain is directly or indirectly involved in the protease activity. However, we did not find any of the various known cysteine protease sequence motifs in the protein sequence of chicken GDH available in the Protein Data Bank.
The canonical GDH activity is known to be optimal only between near-neutral and alkaline pH (34), whereas the protease activity is significantly inhibited at this pH. This implies that GDH possesses its canonical dehydrogenase activity when in neutral pH and the protease activity only when it is introduced in a microenvironment that favors maintenance of the cysteine residue(s) in its reduced form. Also, the canonical activity of GDH is shown by the hexameric form, which lacks protease activity. However, we have shown that under highly reducing conditions, the hexameric form too can show the clipping activity. This could be a result of the conversion of inactive hexameric form to active monomeric form. Therefore, it is possible that the cellular redox state too modulates the protease activity of GDH.
GDH interacts with all core histone tails but with different affinities. The affinity of GDH for H4 tail seems to be the highest as higher salt concentration was required to elute the bound GDH. However, the most stable interaction occurs with both H3 and H4 as suggested by the SPR analysis. Binding pattern of GDH with H4 reveals an ideal interaction curve with a stable association and a proper dissociation phase. However, in the case of H3, the dissociation curve is lacking, which might be because of the formation and stability of enzyme-substrate complex in the experimental time-frame chosen. On the other hand, interactions of GDH with histone H2A and H2B are rather weak and transient. Such binding patterns of GDH with the core histones suggest an interaction with the nucleosome/chromatin. This is supported by the observation of protease activity on soluble chromatin lending the GDH protein a physiological relevance as a chromatin modifier.
Through Edman sequencing of the histone H3 sub-bands produced in in vitro protease assay, we have mapped two different cleavage sites (between Lys-23 and Ala-24 and between Lys-27 and Ser-28) preferred by GDH on histone H3. On denaturing polyacrylamide gels, one of the clipped products migrates with histone H2B and another migrates between histone H2B and H2A (probable cleavage site between Lys-23 and Ala-24). However, upon incubating histone H3 with the protease for longer duration (3 h), we also saw another band migrating just faster than in vivo produced clipped H3 (ΔH3) (25). This faster migrating band seems to be the result of cleavage between Lys-27 and Ser-28. Because core histones prepared from chicken liver show the presence of only clipped H3 (ΔH3), it is possible that some additional factors in the cell determine/regulate the cleavage site specificity of GDH in vivo.
In this study we have also partially purified a physiological inhibitor of the protease activity of GDH from chicken brain. On the basis of its elution profile from size exclusion column, the inhibitor is an ∼15-kDa molecule comparable to histone H3 in size. We ruled out the possibility that the undigested band seen in inhibition reactions is the inhibitor (and not intact H3) because there was no increase in the intensity of histone H2B band (an indication of H3 digestion because one of the H3 sub-bands migrates with histone H2B). More studies need to be conducted to identify the inhibitor, find out if the inhibitor too is expressed in a tissue-specific manner, and reveal the mechanism of inhibition.
Chromatin modifiers are known to be active regulators of gene expression in the cell. Earlier studies have shown that an unidentified serine protease reportedly regulates yeast gene expression during the stationary and sporulation phase. The identification and characterization of developmentally regulated H3 cleavage by cathepsin L during ESC differentiation in mouse has also been reported recently (23). Cathepsin L is also known to regulate gene expression, and such can be the case with GDH as well albeit under certain conditions.
In the near future we plan to address some additional fundamental questions about the physiological significance of the protease activity of GDH in the context of gene expression. First, How is the protease activity of GDH regulated by epigenetic modifications? Second, What is the fate of cleaved H3? Is it replaced or recycled during DNA replication or transcription? We have screened for GDH activity in liver and brain and found it in both. Third, because the inhibitor seems to be a critical factor with the potential to regulate the tissue and temporal specificity of this activity, we also wish to identify the inhibitor and its expression profile.
Finally, an unanticipated outcome of our study was the implication of GDH in an epigenetic process with which it had never been known to be associated. The study heralds advanced research that will eventually lead to a better understanding of the process of epigenetic regulation by histone tail clipping.
Supplementary Material
Acknowledgments
We thank Professor Karolin Luger (Colorado State University) for the gift of individual core histones, Dr. Robert Roeder (The Rockefeller University) for the gift of GST-histone plasmids, and Dr. Rajnikant Mishra (Banaras Hindu University) for providing the rat tissues. We are grateful to Dr. Joseph Reese for invaluable input and suggestions to improve the manuscript. We acknowledge C-CAMP (Centre for Cellular and Molecular Platforms), National Centre for Biological Sciences (NCBS), Bangalore for mass spectrometry analysis and the Protein Sequencing Facility at IISc Bangalore for Edman Sequencing. We are also thankful to the Director of Indian Institute of Science Education and Research Bhopal for providing the infrastructure, facilities, and funds for this study. Members of the chromatin biology laboratory are acknowledged for helpful discussions throughout this work.
This work was supported by grants from the Department of Biotechnology, Council of Scientific and Industrial Research, Government of India and Indian Institute of Science Education and Research Bhopal (to R. S. T.).

This article contains supplemental Table S1.
- ER
- endoplasmic reticulum
- RER
- rough ER
- GDH
- glutamate dehydrogenase
- rGDH
- recombinant GDH
- β-ME
- β-mercaptoethanol
- PIC
- protease inhibitor mixture
- BME
- brain microsomal extract.
REFERENCES
- 1. Luger K., Mäder A. W., Richmond R. K., Sargent D. F., Richmond T. J. (1997) Crystal structure of the nucleosome core particle at 2.8 Å resolution. Nature 389, 251–260 [DOI] [PubMed] [Google Scholar]
- 2. Bertin A., Leforestier A., Durand D., Livolant F. (2004) Role of histone tails in the conformation and interactions of nucleosome core particles. Biochemistry 43, 4773–4780 [DOI] [PubMed] [Google Scholar]
- 3. Clapier C. R., Cairns B. R. (2009) The biology of chromatin remodeling complexes. Annu. Rev. Biochem. 78, 273–304 [DOI] [PubMed] [Google Scholar]
- 4. Chandy M., Gutiérrez J. L., Prochasson P., Workman J. L. (2006) SWI/SNF displaces SAGA-acetylated nucleosomes. Eukaryot. Cell 5, 1738–1747 [DOI] [PMC free article] [PubMed] [Google Scholar]
- 5. Chodaparambil J. V., Edayathumangalam R. S., Bao Y., Park Y. J., Luger K. (2006) Nucleosome structure and function. Ernst Schering Res. Found Workshop 57, 29–46 [DOI] [PubMed] [Google Scholar]
- 6. Vignali M., Hassan A. H., Neely K. E., Workman J. L. (2000) ATP-dependent chromatin-remodeling complexes. Nat. Rev. Mol. Cell. Biol. 20, 1899–1910 [DOI] [PMC free article] [PubMed] [Google Scholar]
- 7. Depken M., Schiessel H. (2009) Nucleosome shape dictates chromatin fiber structure. Biophys. J. 96, 777–784 [DOI] [PMC free article] [PubMed] [Google Scholar]
- 8. Hassan A. H., Neely K. E., Workman J. L. (2001) Histone acetyltransferase complexes stabilize swi/snf binding to promoter nucleosomes. Cell 104, 817–827 [DOI] [PubMed] [Google Scholar]
- 9. Lee K. K., Workman J. L. (2007) Histone acetyltransferase complexes. One size doesn't fit all. Nat. Rev. Mol. Cell. Biol. 8, 284–295 [DOI] [PubMed] [Google Scholar]
- 10. Pattenden S. G., Chandy M. J., Gutiérrez J. L., Workman J. L. (2005) Chromatin dynamics rule the genome. Genome. Biol. 6, 355. [DOI] [PMC free article] [PubMed] [Google Scholar]
- 11. Peterson C. L. (2002) Chromatin remodeling enzymes. Taming the machines. Third in review series on chromatin dynamics. EMBO Rep. 3, 319–322 [DOI] [PMC free article] [PubMed] [Google Scholar]
- 12. Eickbush T. H., Watson D. K., Moudrianakis E. N. (1976) A chromatin-bound proteolytic activity with unique specificity for histone H2A. Cell 9, 785–792 [DOI] [PubMed] [Google Scholar]
- 13. Elia M. C., Moudrianakis E. N. (1988) Regulation of H2a-specific proteolysis by the histone H3:H4 tetramer. J. Biol. Chem. 263, 9958–9964 [PubMed] [Google Scholar]
- 14. Eickbush T. H., Godfrey J. E., Elia M. C., Moudrianakis E. N. (1988) H2a-specific proteolysis as a unique probe in the analysis of the histone octamer. J. Biol. Chem. 263, 18972–18978 [PubMed] [Google Scholar]
- 15. Kaul R., Hoang A., Yau P., Bradbury E. M., Wenman W. M. (1997) The chlamydial EUO gene encodes a histone H1-specific protease. J. Bacteriol. 179, 5928–5934 [DOI] [PMC free article] [PubMed] [Google Scholar]
- 16. Allis C. D., Bowen J. K., Abraham G. N., Glover C. V., Gorovsky M. A. (1980) Proteolytic processing of histone H3 in chromatin. A physiologically regulated event in Tetrahymena micronuclei. Cell 20, 55–64 [DOI] [PubMed] [Google Scholar]
- 17. Allis C. D., Wiggins J. C. (1984) Proteolytic processing of micronuclear H3 and histone phosphorylation during conjugation in Tetrahymena thermophila. Exp. Cell Res. 153, 287–298 [DOI] [PubMed] [Google Scholar]
- 18. Allis C. D., Allen R. L., Wiggins J. C., Chicoine L. G., Richman R. (1984) Proteolytic processing of h1-like histones in chromatin. A physiologically and developmentally regulated event in Tetrahymena micronuclei. J. Cell Biol. 99, 1669–1677 [DOI] [PMC free article] [PubMed] [Google Scholar]
- 19. Surowy C. S., Berger N. A. (1983) Nucleotide-stimulated proteolysis of histone H1. Proc. Natl. Acad. Sci. U.S.A. 80, 5510–5514 [DOI] [PMC free article] [PubMed] [Google Scholar]
- 20. Falk M. M., Grigera P. R., Bergmann I. E., Zibert A., Multhaup G., Beck E. (1990) Foot-and-mouth disease virus protease 3C induces specific proteolytic cleavage of host cell histone H3. J. Virol. 64, 748–756 [DOI] [PMC free article] [PubMed] [Google Scholar]
- 21. Tesar M., Marquardt O. (1990) Foot-and-mouth disease virus protease 3C inhibits cellular transcription and mediates cleavage of histone H3. Virology 174, 364–374 [DOI] [PubMed] [Google Scholar]
- 22. Belsham G. J., McInerney G. M., Ross-Smith N. (2000) Foot-and-mouth disease virus 3C protease induces cleavage of translation initiation factors eIF4A and eIF4G within infected cells. J. Virol. 74, 272–280 [DOI] [PMC free article] [PubMed] [Google Scholar]
- 23. Duncan E. M., Muratore-Schroeder T. L., Cook R. G., Garcia B. A., Shabanowitz J., Hunt D. F., Allis C. D. (2008) Cathepsin L proteolytically processes histone H3 during mouse embryonic stem cell differentiation. Cell 135, 284–294 [DOI] [PMC free article] [PubMed] [Google Scholar]
- 24. Santos-Rosa H., Kirmizis A., Nelson C., Bartke T., Saksouk N., Cote J., Kouzarides T. (2009) Histone H3 tail clipping regulates gene expression. Nat. Struct. Mol. Biol. 16, 17–22 [DOI] [PMC free article] [PubMed] [Google Scholar]
- 25. Mandal P., Azad G. K., Tomar R. S. (2012) Identification of a novel histone H3 specific protease activity in nuclei of chicken liver. Biochem. Biophys. Res. Commun. 421, 261–267 [DOI] [PubMed] [Google Scholar]
- 26. Lee W. K., Shin S., Cho S. S., Park J. S. (1999) Purification and characterization of glutamate dehydrogenase as another isoprotein binding to the membrane of rough endoplasmic reticulum. J. Cell. Biochem. 76, 244–253 [DOI] [PubMed] [Google Scholar]
- 27. Grillo C., Coppari S., Turano C., Altieri F. (2002) The DNA-binding activity of protein disulfide isomerase ERp57 is associated with the a(′) domain. Biochem. Biophys. Res. Commun. 295, 67–73 [DOI] [PubMed] [Google Scholar]
- 28. Shevchenko A., Tomas H., Havlis J., Olsen J. V., Mann M. (2006) In-gel digestion for mass spectrometric characterization of proteins and proteomes. Nat. Protoc. 1, 2856–2860 [DOI] [PubMed] [Google Scholar]
- 29. Wysocka J. (2006) Identifying novel proteins recognizing histone modifications using peptide pull-down assay. Methods 40, 339–343 [DOI] [PMC free article] [PubMed] [Google Scholar]
- 30. An W., Roeder R. G. (2003) Direct association of p300 with unmodified H3 and H4 N termini modulates p300-dependent acetylation and transcription of nucleosomal templates. J. Biol. Chem. 278, 1504–1510 [DOI] [PubMed] [Google Scholar]
- 31. Bandyopadhyay D., Chatterjee A. K., Datta A. G. (1997) Effect of cadmium, mercury and copper on partially purified hepatic flavokinase of rat. Mol. Cell. Biochem. 167, 73–80 [DOI] [PubMed] [Google Scholar]
- 32. Baker P. J., Britton K. L., Engel P. C., Farrants G. W., Lilley K. S., Rice D. W., Stillman T. J. (1992) Subunit assembly and active site location in the structure of glutamate dehydrogenase. Proteins 12, 75–86 [DOI] [PubMed] [Google Scholar]
- 33. Stillman T. J., Baker P. J., Britton K. L., Rice D. W. (1993) Conformational flexibility in glutamate dehydrogenase. Role of water in substrate recognition and catalysis. J. Mol. Biol. 234, 1131–1139 [DOI] [PubMed] [Google Scholar]
- 34. Lee M. K., González J. M., Robb F. T. (2002) Extremely thermostable glutamate dehydrogenase (GDH) from the freshwater archaeon Thermococcus waiotapuensis. Cloning and comparison with two marine hyperthermophilic GDHs. Extremophiles 6, 151–159 [DOI] [PubMed] [Google Scholar]
Associated Data
This section collects any data citations, data availability statements, or supplementary materials included in this article.


