Background: Many bacteria possess multiple CheR methyltransferases that methylate the conserved chemoreceptor signaling domains.
Results: CheR2 of Pseudomonas putida is essential for chemotaxis, whereas CheR1 is required for efficient biofilm formation, and only CheR2 methylates chemotaxis receptors McpS and McpT.
Conclusion: Paralogous CheR have different functions.
Significance: CheR have evolved to specifically recognize cognate chemoreceptors.
Keywords: Calorimetry, Chemotaxis, Protein Methylation, Pseudomonas, Receptor Modification, Receptors, S-Adenosylmethionine (SAM), Signal Transduction, CheR Methyltransferase, Chemoreceptor
Abstract
Chemosensory pathways are a major signal transduction mechanism in bacteria. CheR methyltransferases catalyze the methylation of the cytosolic signaling domain of chemoreceptors and are among the core proteins of chemosensory cascades. These enzymes have primarily been studied Escherichia coli and Salmonella typhimurium, which possess a single CheR involved in chemotaxis. Many other bacteria possess multiple cheR genes. Because the sequences of chemoreceptor signaling domains are highly conserved, it remains to be established with what degree of specificity CheR paralogues exert their activity. We report here a comparative analysis of the three CheR paralogues of Pseudomonas putida. Isothermal titration calorimetry studies show that these paralogues bind the product of the methylation reaction, S-adenosylhomocysteine, with much higher affinity (KD of 0.14–2.2 μm) than the substrate S-adenosylmethionine (KD of 22–43 μm), which indicates product feedback inhibition. Product binding was particularly tight for CheR2. Analytical ultracentrifugation experiments demonstrate that CheR2 is monomeric in the absence and presence of S-adenosylmethionine or S-adenosylhomocysteine. Methylation assays show that CheR2, but not the other paralogues, methylates the McpS and McpT chemotaxis receptors. The mutant in CheR2 was deficient in chemotaxis, whereas mutation of CheR1 and CheR3 had either no or little effect on chemotaxis. In contrast, biofilm formation of the CheR1 mutant was largely impaired but not affected in the other mutants. We conclude that CheR2 forms part of a chemotaxis pathway, and CheR1 forms part of a chemosensory route that controls biofilm formation. Data suggest that CheR methyltransferases act with high specificity on their cognate chemoreceptors.
Introduction
Bacteria need to constantly sense and adapt to changing environmental conditions to assure survival. This important function is primarily mediated by one-component systems, two-component systems, and chemosensory pathways (1–4). The latter pathways were initially described because they mediate flagellum-mediated taxis, but more recent studies have shown that these routes are also involved in type IV pili-based taxis or may carry out alternative cellular functions (3). A bioinformatics study has led to the identification of core proteins that are present with high frequency in chemosensory pathways and a series of auxiliary proteins that are found with lower frequency (3). Core proteins are the chemoreceptors, the CheA histidine kinase, the CheW coupling protein, and the CheY response regulator as well as the CheR methyltransferase and the CheB methylesterase. The central feature of chemosensory pathways is the ternary complex formed by the chemoreceptor, the CheA histidine kinase, and the CheW coupling protein. The function of chemosensory pathways is based on the concerted action of excitatory and adaptation mechanisms. Canonical pathway excitation is triggered by the recognition of signal molecules at the chemoreceptor sensor domain that causes a molecular stimulus that is transduced across the membrane, where it modulates CheA autophosphorylation and in turn transphosphorylation activity toward the response regulator CheY. When phosphorylated, CheY undergoes a conformational change, which in the case of chemotaxis pathways permits an interaction with the flagellar motor causing a modulation of its activity (5).
Adaptation mechanisms have evolved to assure a restoration of the pre-stimulus behavior in the presence of the stimulus (6–9). The canonical adaptation mechanism consists of the methylation and demethylation of chemoreceptors by the CheR methyltransferase and CheB methylesterase, respectively. The fact that CheR is among the core proteins of chemosensory pathways is also supported by studies that show that cheR mutation either abolishes or impairs aerotactic or chemotactic behavior in many different species (10–14). The CheR methyltransferases from Escherichia coli and Salmonella typhimurium have been studied in the past. It was shown that ligand binding at the chemoreceptor increases CheR-mediated methylation of 4–6 glutamate residues at the chemoreceptor signaling domain, which in turn modulates the capacity of the receptor to alter CheA autophosphorylation (15, 16). Receptor methylation was found to significantly alter the affinity of signal molecules for the MCP-CheA-CheW ternary complex (17).
CheR uses S-adenosylmethionine (SAM)3 as substrate, and the methylation reaction gives rise to S-adenosylhomocysteine (SAH) (18). Interestingly, SAM and SAH compete for binding to the same site at CheR. Because SAH was found to bind tighter than SAM, CheR is thus subject to product feedback inhibition (18–20). As a consequence, biological methylation processes were found to be inhibited by SAH. The three-dimensional structure of CheR from S. typhimurium has been solved in complex with SAH and the pentapeptide NWETF (21). This pentapeptide is present at the C-terminal extension of the enterobacterial high abundance chemoreceptors and represents a site for CheR tethering to the chemoreceptor (22).
Much of what we know on chemosensory pathways is due to the study of flagellum-mediated taxis in E. coli and S. typhimurium (4, 23). Both species contain a single chemosensory pathway, a single cheR gene, and a limited number of chemoreceptors. Many free-living bacteria contain multiple copies of cheR genes (24) and significantly more chemoreceptor genes than E. coli or S. typhimurium (25). The site of CheR methylation lies within the cytoplasmic signaling domain of chemoreceptors, which is the most conserved domain of all proteins that participate in chemosensory pathways (26, 27). This hence raises the question of the specificity of the CheR - chemoreceptor interaction.
We have addressed this question using Pseudomonas as a model organism. In Pseudomonas aeruginosa five gene clusters encoding signaling proteins have been identified that form four chemosensory pathways (28). Two pathways, termed che (encoded by clusters I and V) (29, 30) and che2 (encoded by cluster II) (28) have a role in chemotaxis. The third pathway (wsp) (31) regulates cyclic diguanylate concentrations (formed by the cluster III gene products), which in turn was found to modulate biofilm formation. The fourth pathway, chP (cluster IV genes), modulates the cAMP level (32) and consequently several other features including type IV pili synthesis and twitching motility (33, 34). Because the signaling proteins of these pathways are paralogous, there thus exists the possibility of cross-talk between pathways.
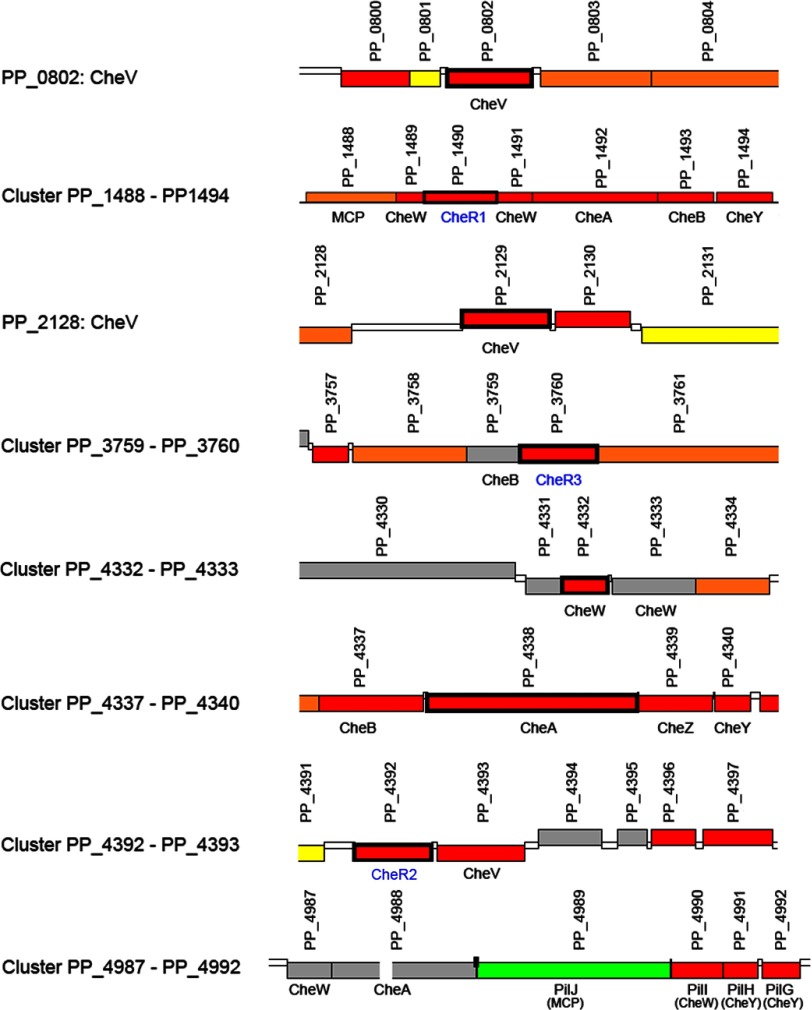
Many strains of Pseudomonas putida show an elevated resistance to stress factors and, due to their metabolic versatility, are able to degrade a series of toxic compounds, which offers the possibility of using these strains for the biodegradation of pollutants and biotransformation purposes (35, 36). A series of reports shows that chemotaxis toward pollutants increases biodegradation efficiency (for review, see Ref. 37), and a pollutant chemoreceptor, McpT has recently been identified in our laboratory (38). Despite the biotechnological importance of P. putida strains, no information as to the existence of individual chemosensory routes is available. Both P. aeruginosa and P. putida contain 26 chemoreceptors genes, but the organization of genes encoding the cytosolic signaling proteins is different in these two species (Fig. 1 and Ref. 28).
FIGURE 1.
Predicted genes for chemosensory signaling proteins in P. putida KT2440. Gene annotation is according to Pseudomonas Genome Database. The three CheR paralogues analyzed in this article are shown in blue.
To close this gap of knowledge and to assess the specificity of multiple CheR paralogues, we report here a study of the three CheR paralogues of P. putida KT2440. In the first part of this article the three recombinant proteins were analyzed by different biophysical techniques. We then demonstrate that exclusively CheR2 methylates the McpS (39–41) and McpT (38) chemotaxis chemoreceptors. The analysis of the three cheR mutants revealed that CheR2 is essential for chemotaxis, confirming the methylation assays, whereas mutation of CheR1 caused a dramatic reduction in biofilm formation. Data show a high specificity of action of the CheR paralogues and point to the existence of two signaling pathways that control either chemotaxis or biofilm formation.
EXPERIMENTAL PROCEDURES
Strains and Plasmids
The strains and plasmids used are listed in Table 1.
TABLE 1.
Strains and plasmids used in this study
| Features | Reference | |
|---|---|---|
| Strains | ||
| P. putida KT2440 | mt-2 pWW0 cured, TolS− | (62) |
| P. putida DOT-T1E | Tol+, wild type | (63) |
| P. putida KT2440R | Rifr, derivative of P. putida KT2440 | (64) |
| P. putida KT2440R-TK1038 | Rifr, cheR1::mini-Tn5 Kmr | (48) |
| P. putida KT2440R-TK1116 | KT2440R with plasmid pCHESI-3760 inserted into the cheR3 gene, Kmr (KT2440R PP3760::ΩKm, Kmr) | This study |
| P. putida KT2440R-TK1117 | KT2440R with plasmid pCHESI-4392 inserted into the cheR2 gene, Kmr (KT2440R PP4392:: ΩKm, Kmr) | This study |
| E. coli BL21 (DE3) | F−, ompI, hsdSB (r−B m−B) | (65) |
| E. coli C41 (DE3) | F - ompT hsdSB (rB-mB-) gal dcm (DE3) | (66) |
| E.coli BL21 StarTM (DE3) | F- ompT hsdSB (rB-mB-) gal dcm rne131 (D3) | Invitrogen |
| E. coli DH5α | supE44 ΔlacU169 (ϕ80 lacZΔM15) hsdR1 recA1 endA1 gyrA96 thi1 relA1 | (67) |
| E. coli DH5α-TK1043 | DH5α with pGEM-T-3760, Apr | This study |
| E. coli DH5α-TK1044 | DH5α with pGEM-T-4392, Apr | This study |
| E. coli DH5α-TK1048 | DH5α with pChesi-3760, Kmr | This study |
| E. coli DH5α-TK1049 | DH5α with pChesi-4390, Kmr | This study |
| Plasmids | ||
| pET200/DTOPO | Kmr, protein expression vector | Invitrogen |
| pET28b(+) | Kmr, protein expression vector | Novagen |
| pET28b-WspC-Pp | Kmr, pET28b (+) derivative | (42) |
| pET28b-CheR2 | Kmr, pET28b (+) derivative | This work |
| pET28b-CheR3 | Kmr, pET28b (+) derivative | This work |
| pET200/D-TOPO | Kmr, protein expression vector | Invitrogen |
| pET200/D-TOPO-mcpT | mcpT gene inserted in pET200/D-TOPO, KmR | This work |
| pET28b-mcpS | mcpS gene inserted in pET28b (+), KmR | This work |
| pGRT1 | large self-transmissible plasmid present in P. putida DOT-T1E | (68) |
| pGEM-T | Cloning vector with polyA, ampr | Promega |
| pGEM-T-3760 | pGEM-T carrying between EcoRI and BamHI sites, a 400-bp chromosomal fragment from the P. putida KT2440R cheR3 gene obtained by PCR as an EcoRI-BamHI fragment, Apr | This study |
| pGEM-T-4392 | pGEM-T carrying between EcoRI and BamHI sites, a 400-bp chromosomal fragment from the P. putida KT2440R cheR2 gene obtained by PCR as an EcoRI-BamHI fragment, Apr | This study |
| pCHESIΩKm | Apr Kmr, pUNϕ18 with the HindIII insert from pHP45ϕKm (Ω-Km interposon) at the HindIII site, oriT RP4 | (69) |
| pChesi-3760 | pCHESIΩKm carrying between EcoRI and BamHI sites, a 400-bp chromosomal fragment from the P. putida KT2440R cheR3 gene obtained by PCR as an EcoRI-BamHI fragment | This study |
| pChesi-4392 | pCHESIΩKm carrying between EcoRI and BamHI sites, a 400-bp chromosomal fragment from the P. putida KT2440R cheR2 gene obtained by PCR as an EcoRI-BamHI fragment | This study |
Cloning, Expression, and Purification of the 3 CheR Paralogues
The cloning, expression, and purification of CheR1 (WspC-Pp) was reported in Muñoz-Martínez et al. (42). DNA sequences encoding CheR2 (PP4392) and CheR3 (PP3760) were amplified by PCR using the oligonucleotides indicated in Table 2 and genomic DNA of P. putida KT2440 as template. The resulting products were digested with NdeI and BamHI and cloned into pET28b(+) (Novagen) linearized with the same enzymes. The resulting plasmids, pET28b-CheR2 and pET28b-CheR3, were verified by sequencing the insert and flanking regions.
TABLE 2.
Oligonucleotides used in this study
| Name | Sequence | Construction of |
|---|---|---|
| CheR2-f | 5′-AGAGGCGGCACATATGTCTACGGGTAATTTGG-3′ | pET28b-CheR2 |
| CheR2-r | 5′-CATCTCTCGATACCGGCCTGGATCCTTACTTG-3′ | pET28b-CheR2 |
| CheR3-f | 5′-CAACTGGAGCGCATATGACTAGCGAACGCA-3′ | pET28b-CheR3 |
| CheR3-f | 5′-ACTGCGCGTAGGATCCTCATGATTTACGGA-3′ | pET28b-CheR3 |
| mcpT-f | 5′-CACATTGAATTCTTAGATAATGAGGTGACAC-3′ | pET200/D-TOPO-mcpT |
| mcpT-r | 5′-TTCAGAGGATCCCTAAAGACGGAACATG-3′ | pET200/D-TOPO-mcpT |
| mcpS-f | 5′-AGAGCGCATATGAACAGCTGGTTCGCCAACATC-3′ | pET28b-mcpS |
| mcpS-r | 5′-TGCGGATCCTCAGACGCGGAACTGGCTGACCAG-3′ | pET28b-mcpS |
| PP3760F | 5′-AAGAATTC TTGACTAGCGAACGCAACAC-3′ | pChesi-3760 |
| PP3760R | 5′-AAGGATCC AGATGATGGTGCGTTCAAGC-3′ | pChesi-3760 |
| PP4392F | 5′-AAGAATTCGTGTCTACGGGTAATTTGGATTTC-3′ | pChesi-4392 |
| PP4390R | 5′-AAGGATCC GGCCGAGGTTGCTGCGCTCGAA-3′ | pChesi-4392 |
For protein overexpression E. coli BL21 (DE3) was transformed with pET28b-CheR2, and E. coli C41 (DE3) was transformed with pET28b-CheR3 (note: CheR3 did not express in E. coli BL21 (DE3)). The resulting strains were grown in 2-liter Erlenmeyer flasks containing 500 ml of LB medium supplemented with 50 μg/ml kanamycin at 30 °C to an A660 of 0.6. Protein production was induced by the addition of 0.1 mm isopropyl 1-thio-β-d-galactopyranoside, and growth was continued at 16 °C overnight before cell harvest by centrifugation at 10,000 × g for 30 min. Cell pellets were resuspended in buffer A (20 mm Tris, 0.1 mm EDTA, 500 mm NaCl, 10 mm Imidazole, 5 mm β-mercaptoethanol, 5% (v/v) glycerol, pH 8.0) and broken by French press treatment at 1000 p.s.i. After centrifugation at 20,000 × g for 1 h, the supernatant was passed through 0.22 μm filters (Millipore) and then loaded onto 5-ml HisTrap HP columns (Amersham Biosciences) equilibrated with buffer A and eluted with an imidazole gradient of 45–500 mm in buffer A. The proteins produced had the N-terminal sequence fusion MGSSHHHHHHSSGLVPRGSH containing the histidine tag for protein purification.
Isothermal Titration Calorimetry
Measurements were done on a VP-microcalorimeter (MicroCal, Northampton, MA) at 25 °C. Protein was dialyzed into analysis buffer (20 mm Tris/HCl, 150 mm NaCl, 2 mm MgCl2, 0.1 mm EDTA, 1 mm DTT, pH 7.5) and placed into the sample cell of the instrument. The ligand solutions were made up in the dialysis buffer and placed into the injector syringe. For the study of the interaction with SAM and SAH, typically 16–28 μm protein was titrated with 3.2–6.4 μl of SAM (1 mm) or SAH (0.5–1 mm). To study the interaction of the 3 CheR paralogues with the pentapeptide NWETF (synthesized by Biomedal, Sevilla, Spain), 30 μm protein was titrated with 12.8-μl aliquots of 1 mm peptide. In all cases, heat changes resulting from the titration of buffer with the respective ligands were subtracted from the titration data. Integrated, corrected, and concentration-normalized peak areas of raw data were fitted with the “one binding site model” of the MicroCal version of ORIGIN. The algorithm for data analysis is detailed in Wiseman et al. (43).
Analytical Ultracentrifugation Studies
An Optima XL-I analytical ultracentrifuge (Beckman-Coulter) was used to perform the analytical ultracentrifugation experiments of CherR2 (0.25–1.0 mg/ml) in the absence and presence of ligands (1 mm). The detection was carried out by means of a UV-visible absorbance detection system. Experiments were conducted at 20 °C using an AnTi50 8-hole rotor and Epon-charcoal standard double sector centerpieces (12-mm optical path). Absorbance scans were taken at the appropriate wavelength (280–295 nm). Sedimentation velocity experiments were performed at 48,000 rpm using 400-μl samples in 50 mm Tris/HCl, 300 mm NaCl, 1 mm DTT, pH 8.0. Differential sedimentation coefficient distributions, c(s), were calculated by least squares boundary modeling of sedimentation velocity data using the program SEDFIT (44). From this analysis, the experimental sedimentation coefficients of the proteins were corrected for solvent composition and temperature with the program SEDNTERP (45) to obtain the corresponding standard s values.
Differential Scanning Calorimetry
Differential scanning calorimetry experiments were carried out on a VP-DSC calorimeter (MicroCal) at a scan rate of 60 °C/h. Protein was dialyzed against 20 mm PIPES, 150 mm NaCl, 0.1 mm EDTA, 2 mm MgCl2, 5 mm Tris(2-carboxyethyl)phosphine, pH 7.5. The dialysis buffer was placed into the reference cell of the instrument. Calorimetric cells were kept under a pressure of 60 p.s.i. Several buffer-buffer base lines were obtained before each run with protein solutions to ascertain proper equilibration of the instrument. Reheating runs were carried out to determine the calorimetric reversibility of the denaturation process. The differential scanning calorimetry (DSC) experiments were carried out at a concentration of 1 mg/ml for CheR1 and CheR2 and 0.5 mg/ml for CheR3. For the binding studies, ligands were added at a concentration of 1 mm.
Cloning and Overexpression of mcpS and mcpT
The mcpT gene was amplified by PCR from P. putida DOT-T1E containing the megaplasmid pGRT1 using mcpT-f and mcpT-r primers (Table 2), which contain EcoRI and BamHI sites, respectively. The resulting PCR product was cloned into pET200/D-TOPO. The mcpS gene (PP4658) was amplified by PCR from P. putida KT2440 using primers mcpS-f and mcpS-r (Table 2), containing NdeI and BamHI sites, respectively, and the resulting PCR product was cloned in pET28b(+).
The resulting pET200/D-TOPO-mcpT and pET28b-mcpS plasmids were transformed into One Shot® E. coli BL21 StarTM (DE3) and E. coli C41(DE3), respectively. The resulting strains were grown in 2-liter Erlenmeyer flasks containing 500 ml of LB medium supplemented with 50 μg/ml kanamycin at 30 °C to an A660 of 0.6. Protein production was induced by adding isopropyl 1-thio-β-d-galactopyranoside (0.1 mm for McpT and 1 mm for McpS), and growth was continued at 18 °C overnight before cell harvest by centrifugation at 4,000 × g for 20 min at 4 °C. Cells were then frozen at −80 °C. All subsequent manipulations were done at 4 °C. Crude McpT- or McpS-enriched membranes were prepared by thawing cell pellets on ice, resuspending them with 30 ml of ice-cold 30 mm HEPES buffer, 100 mm NaCl, pH 7.0, containing EDTA-free protease inhibitor mixture (Roche Applied Science) and 100 units of benzonase (Roche Applied Science). Cells were broken by 3 passages through a French press at 1100 p.s.i. The homogenized cells were then centrifuged at 4000 × g for 15 min, the pellet was discarded, and the supernatant was centrifuged at 100 000 × g for 1 h. The resulting pellet of receptor-enriched membranes was resuspended in 30 mm HEPES, 100 mm NaCl, pH 7.0, containing 10% (w/v) sucrose, homogenized by passing 30 times through a 25-gauge needle, flash-frozen in liquid nitrogen, and stored at −80 °C. Aliquots of McpT- or McpS-enriched membranes were thawed just before each methylation experiment. To generate mock membranes that do not contain McpT or McpS, this procedure was applied to cells containing the empty expression plasmid.
Methyltransferase Assay
The methyltransferase activity was determined using the protocol described by Stock et al. (46). Briefly, McpT- or McpS-enriched membranes (1.5 mg of total membrane proteins/sample) were incubated either in the absence or in the presence of 4 μm concentrations of each purified CheR protein with 100 μm S-adenosyl-[methyl-3H]methionine (0.83 μCi/sample; PerkinElmer Life Sciences NET155250UC) and an aliquot of crude cytosolic extract from P. putida KT2440 (final protein concentration 5 mg/ml). This extract contains the enzymes necessary for the degradation of SAH, thus avoiding its accumulation and feedback inhibition. The final volume of the sample mix was adjusted to 100 μl using 10 mm Tris/HCl, 100 mm NaCl, pH 7.4. The resulting mixtures were incubated at 30 °C for 20 min, and the reaction was stopped by adding 500 μl of ice-cold 10% (v/v) acetic acid. To quantify the amount of methyl ester groups transferred to McpS and McpT, the vapor-phase equilibrium procedure described by Campillo and Ashcroft (47) was used. Samples were washed 3 times with ice-cold 10% (v/v) acetic acid to remove the S-adenosyl-[methyl-3H]methionine that was not consumed during the reaction before a resuspension of the pellet in 200 μl of 1 n NaOH. The open tubes were then placed into a 7-ml liquid scintillation vial containing 2.4 ml of scintillation fluid. The vial was closed and incubated overnight at 37 °C without shaking. The recovery of [3H]methanol was quantified the following day in a scintillation counter.
Construction of P. putida CheR Mutants
The mutant in cheR1 (P. putida KT2440R-TK1038) was retrieved from the Pseudomonas Reference Culture Collection. These mutants were isolated after random mini-Tn5-Km mutagenesis as described in Duque et al. (48). The mini-Tn5 insertion was located at the cheR1 gene (PP1490). Mutants in cheR2 (PP4392) and cheR3 (PP3760) were constructed as follows; plasmid pCHESIΩKm is a pUC18 derivative containing the oriT origin of transfer of RP4 and the Ω-Km interposon of plasmid pHP45ΩKm (49). To generate cheR2 and cheR3 mutants, 400-bp fragments of the corresponding genes from P. putida KT2440R were amplified by PCR using primers PP3760F and PP760R as well as PP4392F and PP4390R, respectively (Table 2). The forward and reverse primers contained restriction sites for EcoRI and BamHI, respectively. PCR products were cloned into the EcoRI and BamHI sites of pCHESIΩKm in the same transcriptional direction as the Plac promoter. Resulting plasmids, pCHESI-3760 and pCHESI-4392, were mobilized from E. coli DH5α into P. putida KT2440R by electroporation. P. putida KT2440R bearing pCHESI-3760 and pCHESI-4392 plasmids in the host chromosome were selected on M9 minimal medium supplemented with 10 mm benzoic acid as the sole carbon source and 50 μg/ml kanamycin. A few Kmr clones were chosen for Southern blot and PCR analyses to confirm that pCHESI-3760 and pCHESI-4392 plasmids disrupted the desired genes. All of the clones analyzed contained an inactivated cheR2 or cheR3 gene, and the resulting strains P. putida KT2440R-ΔcheR2 and P. putida KT2440R-ΔcheR3 were used for further analyses.
Chemotaxis Assays; Swim Plate Motility Assays
Bacteria from single colonies grown overnight on LB agar plates were transferred with a toothpick to the center of swim agar plates (10% LB and 0.25% (w/v) agar). Plates were incubated overnight at 30 °C, and taxis was monitored the following day.
Plate Gradient Assays
Bacteria were grown overnight in MS medium supplemented with 10 mm succinate and diluted to an A600 of 0.8–1 with fresh minimal saline medium. Cells were then washed twice with MS medium by consecutive resuspension and centrifugation at 6000 rpm for 3 min. Square Petri dishes were filled with 50 ml of semisolid agar containing minimal MS medium, 10 mm glucose, and 0.25% (w/v) agar. Plates were cooled at room temperature for at least 0.5 h. At the vertical central line of the plate, 10-μl aliquots of chemoattractant solution dissolved in MS were placed at regular distances. Plates were incubated for 12–16 h at 4 °C to create a chemoattractant concentration gradient. Two-microliter aliquots of bacterial suspension were then placed horizontally to each of the chemoattractant spots with a distance of 3 cm to the vertical line. Plates were incubated at 30 °C for 16–20 h.
Biofilm Assays and Quantification of Crystal Violet-stained Attached Cells
Biofilm formation was examined using a borosilicate glass tube (hydrophilic surface) screening assay adapted from the method described by O'Toole et al. (50). Overnight P. putida cultures were diluted with fresh LB broth medium to an A600 of 0.05. 2-ml aliquots of each diluted culture were dispensed into three borosilicate glass tubes and incubated at room temperature under orbital shaking at 40 rpm for 4 h. Unattached cells were removed by rinsing the borosilicate glass tubes thoroughly with water, and attached cells were subsequently stained by incubation with 0.1% crystal violet at room temperature for 15 min. Subsequently, tubes were washed twice with water to remove any unbound stain. Crystal violet was then solubilized by the addition of 5 ml of 10% (v/v) glacial acetic acid, absorbance was measured at 600 nm before staining, and A600 of bacterial cultures (culture viable at A600) was determined to quantify plankton growth. Biofilm formation was then normalized with the corresponding cell density.
RESULTS
P. putida KT2440 Has 3 CheR Paralogues
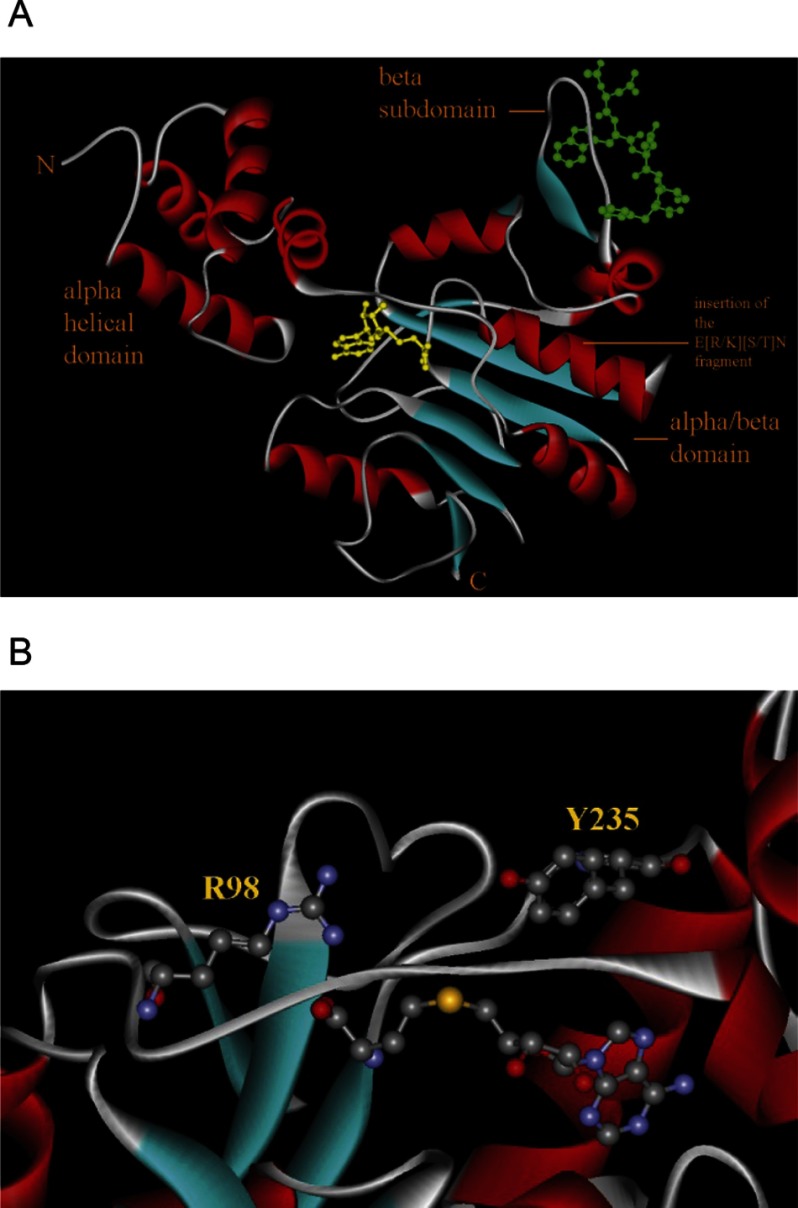
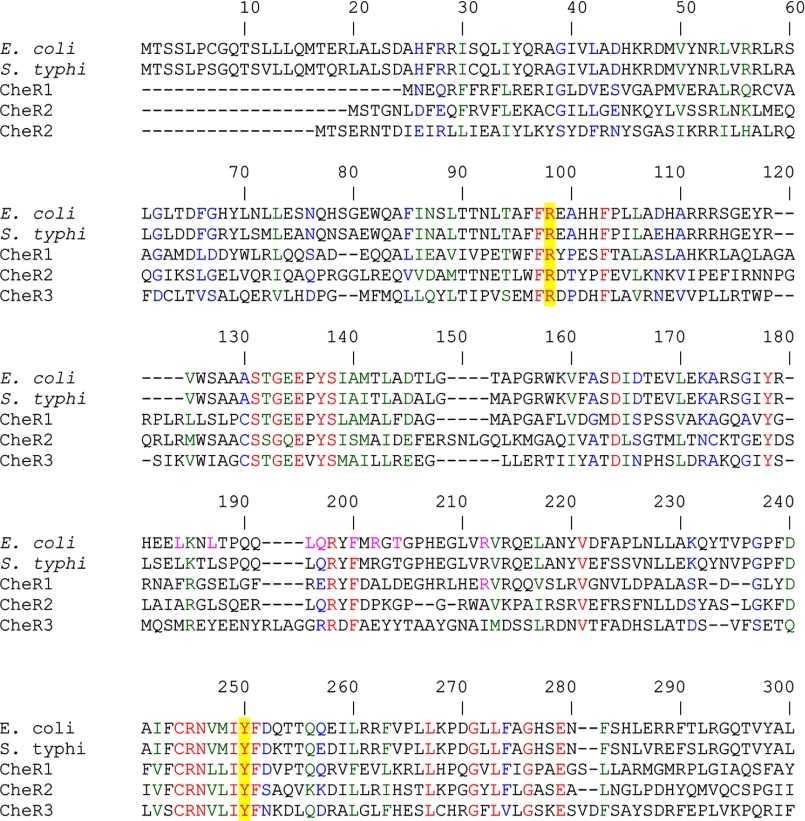
We have recently reported a study of CheR1 that is encoded by the ORF PP1490. This protein was found to correspond to a fusion of a methyltransferase with a tetratricopeptide repeat-containing binding domain (42). To identify further CheR paralogues, a BLAST search within the translated ORFs of P. putida KT2440 was conducted using the E. coli CheR sequence (P07364). Two other ORFs, PP4392 (renamed CheR2) and PP3760 (renamed CheR3), were detected which shared 23 and 27% protein sequence identity with the E. coli enzyme, respectively. Structural studies and site-directed mutagenesis data of the S. typhimurium CheR have suggested that Arg-98 and Tyr-235 are essential catalytic residues (Fig. 2) (18, 51, 52). The sequence alignment of the three P. putida paralogues with their homologues from E. coli and S. typhimurium (Fig. 3) revealed a sequence identity of only 8%. However, Arg-98 and Tyr-235 were among the conserved residues, which is consistent with the notion that these three paralogues are functional proteins.
FIGURE 2.
The three-dimensional structure of CheR from S. typhimurium (PDB code 1af7 (21)). A, shown is an overall structure. Bound SAH is shown in yellow, and the bound pentapeptide NWETF is in green. The three domains are indicated. The site of insertion of the E(R/K)T(S/T)N motif is highlighted. B, shown is a zoom of the active site. The (S/T)N fragment specific to CheR1 of P. aeruginosa and CheR2 of P. putida is highlighted. Bound SAH as well as catalytic residues Arg-98 and Tyr-235 are shown in ball-and-stick mode.
FIGURE 3.
Segment of sequence alignment of the 3 CheR paralogues from P. putida KT2440 with the CheR sequences form E. coli (P07364) and S. typhimurium (P07801). Sequences were aligned using ClustalW of the Network Protein Sequence Analysis. The GONNET protein weight matrix was used with a gap opening penalty of 10 and gap extension penalty of 1. Amino acids in red indicate identity, in blue indicate high similarity, and in green indicate low similarity. The amino acids that are involved in catalysis are shaded in yellow. The amino acids corresponding to the amino acids Arg-98 and Tyr-235 in S. typhimurium CheR are shaded in yellow.
Large Differences of the Three CheR Paralogues in the Ratio of Affinities for SAH and SAM
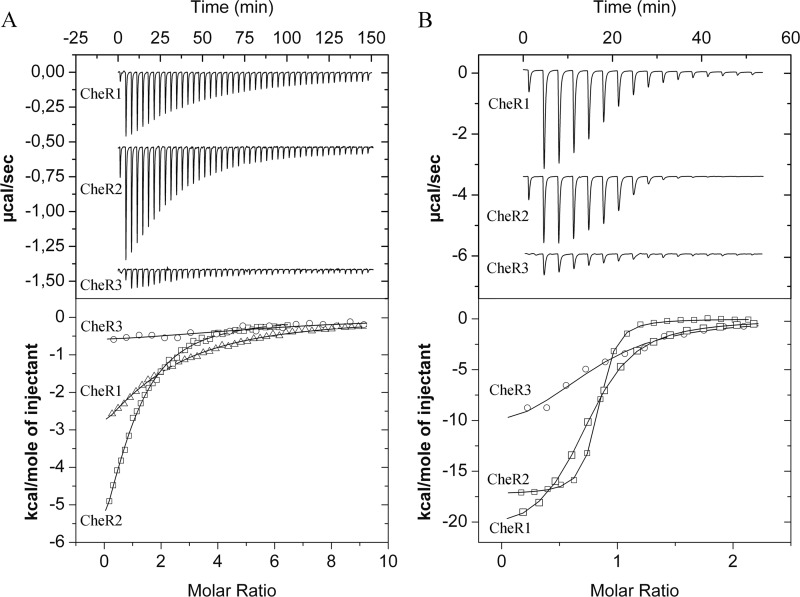
The cheR genes were cloned into an expression vector, proteins expressed in E. coli and purified from the soluble fraction of cell lysates. The methyltransferase proteins were subsequently submitted to isothermal titration calorimetry (53) studies with SAM and SAH. The resulting thermograms are shown in Fig. 4, and the derived thermodynamic data are provided in Table 3. Dissociation constants of ∼22 μm were obtained for the SAM binding to CheR2 and CheR3. In contrast, SAM bound with significantly weaker affinity (KD = 43 μm) to CheR3. The n values determined (Table 3) were in the range between 0.95 and 1.61 but were less reliable due to the reduced c-value of these experiments (54). In contrast to the hyperbolic titration curves for SAM, sigmoidal curves were obtained for SAH titrations, indicating higher affinities. In all cases SAH bound with much higher affinity to the CheRs than the substrate SAM. Very tight binding was observed for CheR2 for which a KD of 140 nm was determined. SAH was found to bind with similar affinities to CheR1 (KD = 1.7 μm) and CheR3 (KD = 2.2 μm). Due to more elevated c-values, the enthalpic and entropic contributions to binding could be determined precisely. In all three cases, binding was driven by very favorable enthalpy changes and counterbalanced by unfavorable entropy changes. The n values were between 0.72 and 0.78 and are in all cases inferior to the expected value of 1 indicative of a 1:1 binding stoichiometry. All proteins analyzed had a purity superior to 95%, and these differences in stoichiometry may have been caused by the presence of unfolded protein. Data thus show that SAH binds much tighter to the three paralogues than SAM, indicative of product feedback inhibition. However, significant differences were observed in the magnitudes of feedback inhibition. The ratios of KD SAM:KD SAH are provided in Table 3. In the case of CheR2 this value is of 165, whereas it is only 25 and 10 for CheR1 and CheR2, respectively. This implies that there is a window in which alterations of the SAH concentration modulate the activity of CheR2 without affecting in a significant manner CheR1 and CheR3 activity.
FIGURE 4.
Microcalorimetric titrations of the three CheR paralogues with of SAM and SAH. A, titration of the three CheR proteins with SAM is shown. B, titration of the three CheR paralogues with SAH is shown. The upper panels show titration raw data. The protein concentration used was between 16 and 28 μm, and the ligand concentration was either 0.5 or 1 mm. A titration consisted of an initial injection of 1.6 μl followed by a series of 3.2- or 6.4-μl injections. For reasons of clarity, data have been offset on the y axis. Lower panel, shown are integrated, dilution-corrected, and concentration-normalized titration raw data, which were fitted using the one binding site model of the ORIGIN version from MicroCal.
TABLE 3.
Thermodynamic parameters for the binding of S-adenosylmethionine (SAM) and S-adenosylhomocysteine (SAH) to the three CheR paralogues of P. putida KT2440
The microcalorimetric titration data are shown in Fig. 4. Data for CheR1 have been reported previously (42) and are shown as a reference.
| Protein | Ligand | na | KD | KA | ΔHa | TΔSa | Ligand | n | KD | KA | ΔH | TΔS | KD SAM/KD SAH |
|---|---|---|---|---|---|---|---|---|---|---|---|---|---|
| μm | m−1 | kcal/mol | kcal/mol | μm | m−1 | kcal/mol | kcal/mol | ||||||
| CheR1 | SAM | 1.58 | 43 ± 2 | (2.3 ± 0.1) 104 | −7.4 ± 0.6 | −1.5 ± 0.6 | SAH | 0.72 | 1.7 ± 0.1 | (5.9 ± 0.1) 105 | −21.7 ± 0.1 | −13.8 ± 0.1 | 25 |
| CheR2 | SAM | 0.95 | 22.8 ± 1 | (4.38 ± 0.2) 104 | −10.2 ± 0.5 | −3.9 ± 0.5 | SAH | 0.78 | 0.14 ± 0.01 | (7.1 ± 0.3) 106 | −17.3 ± 0.1 | −7.5 ± 0.1 | 165 |
| CheR3 | SAM | 1.61 | 22.3 ± 1 | (4.48 ± 0.1) 104 | −0.8 ± 0.1 | 5.5 ± 0.2 | SAH | 0.75 | 2.2 ± 0.2 | (4.6 ± 0.5) 105 | −12.7 ± 0.6 | −4.9 ± 0.6 | 10 |
a Caution in the interpretation of the n values as well as the enthalpy and entropy changes for SAM binding is advised as the products of protein concentration and KA (c value) are low (in the range of 0.37–1.25; see Ref. 54.
The Three CheR Paralogues Do Not Bind the NWETF Pentapeptide
The CheRs of E. coli and S. typhimurium recognize the NWETF pentapeptide, which form the C-terminal extensions of the high abundance chemoreceptors in these species (21, 52). Although P. putida lacks chemoreceptors with C-terminal pentapeptides, we wanted to establish whether the three CheR paralogues of P. putida have maintained the capacity to recognize this pentapeptide. The three proteins at a concentration of 30 μm were titrated with aliquots of 1 mm NWETF pentapeptide. Experiments were conducted at 25 and 15 °C, but in all cases an absence of binding was noted, which indicates that this pentapeptide is not recognized by any of the 3 CheRs.
The 3 CheR Paralogues Unfold Cooperatively in a Single Event
The CheR of S. typhimurium is composed of three structural domains (21). CheR2 and CheR3, which are similar in size, are likely to possess the same domain architecture. CheR1 contains an additional 150-amino acid C-terminal extension harboring a tetratricopeptide binding domain (42). DSC studies can provide insight into domain interaction. Using this technique a temperature gradient is applied to the purified protein, and heats resulting from the thermal protein unfolding (endothermic) are recorded. The DSC thermograms of these three paralogues (Fig. 5) reveal a single peak indicative that all proteins unfold cooperatively in a single event, which may suggest functional interdomain communication. Unfolding occurs over a similar temperature range as shown by Tm values between 44 and 49 °C (Table 4). The enthalpy change associated with the CheR3 unfolding was significantly below that of the remaining two proteins, which may be potentially due to an amorphous aggregation. The addition of 1 mm SAM to the proteins resulted in a modest increase in thermal stability of 2.4–3.1 °C. The SAH-mediated stabilization was much more pronounced as shown by Tm increases of 5.7–8.4 °C (Fig. 5, Table 4).
FIGURE 5.
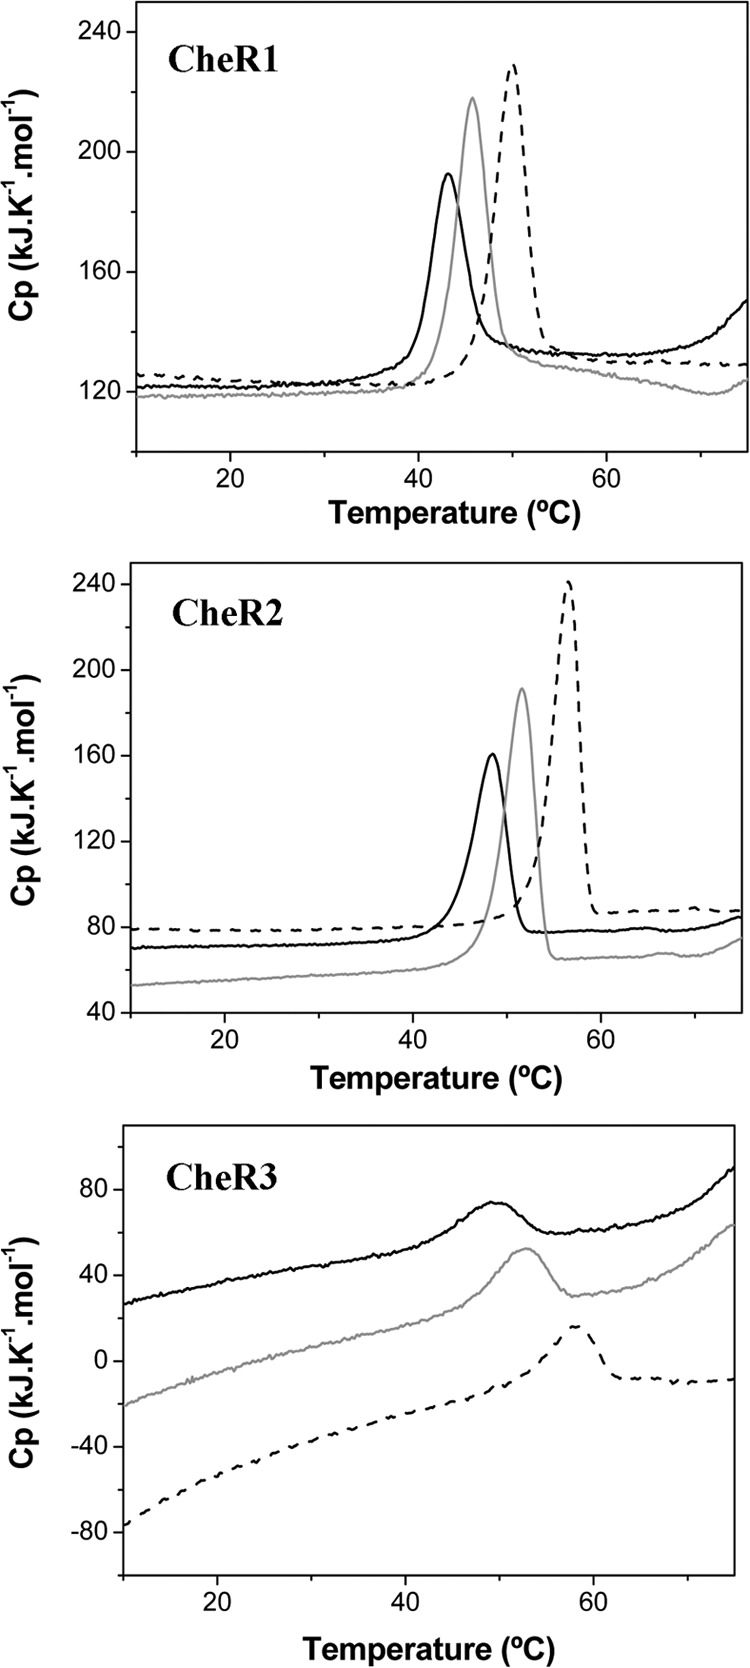
Analysis of the three CheR paralogues by DSC. CheR1 and CheR2 were at a concentration of 1 mg/ml, whereas CheR3 was at 0.5 mg/ml. SAM and SAH were added at a concentration of 1 mm. The derived parameters ΔH (enthalpy change of protein unfolding) and Tm (midpoint of protein unfolding transition) are given in Table 4. Black line, protein without ligand; gray line, protein with SAM; dotted line, protein with SAH. Cp, heat capacity.
TABLE 4.
Thermodynamic parameters for the thermal unfolding of the three CheR paralogues of P. putida KT2440 as determined by differential scanning calorimetry (see Fig. 5)
| Protein | Tm | ΔH |
|---|---|---|
| °C | kcal/mol | |
| CheR1 | 44.03 | 57,8 |
| CheR1 + SAM | 46.46 | 107,1 |
| CheR1 + SAH | 49.74 | 74,0 |
| CheR2 | 48.27 | 94,2 |
| CheR2 + SAM | 51.04 | 94,5 |
| CheR2 + SAH | 56.02 | 104,2 |
| CheR3 | 49.01 | 22,8 |
| CheR3 + SAM | 52.13 | 90,4 |
| CheR3 + SAH | 57.42 | 54,7 |
The McpS and McpT Chemoreceptors Are Exclusively Methylated by CheR2
The McpS and McpT chemoreceptors of P. putida mediate chemotaxis toward Krebs cycle intermediates (39–41) and aromatic hydrocarbons (38), respectively. To determine which of the three CheR methylates these chemoreceptors, the coding sequence of both chemoreceptor genes were cloned into an expression vector. Both chemoreceptors were expressed in E. coli, and membranes enriched in each of these proteins were prepared. In parallel, mock membranes were prepared using the same experimental procedure except that E. coli cells were transformed with the empty expression plasmid. A SDS-PAGE analysis of these membranes showed the overexpression of both receptors. The methylation assay mix also contained an extract of soluble proteins from P. putida KT2440 that contained the enzymes necessary to degrade SAH, as the above results have shown that SAH binds preferentially to the CheR proteins.
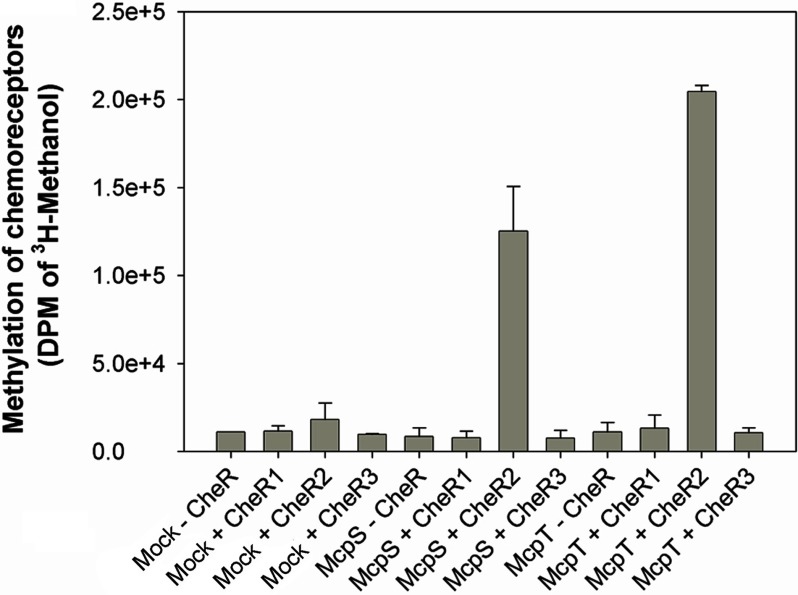
The initial experiments consisted of the analysis of methylation activity in mock membranes in the absence and presence of added CheR. As shown in the first four columns of Fig. 6 the methylation activity of mock membranes in the absence and presence of added CheR was similar. Subsequently, methylation of McpS- and McpT-containing membranes in the absence of CheR was measured (Fig. 6). These activities were comparable with the experiments with mock membranes indicating that methylation of both chemoreceptors by proteins present in the soluble extract of Pseudomonas proteins is negligible. The third series of experiments involved the evaluation of McpS and McpT methylation by the purified CheR paralogues. A significant methylation of both chemoreceptors was observed by CheR2, whereas the corresponding measurements in the presence of CheR1 and CheR3 were comparable to the control experiments (Fig. 6). These experiments indicate that CheR2 exclusively methylates both chemoreceptors. These data also show that CheR2 can methylate a chemoreceptor derived from the same bacterial strain, McpS, but can also methylate a chemoreceptor, McpT, that is derived from a different strain (P. putida DOT-T1E).
FIGURE 6.
Methylation of the McpS and McpT chemoreceptors using the three purified CheR paralogues. E. coli membranes enriched in McpS and McpT were prepared as described under “Experimental Procedures.” Mock corresponds to experiments where the McpS- and McpT-containing membranes are replaced by membranes generated from E. coli transformed with the empty expression plasmid. The assay mix also contained an extract of soluble proteins of P. putida KT2440, which contains the enzymes necessary to assure the metabolization of SAH. Purified CheR paralogues were added at a final concentration of 4 μm. DPM, disintegrations per min.
CheR2 Is Monomeric in Solution
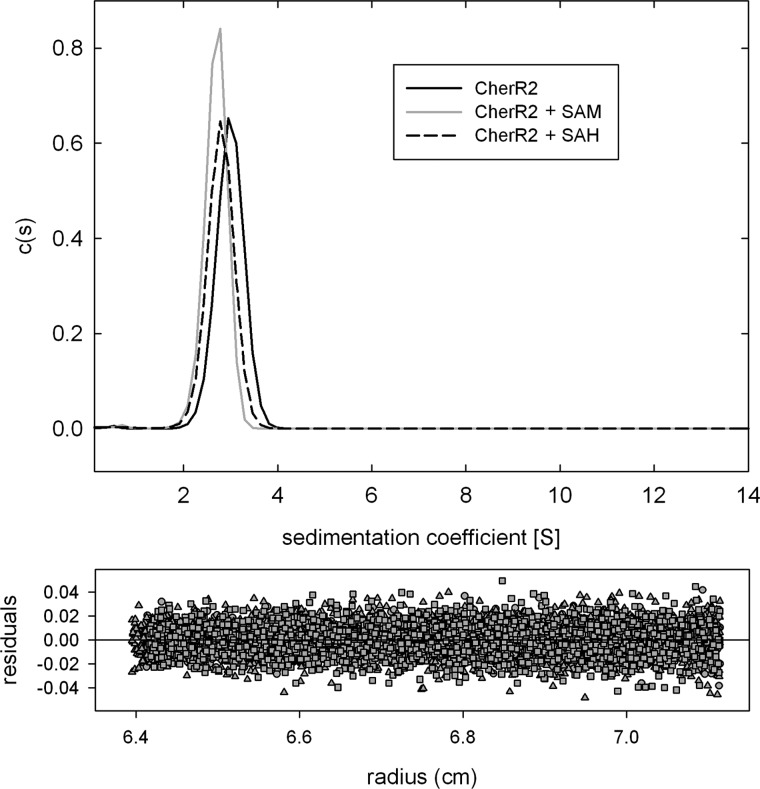
Based on the central role of CheR2 in the methylation of McpS and McpT chemoreceptors, we used analytical ultracentrifugation techniques to assess its oligomeric state. Sedimentation velocity studies of CheR2 over the concentration range of 0.25–1.0 mg/ml showed a single peak at 2.5 S in the sedimentation coefficient distribution (Fig. 7), indicative of a monomeric state. Subsequently sedimentation experiments of CheR2 at 1 mg/ml were repeated in the presence of 1 mm SAM or SAH. As shown in Fig. 7 the addition of both ligands did not result in any significant increase in the sedimentation coefficient, indicating that the addition of both compounds does not alter its oligomeric state. CheR2 at a concentration of 0.5 mg/ml was then analyzed by sedimentation equilibrium ultracentrifugation. Data analyses revealed a mass of 38 600 ± 600 Da, which is close to the sequence-derived masses of 32,247 Da, confirming the monomeric state of the protein.
FIGURE 7.
Analyses of CheR2 by sedimentation velocity ultracentrifugation. Protein concentration was of 1 mg/ml. SAM and SAH were added at a concentrations 1 mm. The upper panel shows the sedimentation coefficient distributions c(s), and the lower panel shows the residuals of curve-fitting.
Only CheR2 Is Essential for Chemotaxis
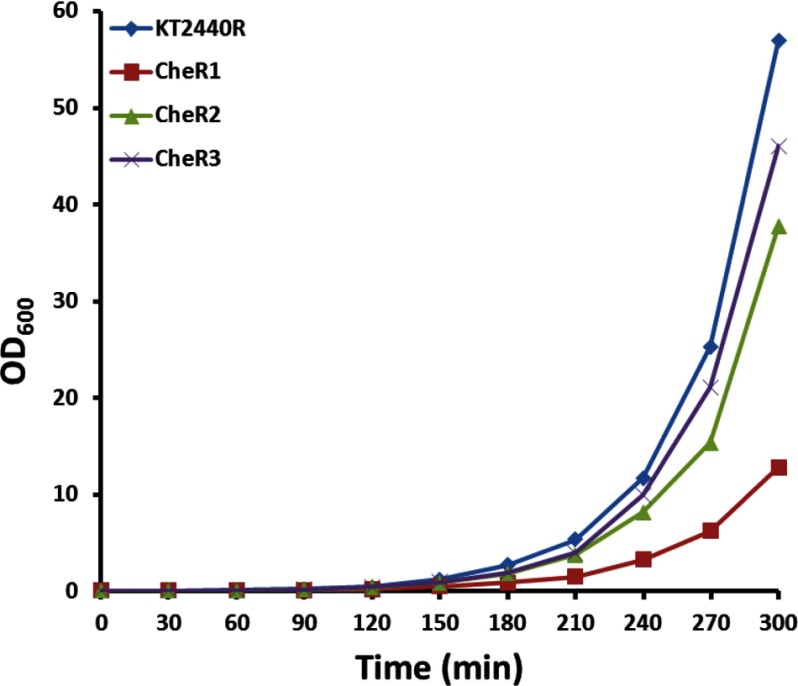
To study the contribution of the CheR paralogues in mediating chemotaxis, the corresponding bacterial mutant strains were constructed and analyzed. Microscopic inspection of wild type and mutant strains indicated a similar degree of motility. Initial experiments were carried out to study the bacterial growth of mutant and wild types strains. As shown in Fig. 8 the growth kinetics of the CheR2 and CheR3 mutants were comparable with that of the wild type strain, whereas mutant CheR1 grew somewhat slower. The primary physiological reason for chemotaxis resides in the capacity to approach compounds that serve as the carbon or energy source. To assess the general contribution of the three CheR paralogues in chemotaxis toward growth substrates, soft agar swim plate chemotaxis assays were carried out. In this assay cells are placed into the center of a soft agar LB plate, and the size of halo formation is a measure of chemotaxis. After overnight incubation, a large halo that almost reached the border of the Petri dish was observed for the wild type strain (Fig. 9), and a similar halo was observed for the CheR3 mutant. The halo of the CheR1 mutant was slightly reduced in size, whereas that of the CheR2 mutant was dramatically reduced.
FIGURE 8.
Growth properties of wild type and mutant P. putida KT2440R. Cultures of KT2440R (wild type), TK1038 (ΔcheR1), TK1117 (ΔcheR2), and TK1116 (ΔcheR3) were grown at 30 °C with agitation (200 rpm) in Luria broth. Every 30 min, the A600 values were measured, cultures were diluted with fresh prewarmed medium, and the culture was continued. This procedure enabled measurements in the linear range of 0.1–0.5 A600. All A600 values were corrected with the appropriate dilution factor.
FIGURE 9.
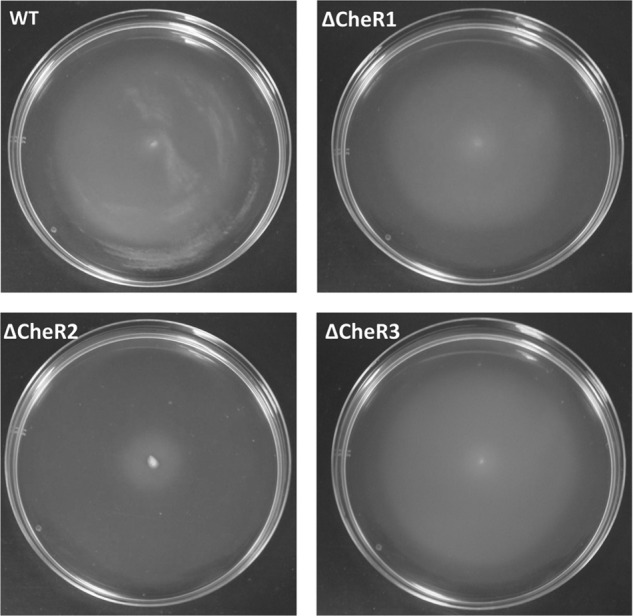
Chemotaxis of wild type and mutant P. putida KT2440R cells toward LB medium. Shown are soft agar swim plate chemotaxis assays of wild type and mutant strains of P. putida KT2440. The center of soft agar swim plates containing LB medium is inoculated with bacteria. Plates were incubated at 30 °C overnight and inspected the following day.
Subsequently, chemotaxis toward specific chemoattractants, casamino acids and malate, was measured. We previously identified McpS as the sole malate receptor of this strain (39). Plate gradient assays were conducted in which chemoattractant aliquots were placed on a vertical line in the middle of the plate (Fig. 10) followed by an overnight incubation to permit gradient formation. Aliquots of bacterial cultures were then deposited on each side of the chemoattractant. The CheR2 mutant was found to be deficient in chemotaxis toward malate and casamino acids, whereas taxis of the CheR3 mutant was comparable with the wild type (Fig. 10). For both chemoattractants, taxis of the CheR1 mutant was slightly reduced, which may be a consequence of its delayed growth. These results agree with the swim plate assays reported above.
FIGURE 10.
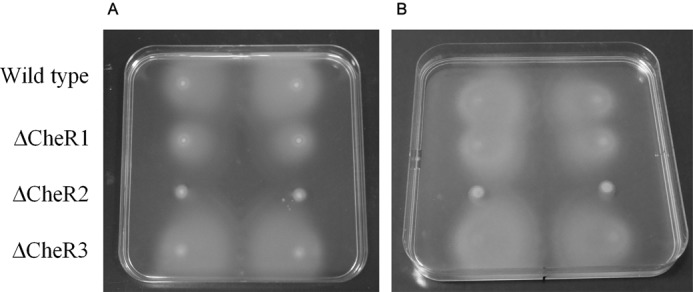
Chemotaxis wild type and mutant P. putida KT2440R toward casamino acids (A) and malate (B). Shown are plate gradient assays. 10-μl aliquots of a 10% (w/v) of casamino acids (A) or 10 mm malate (B) were placed on the vertical line in the middle of the plate. Plates were incubated at 4 °C for 12–16 h for the generation of a concentration gradient. Two-microliter aliquots of bacterial suspension were then placed on both sides of the central vertical line. Images were taken after incubation at 30 °C for 16–20 h. Shown are duplicate experiments.
CheR1 Is Essential for Efficient Biofilm Formation
The capacity of wild type and mutant strains to form biofilms was analyzed. As shown in Fig. 11A biofilm formation on borosilicate tubes of the CheR2 and CheR3 mutants was comparable with the wild type strain, whereas that of the CheR1 mutant was significantly reduced. Because growth of the CheR1 was slightly slower than the wild type (Fig. 8), biofilm formation was quantified and normalized using the cell density of the bacterial supernatant. The resulting values are presented in Fig. 11B and show that mutation of CheR1 reduces biofilm formation to around half that observed for the wild type and the CheR2 and CheR3 mutants.
FIGURE 11.
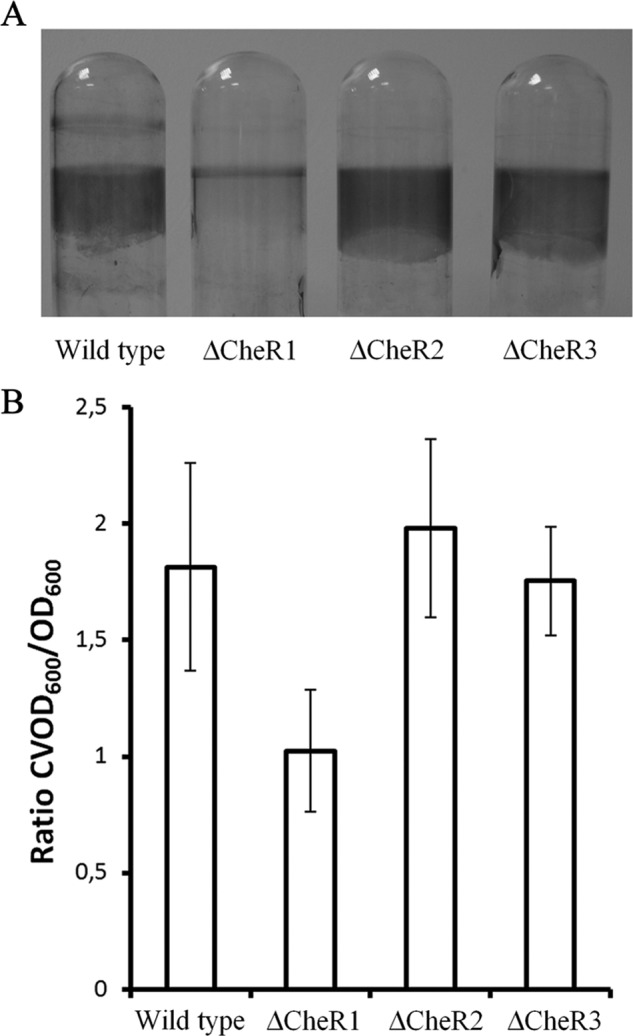
Influence of the mutation of CheR paralogues on the capacity of P. putida KT2440R to form biofilms. A, shown is visualization of biofilm formation of wild type and mutant strains of P. putida KT2440. Shown are stained borosilicate tubes after 4 h of growth. B, shown is quantification of biofilm formation of the above strains on borosilicate tubes after 4 h of growth using the crystal violet test. Shown is the ratio of A600, obtained after crystal violet staining of attached cells, to culture viable A600, representing the optical density of the cultures after 4 h growth. Data are the means and S.E., derived from three independent experiments with triplicate tubes incubated per experiment (the means of triplicate experiments were calculated, and the data presented are averages of the resulting three means derived from three independent experiments).
DISCUSSION
CheR methyltransferases are among the core proteins of chemosensory pathways and, therefore, are of general importance for their proper functioning (3). Many bacteria have multiple sets of chemosensory signaling proteins that arrange into different pathways. Here we present a comparative study of the three CheR paralogues from P. putida KT2440. A major finding of this work resides in the demonstration that exclusively CheR2 methylates two chemotaxis receptors, whereas the remaining two paralogues have no methylation activity on these receptors. These results are underlined by the general chemotaxis defect of the CheR2 mutant, whereas the remaining mutants showed chemotaxis comparable to the wild type. The presence of three CheR paralogues suggests the existence of three different chemosensory pathways, and signal recognition for each pathway is achieved by dedicated chemoreceptors. Our data suggest that CheR methyltransferases have evolved to recognize and methylate their cognate chemoreceptors with high specificity.
The specificity of action of CheR paralogues is also illustrated by the reduction of biofilm formation in the CheR1 mutant, whereas the other two mutants showed a biofilm phenotype comparable with that of the wild type strain. The gene cluster containing cheR1 is homologous to the wsp cluster in P. aeruginosa (31). The output of the wsp pathway consists of the modulation of cyclic diguanylate concentration, which in turn regulates biofilm formation. CheR1 is thus a homologue of the WspC methyltransferase of the wsp pathway. It was shown previously that mutation of WspC abolishes pathway signal transduction (55), and its overexpression causes changes in cell morphology (56). Here we show that the mutation of the WspC homologue in P. putida reduces biofilm formation, which is consistent with the above findings. The chP chemosensory pathway of P. aeruginosa was found to mediate type IV pili-based motility (32–34). To assess whether CheR3 may potentially be involved in mediating this type of motility, we have thus studied the twitching motility of P. putida KT2440. Despite numerous attempts and the exploration of many different experimental conditions, only a minor and little reproducible twitching motility was observed, which did not permit to analyze the effect of CheR mutation on this phenotype.
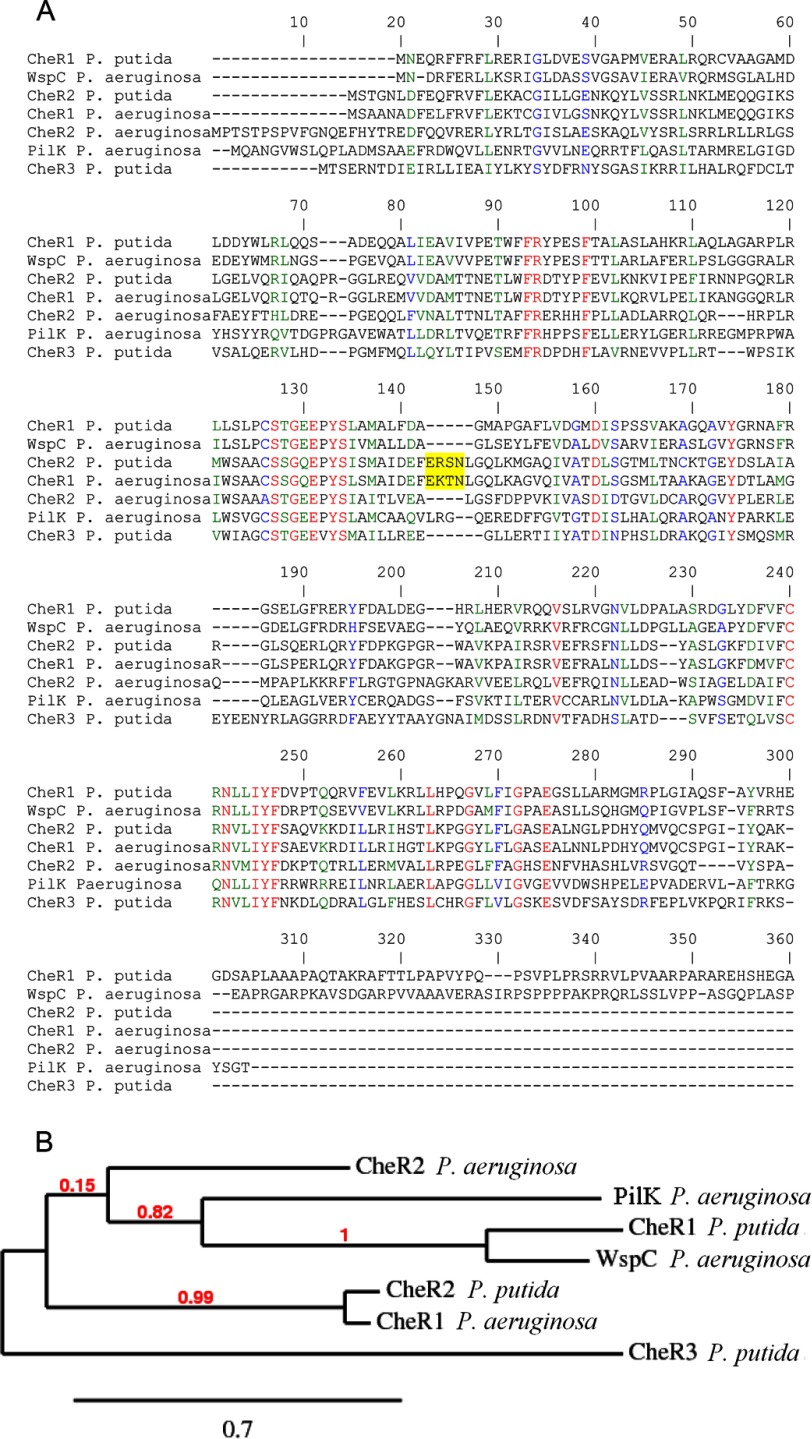
P. aeruginosa and P. putida have thus, in total, seven CheR proteins. To establish their relationship, a sequence alignment and clustering analysis was made (Fig. 12). Interestingly, WspC of P. aeruginosa paired up with P. putida CheR1, and CheR2 of P. putida was closely related to CheR1 of P. aeruginosa. As discussed above, the former two proteins were part of pathways that modulate biofilm formation, whereas the latter two proteins were both involved in chemotaxis pathways, as CheR1 of P. aeruginosa forms part of the che chemotaxis pathway (28–30), and CheR2 of P. putida was shown here to be essential for chemotaxis. The data thus demonstrate that similarities in CheR function of related bacterial species are reflected in sequence similarities, which may be useful for the annotation of homologues from other strains. In the clustering analysis (Fig. 12) CheR3 of P. putida as well as CheR2 and PilK of P. aeruginosa do not have equivalents. A difference in the chemosensory pathways of both species may be the presence of two chemotaxis pathways in P. aeruginosa, whereas there appears to be a single chemotaxis pathway in P. putida. The sequence alignment of these seven sequences (Fig. 12) shows that CheR1 of P. aeruginosa and CheR2 of P. putida, both involved in chemotaxis, have a sequence insert with the consensus sequence E(R/K)(S/T)N. This sequence insert is located on a helix close to the pentapeptide binding site (Fig. 2A) and may, therefore, be part of the interaction interface with the chemoreceptor. It may be plausible that this motif plays a role in mediating the specificity in the CheR-chemoreceptor interaction. This cluster analysis thus shows that it is possible to predict CheR function by sequence alignments with characterized proteins.
FIGURE 12.
Sequence similarities between CheR paralogues from P. putida KT2440 and P. aeruginosa PAO1. A, shown is a segment of sequence alignment of CheR proteins from P. putida and P. aeruginosa. The accession codes of these proteins are: CheR1 P. putida, PP1490; WspC P. aeruginosa, PA3706; CheR2 P. putida, PP4392; CheR1 P. aeruginosa, PA3348; CheR2 P. aeruginosa, PA0175; PilK P. aeruginosa, PA0412; CheR3 P. putida, PP3760. The sequence insert specific to CheR1 of P. aeruginosa and CheR2 of P. putida is shaded in yellow. B, shown is sequence clustering of CheR paralogues of P. aeruginosa and P. putida. The tree was constructed using the Phylogeny.fr server (61) using default settings.
The CheR of S. typhimurium is characterized by product feedback inhibition, as SAH binds tighter to CheR than the substrate SAM (18). Using isothermal titration calorimetry we determined SAM/SAH binding affinities, and data show that all three proteins recognize SAH with higher affinity than SAM, suggesting that product feedback inhibition is a general feature of this protein family. The affinities of SAM for the Pseudomonas proteins were between 22 and 43 μm, which are similar to the analogous values for the S. typhimurium enzyme of 17 μm (20) and a 11 μm (18).
There were significant differences in the affinities of the three paralogues for SAH, as CheR1 and CheR3 showed KD values of ∼2 μm, whereas much tighter binding was observed for CheR2, with a KD of 0.14 μm. However, this value is very similar to the SAH binding to the S. typhimurium CheR with a KD of 0.22 μm (19). Both CheR from S. typhimurium and P. putida CheR2 are involved in chemotaxis. One could thus hypothesize that methyltransferases involved in chemotaxis show tight SAH binding, whereas enzymes involved in other pathways may show lower affinity SAH binding. These differences in affinities among the Pseudomonas proteins may have functional consequences as they imply that there is a window in which alterations of the SAH concentration modulate the activity of CheR2 but leave that of CheR1 and CheR3 unchanged. Future work will be necessary to verify this hypothesis.
Differential scanning calorimetry studies showed a single thermal unfolding event indicative of a cooperative unfolding of all domains of the three CheR paralogues. DSC studies of other proteins have revealed in a number of cases that cooperative domain unfolding reflects functional interdomain cross-talk (57–59). Data thus suggest functional interdomain interaction in CheR. Gel filtration studies have suggested that CheR of S. typhimurium is a monomeric protein (20). The sedimentation velocity and sedimentation equilibrium studies of CheR2 at different concentrations have clearly shown that this protein is monomeric and that the binding of SAM and SAH does not alter the oligomeric state of the protein. These data thus indicate that a monomeric state is a general property of CheR methyltransferases.
Another interesting finding resides in the demonstration that CheR2 methylates the McpS and McpT chemoreceptors with the same efficiency. McpS is encoded by the genome of P. putida KT2440, whereas McpT is a plasmid encoded receptor present in the strain P. putida DOT-T1E (60). The McpT receptor is of biotechnological relevance because it is responsible for the hyperchemotaxis phenotype toward aromatic toxic hydrocarbons such as toluene (38). It has been shown that there is a link between the degradation of aromatic hydrocarbons and chemotaxis toward these compounds. There are a number of examples demonstrating that chemotaxis toward aromatic hydrocarbons enhances their degradation rate (for review, see Ref. 37). We have shown previously that the transfer of the mcpT gene to other species confers chemotaxis toward aromatic compounds, suggesting the establishment of functional signaling complexes between McpT and host proteins (38). The demonstration of efficient methylation of McpT by a foreign CheR methyltransferase is consistent with this suggestion and offers the possibility of “chemotactic engineering” of related strains by the transfer of chemoreceptor genes.
This work was supported by FEDER funds and Fondo Social Europeo through Junta de Andalucía Grants P09-RNM-4509 and CVI-7335 (to T. K.) and Spanish Ministry for Economy and Competitiveness Grants Bio2010-16937 (to T. K.) and BIO2010-17227 (to J. L. R.).
- SAM
- S-adenosylmethionine
- SAH
- S-adenosylhomocysteine
- DSC
- differential scanning calorimetry.
REFERENCES
- 1. Galperin M. Y. (2005) A census of membrane-bound and intracellular signal transduction proteins in bacteria. Bacterial IQ, extroverts, and introverts. BMC Microbiol. 5, 35. [DOI] [PMC free article] [PubMed] [Google Scholar]
- 2. Ulrich L. E., Koonin E. V., Zhulin I. B. (2005) One-component systems dominate signal transduction in prokaryotes. Trends Microbiol. 13, 52–56 [DOI] [PMC free article] [PubMed] [Google Scholar]
- 3. Wuichet K., Zhulin I. B. (2010) Origins and diversification of a complex signal transduction system in prokaryotes. Sci. Signal 3, ra50. [DOI] [PMC free article] [PubMed] [Google Scholar]
- 4. Sourjik V., Wingreen N. S. (2012) Responding to chemical gradients. Bacterial chemotaxis. Curr. Opin. Cell Biol. 24, 262–268 [DOI] [PMC free article] [PubMed] [Google Scholar]
- 5. Hazelbauer G. L., Falke J. J., Parkinson J. S. (2008) Bacterial chemoreceptors. High-performance signaling in networked arrays. Trends Biochem. Sci. 33, 9–19 [DOI] [PMC free article] [PubMed] [Google Scholar]
- 6. Yuan J., Branch R. W., Hosu B. G., Berg H. C. (2012) Adaptation at the output of the chemotaxis signalling pathway. Nature 484, 233–236 [DOI] [PMC free article] [PubMed] [Google Scholar]
- 7. Min T. L., Mears P. J., Golding I., Chemla Y. R. (2012) Chemotactic adaptation kinetics of individual Escherichia coli cells. Proc. Natl. Acad. Sci. U.S.A. 109, 9869–9874 [DOI] [PMC free article] [PubMed] [Google Scholar]
- 8. Lazova M. D., Ahmed T., Bellomo D., Stocker R., Shimizu T. S. (2011) Response rescaling in bacterial chemotaxis. Proc. Natl. Acad. Sci. U.S.A. 108, 13870–13875 [DOI] [PMC free article] [PubMed] [Google Scholar]
- 9. Vladimirov N., Sourjik V. (2009) Chemotaxis. How bacteria use memory. Biol. Chem. 390, 1097–1104 [DOI] [PubMed] [Google Scholar]
- 10. Stock J. B., Maderis A. M., Koshland D. E., Jr. (1981) Bacterial chemotaxis in the absence of receptor carboxylmethylation. Cell 27, 37–44 [DOI] [PubMed] [Google Scholar]
- 11. Wong L. S., Johnson M. S., Zhulin I. B., Taylor B. L. (1995) Role of methylation in aerotaxis in Bacillus subtilis. J. Bacteriol. 177, 3985–3991 [DOI] [PMC free article] [PubMed] [Google Scholar]
- 12. Stephens B. B., Loar S. N., Alexandre G. (2006) Role of CheB and CheR in the complex chemotactic and aerotactic pathway of Azospirillum brasilense. J. Bacteriol. 188, 4759–4768 [DOI] [PMC free article] [PubMed] [Google Scholar]
- 13. Kanungpean D., Kakuda T., Takai S. (2011) Participation of CheR and CheB in the chemosensory response of Campylobacter jejuni. Microbiology 157, 1279–1289 [DOI] [PubMed] [Google Scholar]
- 14. Ely B., Gerardot C. J., Fleming D. L., Gomes S. L., Frederikse P., Shapiro L. (1986) General nonchemotactic mutants of Caulobacter crescentus. Genetics 114, 717–730 [DOI] [PMC free article] [PubMed] [Google Scholar]
- 15. Borkovich K. A., Alex L. A., Simon M. I. (1992) Attenuation of sensory receptor signaling by covalent modification. Proc. Natl. Acad. Sci. U.S.A. 89, 6756–6760 [DOI] [PMC free article] [PubMed] [Google Scholar]
- 16. Terwilliger T. C., Koshland D. E., Jr. (1984) Sites of methyl esterification and deamination on the aspartate receptor involved in chemotaxis. J. Biol. Chem. 259, 7719–7725 [PubMed] [Google Scholar]
- 17. Li G., Weis R. M. (2000) Covalent modification regulates ligand binding to receptor complexes in the chemosensory system of Escherichia coli. Cell 100, 357–365 [DOI] [PubMed] [Google Scholar]
- 18. Simms S. A., Subbaramaiah K. (1991) The kinetic mechanism of S-adenosyl-l-methionine. Glutamylmethyltransferase from Salmonella typhimurium. J. Biol. Chem. 266, 12741–12746 [PubMed] [Google Scholar]
- 19. Yi X., Weis R. M. (2002) The receptor docking segment and S-adenosyl-l-homocysteine bind independently to the methyltransferase of bacterial chemotaxis. Biochim. Biophys. Acta 1596, 28–35 [DOI] [PubMed] [Google Scholar]
- 20. Simms S. A., Stock A. M., Stock J. B. (1987) Purification and characterization of the S-adenosylmethionine:glutamyl methyltransferase that modifies membrane chemoreceptor proteins in bacteria. J. Biol. Chem. 262, 8537–8543 [PubMed] [Google Scholar]
- 21. Djordjevic S., Stock A. M. (1998) Chemotaxis receptor recognition by protein methyltransferase CheR. Nat. Struct. Biol. 5, 446–450 [DOI] [PubMed] [Google Scholar]
- 22. Muppirala U. K., Desensi S., Lybrand T. P., Hazelbauer G. L., Li Z. (2009) Molecular modeling of flexible arm-mediated interactions between bacterial chemoreceptors and their modification enzyme. Protein Sci. 18, 1702–1714 [DOI] [PMC free article] [PubMed] [Google Scholar]
- 23. Krell T., Lacal J., Muñoz-Martínez F., Reyes-Darias J. A., Cadirci B. H., García-Fontana C., Ramos J. L. (2011) Diversity at its best. Bacterial taxis. Environ. Microbiol. 13, 1115–1124 [DOI] [PubMed] [Google Scholar]
- 24. Hamer R., Chen P. Y., Armitage J. P., Reinert G., Deane C. M. (2010) Deciphering chemotaxis pathways using cross species comparisons. BMC Syst. Biol. 4, 3. [DOI] [PMC free article] [PubMed] [Google Scholar]
- 25. Lacal J., García-Fontana C., Muñoz-Martínez F., Ramos J. L., Krell T. (2010) Sensing of environmental signals. Classification of chemoreceptors according to the size of their ligand binding regions. Environ. Microbiol. 12, 2873–2884 [DOI] [PubMed] [Google Scholar]
- 26. Zhulin I. B. (2001) The superfamily of chemotaxis transducers. From physiology to genomics and back. Adv. Microb. Physiol. 45, 157–198 [DOI] [PubMed] [Google Scholar]
- 27. Le Moual H., Koshland D. E., Jr. (1996) Molecular evolution of the C-terminal cytoplasmic domain of a superfamily of bacterial receptors involved in taxis. J. Mol. Biol. 261, 568–585 [DOI] [PubMed] [Google Scholar]
- 28. Ferrández A., Hawkins A. C., Summerfield D. T., Harwood C. S. (2002) Cluster II che genes from Pseudomonas aeruginosa are required for an optimal chemotactic response. J. Bacteriol. 184, 4374–4383 [DOI] [PMC free article] [PubMed] [Google Scholar]
- 29. Masduki A., Nakamura J., Ohga T., Umezaki R., Kato J., Ohtake H. (1995) Isolation and characterization of chemotaxis mutants and genes of Pseudomonas aeruginosa. J. Bacteriol. 177, 948–952 [DOI] [PMC free article] [PubMed] [Google Scholar]
- 30. Kato J., Nakamura T., Kuroda A., Ohtake H. (1999) Cloning and characterization of chemotaxis genes in Pseudomonas aeruginosa. Biosci. Biotechnol. Biochem. 63, 155–161 [DOI] [PubMed] [Google Scholar]
- 31. Hickman J. W., Tifrea D. F., Harwood C. S. (2005) A chemosensory system that regulates biofilm formation through modulation of cyclic diguanylate levels. Proc. Natl. Acad. Sci. U.S.A. 102, 14422–14427 [DOI] [PMC free article] [PubMed] [Google Scholar]
- 32. Fulcher N. B., Holliday P. M., Klem E., Cann M. J., Wolfgang M. C. (2010) The Pseudomonas aeruginosa Chp chemosensory system regulates intracellular cAMP levels by modulating adenylate cyclase activity. Mol. Microbiol. 76, 889–904 [DOI] [PMC free article] [PubMed] [Google Scholar]
- 33. Darzins A. (1994) Characterization of a Pseudomonas aeruginosa gene cluster involved in pilus biosynthesis and twitching motility. Sequence similarity to the chemotaxis proteins of enterics and the gliding bacterium Myxococcus xanthus. Mol. Microbiol. 11, 137–153 [DOI] [PubMed] [Google Scholar]
- 34. Kearns D. B., Robinson J., Shimkets L. J. (2001) Pseudomonas aeruginosa exhibits directed twitching motility up phosphatidylethanolamine gradients. J. Bacteriol. 183, 763–767 [DOI] [PMC free article] [PubMed] [Google Scholar]
- 35. Timmis K. N. (2002) Pseudomonas putida. A cosmopolitan opportunist par excellence. Environ. Microbiol. 4, 779–781 [DOI] [PubMed] [Google Scholar]
- 36. Ramos J. L., Krell T., Daniels C., Segura A., Duque E. (2009) Responses of Pseudomonas to small toxic molecules by a mosaic of domains. Curr. Opin. Microbiol. 12, 215–220 [DOI] [PubMed] [Google Scholar]
- 37. Lacal J., Reyes-Darias J. A., García-Fontana C., Ramos J. L., Krell T. (2013) Tactic responses to pollutants and their potential to increase biodegradation efficiency. J. Appl. Microbiol. 114, 923–933 [DOI] [PubMed] [Google Scholar]
- 38. Lacal J., Muñoz-Martínez F., Reyes-Darías J. A., Duque E., Matilla M., Segura A., Calvo J. J., Jímenez-Sánchez C., Krell T., Ramos J. L. (2011) Bacterial chemotaxis towards aromatic hydrocarbons in Pseudomonas. Environ. Microbiol. 13, 1733–1744 [DOI] [PubMed] [Google Scholar]
- 39. Lacal J., Alfonso C., Liu X., Parales R. E., Morel B., Conejero-Lara F., Rivas G., Duque E., Ramos J. L., Krell T. (2010) Identification of a chemoreceptor for tricarboxylic acid cycle intermediates. Differential chemotactic response towards receptor ligands. J. Biol. Chem. 285, 23126–23136 [DOI] [PMC free article] [PubMed] [Google Scholar]
- 40. Lacal J., García-Fontana C., Callejo-García C., Ramos J. L., Krell T. (2011) Physiologically relevant divalent cations modulate citrate recognition by the McpS chemoreceptor. J. Mol. Recognit. 24, 378–385 [DOI] [PubMed] [Google Scholar]
- 41. Pineda-Molina E., Reyes-Darias J. A., Lacal J., Ramos J. L., García-Ruiz J. M., Gavira J. A., Krell T. (2012) Evidence for chemoreceptors with bimodular ligand-binding regions harboring two signal-binding sites. Proc. Natl. Acad. Sci. U.S.A. 109, 18926–18931 [DOI] [PMC free article] [PubMed] [Google Scholar]
- 42. Muñoz-Martínez F., García-Fontana C., Rico-Jiménez M., Alfonso C., Krell T. (2012) Genes encoding Cher-TPR fusion proteins are predominantly found in gene clusters encoding chemosensory pathways with alternative cellular functions. PLoS One 7, e45810. [DOI] [PMC free article] [PubMed] [Google Scholar]
- 43. Wiseman T., Williston S., Brandts J. F., Lin L. N. (1989) Rapid measurement of binding constants and heats of binding using a new titration calorimeter. Anal. Biochem. 179, 131–137 [DOI] [PubMed] [Google Scholar]
- 44. Schuck P. (2000) Size-distribution analysis of macromolecules by sedimentation velocity ultracentrifugation and lamm equation modeling. Biophys. J. 78, 1606–1619 [DOI] [PMC free article] [PubMed] [Google Scholar]
- 45. Jones K. S., Coleman J., Merkel G. W., Laue T. M., Skalka A. M. (1992) Retroviral integrase functions as a multimer and can turn over catalytically. J. Biol. Chem. 267, 16037–16040 [PubMed] [Google Scholar]
- 46. Stock J. B., Clarke S., Koshland D. E., Jr. (1984) The protein carboxylmethyltransferase involved in Escherichia coli and Salmonella typhimurium chemotaxis. Methods Enzymol. 106, 310–321 [DOI] [PubMed] [Google Scholar]
- 47. Campillo J. E., Ashcroft S. J. (1982) Protein carboxymethylation in rat islets of Langerhans. FEBS Lett. 138, 71–75 [DOI] [PubMed] [Google Scholar]
- 48. Duque E., García V., de la Torre J., Godoy P., Bernal P., Ramos J. L. (2004) Plasmolysis induced by toluene in a cyoB mutant of Pseudomonas putida. Environ. Microbiol. 6, 1021–1031 [DOI] [PubMed] [Google Scholar]
- 49. Fellay R., Frey J., Krisch H. (1987) Interposon mutagenesis of soil and water bacteria. A family of DNA fragments designed for in vitro insertional mutagenesis of gram-negative bacteria. Gene 52, 147–154 [DOI] [PubMed] [Google Scholar]
- 50. O'Toole G. A., Pratt L. A., Watnick P. I., Newman D. K., Weaver V. B., Kolter R. (1999) Genetic approaches to study of biofilms. Methods Enzymol. 310, 91–109 [DOI] [PubMed] [Google Scholar]
- 51. Djordjevic S., Stock A. M. (1997) Crystal structure of the chemotaxis receptor methyltransferase CheR suggests a conserved structural motif for binding S-adenosylmethionine. Structure 5, 545–558 [DOI] [PubMed] [Google Scholar]
- 52. Shiomi D., Zhulin I. B., Homma M., Kawagishi I. (2002) Dual recognition of the bacterial chemoreceptor by chemotaxis-specific domains of the CheR methyltransferase. J. Biol. Chem. 277, 42325–42333 [DOI] [PubMed] [Google Scholar]
- 53. Krell T. (2008) Microcalorimetry. A response to challenges in modern biotechnology. Microb. Biotechnol 1, 126–136 [DOI] [PMC free article] [PubMed] [Google Scholar]
- 54. Turnbull W. B., Daranas A. H. (2003) On the value of c. Can low affinity systems be studied by isothermal titration calorimetry? J. Am. Chem. Soc. 125, 14859–14866 [DOI] [PubMed] [Google Scholar]
- 55. O'Connor J. R., Kuwada N. J., Huangyutitham V., Wiggins P. A., Harwood C. S. (2012) Surface sensing and lateral subcellular localization of WspA, the receptor in a chemosensory-like system leading to c-di-GMP production. Mol. Microbiol. 86, 720–729 [DOI] [PMC free article] [PubMed] [Google Scholar]
- 56. Bantinaki E., Kassen R., Knight C. G., Robinson Z., Spiers A. J., Rainey P. B. (2007) Adaptive divergence in experimental populations of Pseudomonas fluorescens. III. Mutational origins of wrinkly spreader diversity. Genetics 176, 441–453 [DOI] [PMC free article] [PubMed] [Google Scholar]
- 57. Fillet S., Krell T., Morel B., Lu D., Zhang X., Ramos J. L. (2011) Intramolecular signal transmission in a tetrameric repressor of the IclR family. Proc. Natl. Acad. Sci. U.S.A. 108, 15372–15377 [DOI] [PMC free article] [PubMed] [Google Scholar]
- 58. Kedracka-Krok S., Wasylewski Z. (2003) A differential scanning calorimetry study of tetracycline repressor. Eur. J. Biochem. 270, 4564–4573 [DOI] [PubMed] [Google Scholar]
- 59. Błaszczyk U., Wasylewski Z. (2003) Interaction of cAMP receptor protein from Escherichia coli with cAMP and DNA studied by differential scanning calorimetry. J. Protein Chem. 22, 285–293 [DOI] [PubMed] [Google Scholar]
- 60. Molina L., Duque E., Gómez M. J., Krell T., Lacal J., García-Puente A., García V., Matilla M. A., Ramos J. L., Segura A. (2011) The pGRT1 plasmid of Pseudomonas putida DOT-T1E encodes functions relevant for survival under harsh conditions in the environment. Environ. Microbiol. 13, 2315–2327 [DOI] [PubMed] [Google Scholar]
- 61. Dereeper A., Guignon V., Blanc G., Audic S., Buffet S., Chevenet F., Dufayard J. F., Guindon S., Lefort V., Lescot M., Claverie J. M., Gascuel O. (2008) Phylogeny.fr. Robust phylogenetic analysis for the non-specialist. Nucleic Acids Res. 36, W465–W469 [DOI] [PMC free article] [PubMed] [Google Scholar]
- 62. Nelson K. E., Weinel C., Paulsen I. T., Dodson R. J., Hilbert H., Martins dos Santos V. A., Fouts D. E., Gill S. R., Pop M., Holmes M., Brinkac L., Beanan M., DeBoy R. T., Daugherty S., Kolonay J., Madupu R., Nelson W., White O., Peterson J., Khouri H., Hance I., Chris Lee P., Holtzapple E., Scanlan D., Tran K., Moazzez A., Utterback T., Rizzo M., Lee K., Kosack D., Moestl D., Wedler H., Lauber J., Stjepandic D., Hoheisel J., Straetz M., Heim S., Kiewitz C., Eisen J. A., Timmis K. N., Düsterhöft A., Tümmler B., Fraser C. M. (2002) Complete genome sequence and comparative analysis of the metabolically versatile Pseudomonas putida KT2440. Environ. Microbiol. 4, 799–808 [DOI] [PubMed] [Google Scholar]
- 63. Ramos J. L., Duque E., Huertas M. J., Haïdour A. (1995) Isolation and expansion of the catabolic potential of a Pseudomonas putida strain able to grow in the presence of high concentrations of aromatic hydrocarbons. J. Bacteriol. 177, 3911–3916 [DOI] [PMC free article] [PubMed] [Google Scholar]
- 64. Espinosa-Urgel M., Ramos J. L. (2004) Cell density-dependent gene contributes to efficient seed colonization by Pseudomonas putida KT2440. Appl. Environ. Microbiol. 70, 5190–5198 [DOI] [PMC free article] [PubMed] [Google Scholar]
- 65. Studier F. W., Moffatt B. A. (1986) Use of bacteriophage T7 RNA polymerase to direct selective high-level expression of cloned genes. J. Mol. Biol. 189, 113–130 [DOI] [PubMed] [Google Scholar]
- 66. Miroux B., Walker J. E. (1996) Over-production of proteins in Escherichia coli. Mutant hosts that allow synthesis of some membrane proteins and globular proteins at high levels. J. Mol. Biol. 260, 289–298 [DOI] [PubMed] [Google Scholar]
- 67. Hanahan D. (1983) Studies on transformation of Escherichia coli with plasmids. J. Mol. Biol. 166, 557–580 [DOI] [PubMed] [Google Scholar]
- 68. Rodríguez-Herva J. J., García V., Hurtado A., Segura A., Ramos J. L. (2007) The ttgGHI solvent efflux pump operon of Pseudomonas putida DOT-T1E is located on a large self-transmissible plasmid. Environ. Microbiol. 9, 1550–1561 [DOI] [PubMed] [Google Scholar]
- 69. Llamas M. A., Rodríguez-Herva J. J., Hancock R. E., Bitter W., Tommassen J., Ramos J. L. (2003) Role of Pseudomonas putida tol-oprL gene products in uptake of solutes through the cytoplasmic membrane. J. Bacteriol. 185, 4707–4716 [DOI] [PMC free article] [PubMed] [Google Scholar]


