

Background: A Lys113–Glu195 cross-strand ionic bond may regulate actin polymerization and its regulation by formin.
Results: A disrupted interaction causes yeast growth defects and defective actin polymerization and regulation by two yeast formins, rescuable by its restoration in the reverse orientation.
Conclusion: The interaction dictates filament formation and formin regulation.
Significance: The ionic interaction may allow allosteric communication between the filament exterior and interior.
Keywords: Actin, Contractile Protein, Cytoskeleton, Formin, Mutagenesis Site-specific, Yeast, Polymerization
Abstract
Proper actin cytoskeletal function requires actin's ability to generate a stable filament and requires that this reaction be regulated by actin-binding proteins via allosteric effects on the actin. A proposed ionic interaction in the actin filament interior between Lys113 of one monomer and Glu195 of a monomer in the apposing strand potentially fosters cross-strand stabilization and allosteric communication between the filament interior and exterior. We interrupted the potential interaction by creating either K113E or E195K actin. By combining the two, we also reversed the interaction with a K113E/E195K (E/K) mutant. In all cases, we isolated viable cells expressing only the mutant actin. Either single mutant cell displays significantly decreased growth in YPD medium. This deficit is rescued in the double mutant. All three mutants display abnormal phalloidin cytoskeletal staining. K113E actin exhibits a critical concentration of polymerization 4 times higher than WT actin, nucleates more poorly, and forms shorter filaments. Restoration of the ionic bond, E/K, eliminates most of these problems. E195K actin behaves much more like WT actin, indicating accommodation of the neighboring lysines. Both Bni1 and Bnr1 formin FH1-FH2 fragment accelerate polymerization of WT, E/K, and to a lesser extent E195K actin. Bni1p FH1-FH2 dramatically inhibits K113E actin polymerization, consistent with barbed end capping. However, Bnr1p FH1-FH2 restores K113E actin polymerization, forming single filaments. In summary, the proposed ionic interaction plays an important role in filament stabilization and in the propagation of allosteric changes affecting formin regulation in an isoform-specific fashion.
Introduction
Proper cytoplasmic actin cytoskeletal function requires that actin be able to assemble reversibly into filamentous networks in a spatially and temporally controlled fashion. This regulation comes from the conformational plasticity of the actin filament itself and a series of actin-binding proteins that can control actin filament behavior. These include end-capping proteins, filament-stabilizing proteins, severing proteins, and filament-nucleating proteins. Many of these regulatory proteins work either by actively imparting changes on filament conformation or by capturing one of the multiple conformations, thereby leading to a change in behavior of the filament ensemble. Examples of proteins exerting these effects on F-actin are gelsolin (1), cofilin (2), myosin (3), and formin (4–7).
In order to understand the molecular basis of this regulation, it is first essential that the importance of potential actin intermonomer contacts be assessed. Second, it is important that allosteric pathways within actin, through which conformational changes are propagated, be delineated. The ability to address these questions depends on the predictions of different actin filament models that have been generated. These have not been based on high resolution x-ray crystallography, because such structures of the filament are not available. Instead, these models usually involve the docking of high resolution x-ray crystal structures of the monomer into electron density envelopes obtained by optical reconstruction of filament EM density envelopes and then altering the monomer structure to obtain the best fit (8–12). Because these models are under-resolved, it is necessary to assess experimentally the importance of such hypothetical contacts on actin function.
One such case is a potential cross-strand intermonomer ionic bond between Lys113 of one actin monomer and Glu195 of an apposing monomer. This interaction was predicted by the recent filament models of Oda et al. (11) and Namba and co-workers (8), in which the side chains of these residues are within 3 Å of one another (Fig. 1). Interestingly, this interaction was not apparent in the original Holmes filament model (10). If such a bridge existed, it would potentially contribute strongly to actin filament stabilization. Additionally, such an ionic bridge may be vital to the ability of an actin regulatory protein, such as formin binding to the surface of F-actin, to affect actin dynamics by altering interstrand contacts. Modeling shows that Lys113 is the innermost residue of a helix that extends to Lys118 on the surface of actin near binding sites for both formin and Arp2/3. It also shows a potential intramonomer interaction between Glu195 and Arg256 in the center of the filament. Our recent work shows that mutations in Arg256 affect formin-actin interactions, as predicted by our hypothesis (13).
FIGURE 1.

The positions Lys113 (marine blue) of one F-actin monomer (salmon red) and Glu195 (red) and Arg256 (orange) of an apposing monomer (green) in the Holmes F-actin model (left) and in the Oda model (right). The locations of these three residues are highlighted by the red box in both models. The positions of these three residues relative to one another are magnified in the bottom panels. The distances from the ϵ-amino of Lys113 and the tips of the guanidinium moiety in Arg256 to the tip of the carboxylic acid in Glu195 were measured using PyMOl, version 1.5.0.4, based on the coordinates of the two models.
In this paper, we assess the importance of a Lys113–Glu195 ionic interaction in both filament stabilization and regulation. The genetic manipulatability of Saccharomyces cerevisiae, the fact that it has a single actin gene, and the fact that its actin is 91% identical to mammalian nonmuscle actin make it an excellent model system for addressing this question (14). Our approach is to first carry out site-directed mutagenesis on yeast actin, resulting in first elimination of the proposed bond and then its reconstruction in the opposite orientation, and to then assess the effects of these changes on yeast viability. Subsequently, we examine the behavior of these alterations on actin polymerization and formin-dependent regulation in vitro using purified proteins.
EXPERIMENTAL PROCEDURES
Construction of Haploid Yeast Cells Expressing Mutant Actins
Saccharomyces cerevisiae haploid strains expressing mutant actin as the sole actin were constructed as described by Wen et al. (15). Briefly, the yeast haploid plasmid (pRS314) carrying the yeast actin coding sequence (ACT1) including the promoter region was used as the template for site-directed mutagenesis using the QuikChange kit (Stratagene) according to the manufacturer's instructions. The primers used for mutagenesis were purchased from Integrated DNA Technologies (Coralville, IA). The mutated plasmid was transformed into host haploid cell, in which the only functional ACT1 gene is carried on a centromeric plasmid (pCEN). Transformed cells were subjected to plasmid shuffling using selection based on nutritional markers, and viable strains were collected. The plasmids were isolated from the collected strains and sequenced to confirm the presence of the desired mutations.
Characterization of Actin-related Growth Defects and Cell Size
To characterize the growth of mutant cells in an agitated rich liquid culture, an overnight culture of each cell strain was diluted to an A600 ∼0.2 with YPD (1% yeast extract, 2% peptone, and 2% dextrose) medium. The cells were grown at 30 °C, and growth was followed by the increase in A600 over time throughout 3 days. The actin-related defects caused by environmental stress were determined by subculturing the overnight YPD culture to A600 ∼0.2. A 2-μl sample was spotted on YPD agar (YPD medium with 2% agar) plates. The plates were then incubated at either 30 or 37 °C to test for temperature sensitivity. The same cells were applied to a YPG (1% yeast extract, 2% peptone, and 2% glycerol) agar plate, and to YPD + 0.5 m NaCl agar plates to test for mitochondria function and for hyperosmolar sensitivity, respectively. Colony size was recorded after 48 h of growth using an Epson 2450 scanner. All experiments were repeated twice using different cultures with similar results.
To estimate cell size, cells at A600 ∼0.4–0.8 were collected, and cell images were recorded by bright field microscopy using an Olympus X-81 microscope with a UAPO-N ×100 TIRF2 lens, a Prior Lumen 200 fluorescence illumination system, and a Hamamatsu ORCA-R2 camera, controlled by Slidebook, version 5. We focused on single cells and the mother cell in a budding cell early in the cell cycle. Cell size was measured by using the elliptical selection in the FIJI image analysis bundle (16) to trace the cell area and the measurement function in the same software to estimate the size of the area. At least 100 cells of each strain were counted.
Cytology
Actin Cytoskeleton
Overnight cultured cells were diluted to A600 of 0.1 with YPD medium and were grown at 30 °C with agitation until A600 of 0.4–0.8. The cells were fixed with 3.7%, formaldehyde, washed with PBS, and stained with 0.5 μm Alexa-488 phalloidin in PBS overnight at 4 °C as described (17). Stained cells were mixed with an anti-bleach mounting medium Vectashield® (Vector, CA) at a 1:1 ratio and mounted on microscope slides with a 70-μl 20% gelatin pad to immobilize cells. Actin cytoskeleton images were collected with an Olympus X-81 microscope as described above. For image recoding, we collected 19–24 z sections at 0.3-μm intervals through whole cells, and we removed out-of-focus light by non-neighbor deconvolution using the same Slidebook, version 5, software. We further rendered each series of deconvoluted images by the FIJI image analysis bundle as described above and stacked them into a two-dimensional image. We focused on budding cells in which the size of the daughter cell was less than one-half the size of the mother cells when actin cables and patches are highly polarized. More than 100 cells were analyzed for each sample.
Mitochondrial Morphology
Mitochondria were visualized using a fusion protein consisting of the red fluorescent protein, HcRed, conjugated to the signal sequence of subunit 9 of F0-ATP synthase (pOLI1-HcRed) (18). The plasmid was kindly provided by Dr. Liza Pon (Columbia University). Fixed cell samples were prepared as for actin cytoskeleton staining except replacing YPD medium with Ura− synthetic medium. Images of mitochondria were collected and analyzed as described previously (19).
Actin and Formin Preparations
Individual WT and mutant actins were purified using DNase I affinity chromatography and DEAE ion exchange chromatography as described by Malloy et al. (13). WT actin was purified from yeast cake purchased locally, and mutant actins were from laboratory-cultured yeast cakes. The purified globular actins (G-actins) were stored in the Ca2+ form in G-actin buffer (10 mm Tris-HCl, pH 7.5, 0.2 mm CaCl2, 0.2 mm ATP, and 0.1 mm DTT) for 4 days at 4 °C. A 10 mm solution of Oregon Green® 488 maleimide (Invitrogen) in DMSO and a 6.6 mm stock solution of N′-(3-maleimidylpropionyl)biocytin (Invitrogen) in DMSO were mixed with G-actin solution (without DTT) individually at a molar ratio of each reactant to F-actin of 4:1. Each reaction was incubated at room temperature for at least 3 h in the dark. The F-actins were collected by centrifugation in a Beckman TL centrifuge in a TLA 100.2 rotor at 80,000 rpm, 25 °C for 30 min, and depolymerized by dialysis against G buffer. The extent of Oregon Green® 488 labeling was determined by the ratio of the actin concentrations measured with the absorbance at 491 nm (ϵ491 nm = 8,100 m−1 cm−1) and with the absorbance at 290 nm (described above). His-tagged FH1-FH2 fragment through the C terminus of either yeast formin Bni1p or Bnr1p was cloned in a Gal-induced overexpression plasmid (20) provided by Dr. Bruce Goode (Brandeis University). These plasmids were transformed in and overexpressed from the strain BGY 502. The His-tagged fragments were purified using Ni2+-charged affinity chromatography followed by size exclusion chromatography as described previously (20). Purified fragments were stored in stock buffer (10 mm Tris-HCl, pH 7.5, 150 mm KCl, 10% glycerol, and 1 mm DTT) at −80 °C.
Characterization of G Actin
To determine the content of secondary structure of the G-actins, a 250-μl G-actin sample at a concentration of 3 μm was scanned using a J-815 CD spectrometer (Jasco) equipped with Spectra Manager, version 2, software with the wavelength ranging from 170 to 300 nm. For each actin sample, the CD spectrum from 200 to 240 nm was further analyzed and fitted by a Web-based software package, K2D3 (21), to estimate the percentage of each secondary structure component.
Protease digestion was performed essentially as described previously (22) with modification. Briefly, 4.6 μm G-actin was incubated with trypsin (5 μg/ml), subtilisin (1 μg/ml), or α-chymotrypsin (22.5 μg/ml) at room temperature for the desired time. All of the digestion reactions were stopped by adding SDS-sample loading buffer and then heating at 95 °C for 3 min. The samples were analyzed by SDS-PAGE on a 12.5% polyacrylamide gel, and the bands were visualized by staining with Coomassie Blue.
Actin Polymerization
A 120-μl solution of G-actin alone or with formin fragment in G buffer was induced to polymerize at 25 °C by the addition of MgCl2 and KCl to final concentrations of 2 and 50 mm, respectively. The increase in light scattering signal with excitation and emission wavelengths set at 360 nm was recorded as a function of time. The light scattering signal was obtained using a FluoroMax (Jobin Yvon Inc.) fluorescence spectrometer with a thermostatted water bath attached to the cuvette chamber. To measure the critical concentration of each actin in this report, the net change in light scattering was plotted as a function of actin concentration, and the x intercept yielded the critical concentration.
Electron Microscopy and Filament Length Measurement
To visualize actin filaments, a 2-μl sample of 3 μm actin (WT, E195K, and K113E/E195K (E/K) actins) or 5 μm (for K113E actin) at polymerization steady state was removed and was deposited onto a 400-mesh carbon-coated Formvar grid. The actin on the grid was negatively stained with 1% uranyl acetate and observed with a JEOL 1230 transmission electron microscope equipped with a Gatan UltraScan 1000 CCD camera in the University of Iowa Central Microscopy Research Facility. For each sample, using ImageJ software (National Institutes of Health), we measured the contour lengths of at least 100 filaments that clearly showed both filament ends.
TIRF Microscopy
The actin used for TIRF analysis was mixed with 65% non-labeled actin, 30% Oregon Green 488-labeled actin, and 5% biotinyl actin. We used biotinyl WT actin instead of individually labeled biotinyl mutant actins for the TIRF assay. Each 1 μm TIRF G-actin sample in TIRF G buffer (20 mm Hepes, pH 7.5, 50 mm DTT, 0.2 mm CaCl2, 0.2 mm ATP, 20 mg/ml glucose, 200 μg/ml glucose oxidase, 40 μg/ml catalase, 1 mg/ml BSA, and 0.5% methylcellulose) was induced to polymerize by the addition of KCl and MgCl2 as described above. The sample was then loaded into a TIRF flow cell coated with 5–25 nm NeutrAvidin (Invitrogen) as described (23). Single filament elongation was visualized using an Olympus IX81 inverted microscope with a PlanApo N ×60 TIRF lens and Hamamatsu camera as described above. Images were captured at a rate of 10 s/frame for 10 min or less using Slidebook, version 5. The polymerization rate constants of individual filaments were further measured by the ImageJ plugin (24) kindly provided by Jeffery Kuhn (Virginia Tech). At least 10 filaments from each actin sample preparation were measured, and at least three different actin preparations of each actin were analyzed.
Simulation of Actin Polymerization
We used Berkeley Madonna, version 8, to simulate and fit the actin polymerization kinetics data with a four-step actin polymerization scheme for WT, E195A, and E/K mutant actin polymerization and an extra fragmenting/annealing step for the K113E, K113A, and E195K actins as described previously (25, 26) and in Scheme 1, where A represents actin monomer, B is actin dimer, C is actin trimer, F is filament, kf is the forward reaction rate constant, and kr is the reverse reaction rate constant.
SCHEME 1.
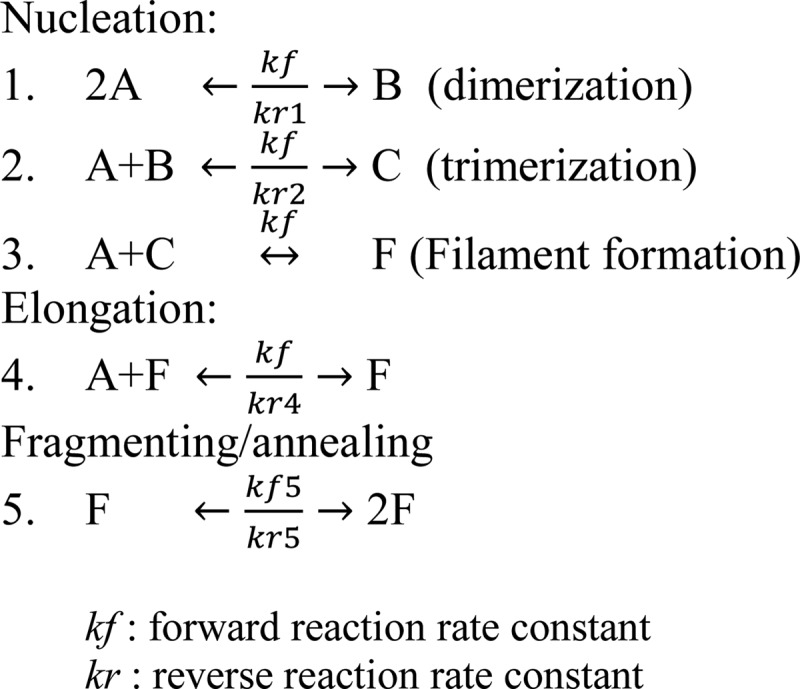
Actin polymerization scheme.
We used the overall kon values obtained from TIRF measurements of the individual actins as the kf. Previously, we had conducted a TIRF analysis of R177H actin, which behaves much like the Lys113 mutants (26). For this actin, the kon value was about half that of WT actin. We thus used a similar value for the Lys113 mutant actins because we could not obtain them directly by TIRF due to their high critical concentrations. Finally, we refined these simulations with the Curve Fit function in the software package.
Statistical Analysis
All data are presented as means ± S.D. Results for cell size analysis between WT and individual mutant cells were compared using a paired t test with a p value of <0.01 considered significant. Results for the best fit of experimental polymerization to our polymerization model were obtained using the F-test two-sample for variances. In this test, the closer the F-value is to 1, the better is the fit. All statistical analyses and histogram generation were done using Microsoft Excel.
RESULTS
Our overall focus was to assess the importance of a hypothetical interstrand ionic interaction in F-actin involving Lys113 in a monomer in one strand of the actin helix with Glu195 in the other, potentially as part of an interstrand stabilization system. Using site-directed mutagenesis, we obtained viable haploid yeast strains expressing either the K113E mutation or the E195K mutation. The first would destabilize the interaction with two opposing negative charges. The second, placing two potentially cationic lysines across from one another might also cause filament disruption. Finally, we constructed a viable double mutant, E/K, in which the original ionic interaction was restored but in the opposite orientation.
Effects of the Mutations on Growth
We first determined the effects of the mutations on growth in liquid YPD complete rich medium at 30 °C with agitation. Fig. 2A shows that the individual K113E and E195K mutations caused early growth arrest. The double mutation (E/K cells) in actin restores growth under these conditions to WT behavior. Consistent with these results, the cell size distribution of the two single mutant strains seemed to be right-shifted to a larger size than WT, with the K113E cells being the most affected (Fig. 3). Mean surface area of the cells also followed the same trend (Table 1), although the effect of the E195K mutation was modest compared with the K113E effects. With the double mutant (E/K) cells, size distribution was virtually like that of WT cells.
FIGURE 2.

Growth deficiency of cells expressing WT and mutant actin in YPD medium. A, growth of cells in agitated rich liquid medium was determined as described under “Experimental Procedures.” The cell density based on the A600 value was recorded at different time points and was plotted as a function of time. a.u., arbitrary units. B, freshly cultured cells were diluted to A600 ∼0.3. A 2-ml sample from each culture was spotted onto agar plates either with YPD medium at 30 or 37 °C, YPG medium at 30 °C, or YPD with 0.5 m NaCl at 30 °C as described under “Experimental Procedures.” After 48 h, plates were photographed. The same experiment was repeated twice with reproducible results.
FIGURE 3.

Size measurement and the distribution of WT and mutant cells. Cells in log phase cultures (A600 ∼0.4–0.6) were chemically fixed and imaged using bright field microscopy as described under “Experimental Procedures.” A, the differential interference contrast images of WT and K113E cells. Only single cells or mother cells during budding identified in various fields were used in the analysis, and at least 120 cells were measured for each case. B, the area of each cell was measured by FIJI image analysis software, and statistical data analysis was performed by Excel as described under “Experimental Procedures.” A, area; areas shown are in μm2.
TABLE 1.
Summary of in vivo studies of WT and mutant cells
| WT | K113E | K113A | E195K | E195A | E/K | |
|---|---|---|---|---|---|---|
| Doubling timea (h) | 2.1 | 3.5 | 2.9 | 4 | 2.5 | 2.7 |
| Average cell sizeb (μm2) | 23.6 ± 5.9 | 39.0 ± 17.5 | 26.0 ± 8 | 30.0 ± 10.4 | 24.4 ± 4.3 | 26.1 ± 6.4 |
| (p = 9e−16) | (p = 0.01) | (p = 0.01) | (p = 0.1) | (p = 0.015) | ||
| Normal actin cytoskeletal morphologyb (%) | 95 ± 1 | 2 ± 1 | 54 ± 9 | 3 ± 2 | 97 ± 3 | 25 ± 5 |
| Normal mitochondria morphologyb (%) | 88 ± 6 | 2 ± 1 | 29 ± 4 | 12 ± 1 | 95 ± 4 | 41 ± 10 |
a The data are averaged from two individual experiments.
b The data are averaged from three individual experiments, and at least 100 cells were counted from each experiment. The population data for each mutant cell are compared with that of WT cells using Excel with a paired t test to calculate p value.
In yeast, a well functioning actin cytoskeleton is necessary for normal mitochondrial function and morphology. One can assess mitochondrial function by the cell's ability to grow on glycerol as a sole carbon source (YPG medium) because use of glycerol as an energy source requires a mitochondrial enzyme. Fig. 2B shows that on YPG medium, K113E and E195K cells cannot grow, whereas with the E/K double mutant, growth is restored. Taken together, these studies lead to a hierarchy of the mutations' effects, with K113E producing the most severe changes, E195K producing less severe effects, and the E/K mutations leading to substantial rescue of function.
Cytological Effects of the Mutations
In S. cereviseae, early in the budding process, actin is localized primarily to endocytic patches in the bud and to cables that run between the mother and bud cells. The effects of the mutations on cell growth suggested that there would be mutation-based changes to cell morphology and organization. Visualization of fixed K113E or E195K cells stained with Alexa-488 phalloidin showed abnormal cytoskeletal patterns in almost all of the mutant cells (Fig. 4 and Table 1). K113E cells contained either depolarized actin patches or fragmented/depolarized actin cables. This absence of long polarized cables is consistent with the larger and rounder appearance of these cells, which results from loss of polarized growth (Fig. 3 and Table 1). E195K cells showed randomly oriented and abnormally thick actin cables (Fig. 4 and Table 1). In the E/K cells, polarized filaments and normal patches were again visible in ∼30% of the cells (Fig. 4 and Table 1).
FIGURE 4.

Altered cytoskeletal morphology in cells expressing mutant actins. Freshly cultured cells at A600 ∼0.4–0.6 were by formaldehyde-fixed, and the actin was stained with Alexa-488 phalloidin. Stained cells were visualized using an Olympus X-81 microscope, and images were further rendered by the FIJI image analysis software as described under “Experimental Procedures.” A, actin cytoskeletal patterns in WT and all mutant cells. B, at least 150 cells from each strain were examined, and the distribution of each actin cytoskeleton morphological feature was sorted by Excel.
The glycerol results led us to examine the mutations' effects on mitochondrial morphology. For this experiment, we used cells expressing the red fluorescent protein, HcRed, conjugated to the signal sequence of subunit 9 of F0-ATP synthase (pOLI1-HcRed) (18), and we assessed mitochondrial appearance in terms of the degree of tubular fragmentation or aggregation relative to mitochondria in WT cells. Fig. 5 and Table 1 show that K113E and E195K cells do not exhibit the long tubular structures typical for mitochondria seen in WT cells. Again, the introduction of the second mutation partially rescued either the K113E or E195K phenotype, consistent with the YPD medium and YPG stress growth results.
FIGURE 5.
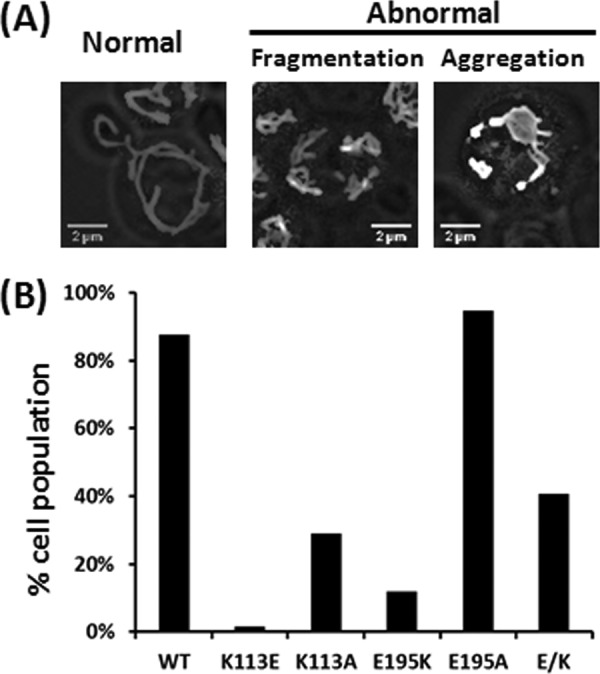
Defective mitochondrial morphology in mutant cells. Freshly cultured cells (A600 ∼0.4–0.6) expressing pOLI1-HcRed were formaldehyde-fixed, and the mitochondria were visualized with an Olympus X-81 microscope. Images were further rendered by FIJI image analysis software as described under “Experimental Procedures.” A, examples of mitochondria in WT and all mutant cells. B, at least 150 cells from each cell strain were counted, and the distribution of each mitochondrial morphology in each cell strain was sorted by Excel.
Effects of the Mutations on Actin Properties in Vitro
We readily obtained each of the three purified mutant actins in good yield. Circular dichroism (CD) spectra showed that all mutations produced minimal effects on G-actin secondary structure: ∼42% α-helix and 13% β-sheet (Fig. 6A). Protease digestion patterns using trypsin, subtilisin, and α-chymotrypsin were also virtually the same for the WT and all of the mutants except for E195K. We have thus shown only the data for E195K (Fig. 6B). Somehow, the E195K mutation in subdomain 4 causes a propagated effect on the top of subdomain 2, the site of protease cleavage (22), but this alteration is corrected in the double mutant.
FIGURE 6.

Characterization of G-actin by CD spectrometry and susceptibility of subdomain 2 to protease digestion. A, the CD spectrum of 3 μm G-actin was measured using a J-815 CD spectrometer, and each spectrum was analyzed using K2D3 CD analytical software (see “Experimental Procedures”) to resolve the percentage of each secondary structure element in each G-actin. B, a 5 μm solution of WT or E195K G-actin was subjected to proteases in G-buffer as described under “Experimental Procedures.” The digestion products were analyzed using a 12% SDS-polyacrylamide gel, and the bands were visualized by Coomassie Blue staining.
In agreement with our hypothesis, the K113E mutation produced a markedly elongated nucleation lag phase, a slower apparent elongation phase, and over a ∼5.5-fold increase in critical concentration (Fig. 7 and Table 2). Interestingly, the E195K actin displayed nearly normal kinetics and a slightly elevated critical concentration, a much milder effect than we expected. Introduction of the E195K mutation into the K113E actin, reestablishing the ionic interaction, but in the reverse orientation (E/K), led to substantial rescue of actin polymerizability.
FIGURE 7.

Polymerization of WT and mutant actins. G-actin (4.6 μm) was induced to polymerize by the addition of KCl and MgCl2 to final concentrations of 50 and 2 mm, respectively. The change in light scattering signal, indicative of actin polymerization, was monitored over time as described under “Experimental Procedures.” The signal was then converted to actin concentration after correcting for the critical concentration of each actin. The same experiment was repeated three times with similar results. Only one set of data is presented. Open circles, experimental data. Black dashed line, simulated polymerization without a fragmentation/annealing step. Red dashed line, like the black dashed line but with a fragmentation/annealing step.
TABLE 2.
Summary of in vitro measurements and simulations of WT and mutant actins
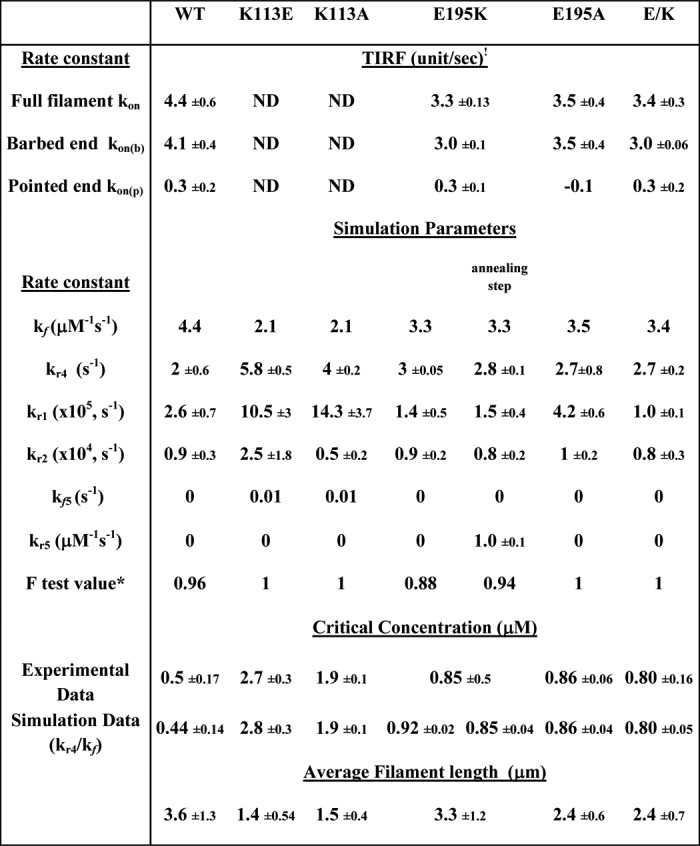
1 The data are averaged from three individual experiments, and at least 20 filaments from each experiment were measured.
* F-test value is calculated using F-test two-sample for variances, an Excel data analysis tool, to compare the experimental data and simulation data in different polymerization schemes as described under “Experimental Procedures.”
As determined by EM studies of negatively stained samples of the polymerized actins, all three of the mutant actins produced relatively normal appearing filaments (data not shown). Further analysis (Fig. 8 and Table 2) showed that although the mean length of the E195K filaments was basically the same as that of WT filaments, the mean length of the K113E filaments was about half the size of WT filaments. Finally, that of the E/K filaments was between the WT/E195K actin and Lys113 mutant values. The bar graph in Fig. 8 and Table 2 demonstrate that the mutant filament length distribution for the K113E was significantly narrower and shifted to shorter lengths than that of WT actin. The distribution for E195K actin was about that of WT actin, whereas that for the E/K double mutant was in between.
FIGURE 8.

Length distributions for WT and mutant actin filaments. The lengths of at least 100 filaments were measured for each actin, and the filament length distribution is presented as a bar graph. L, filament length.
E113A and E195A Mutations
The relatively weak effects of the E195K mutation in vivo and in vitro surprised us because such a mutation might be expected to cause a charge-repulsive situation between Lys113 and Lys195, leading to severe filament destabilization. However, the four methylene carbons of the lysine side chain impart a high degree of hydrophobicity on the residue, raising the possibility that the E195K mutation leads to creation of a stabilizing lysine-lysine hydrophobic interaction that replaces the ionic interaction normally present.
To test this hypothesis, we created two additional mutant actins, K113A and E195A. By CD analysis and protease digestion, neither mutation produced any noticeable large scale change in actin secondary structure (Fig. 6A) (data not shown). The mutations should have eliminated the possibility of a cross-strand ionic cross-bridge and greatly decreased the magnitude of a cross-strand hydrophobic interaction as well because the methylene carbons needed for such an interaction would also be missing.
We first tested the effects of these two mutations on actin polymerization using a bulk solution assay. Fig. 7 shows that the K113A, like the K113E, leads to a significant lag phase in nucleation and a significant increase in critical concentration, as does the K113E mutation. However, the critical concentration effect caused by the K113E is more severe than that caused by the K113A (Table 2), presumably reflecting the additional disruption caused by charge repulsion. The E195A mutation led to a slower rate of polymerization than the E195K, although there was little if any effect on critical concentration. In terms of filament length distribution, like the K113E filaments, the K113A filaments were severely shortened (Fig. 6 and Table 2). The E195A filaments were shorter than the E195K filaments but closer to WT filament lengths than the K113A filaments. Results with both of these mutants are consistent with our lysine-lysine hydrophobic bond hypothesis, although there is an asymmetric effect of the A substitution in the two sites.
In vivo, the K113A mutation produced much more severe effects than the E195A mutation. The K113A mutation caused severe growth defects in rich liquid medium like the E113K mutation. On the other hand, the E195A cells grow essentially like WT cells, very different from the defective growth observed with the E195K cells (Fig. 2A). Like the K113K cells, the K113A cells were unable to grow on glycerol as the sole carbon source (Fig. 2B). On the other hand, whereas the E195K cells could also not grow on glycerol, the E195A cells displayed WT growth behavior (Fig. 2, A and B). The E195A mutation also did not affect cell size, actin cytoskeletal morphology, or mitochondrial morphology (Figs. 3–5). Conversely, the K113A mutation produced significant deleterious effects on these parameters like the K113E mutation, although in general they were not as severe.
Single Filament Kinetic Behavior
To gain more insight into the effects of the mutations on polymerization, we measured the kinetics of single actin filament polymerization with TIRF. We did not assess the behavior of the two Lys113 mutations in this manner due to the high critical concentrations of these actins and the problems this would cause in comparing mutant and WT behavior under the same protein concentrations. Table 2 shows the kinetics parameters associated with polymerization of individual actin filaments. The mutant actins examined exhibited similar overall polymerization rate constants (kon), about 25% slower than that of WT actin. This decrease is clearly due to a change in actin barbed end (kon(b)) polymerization, because the variation of the pointed end rate (kon(p)) constants between these three mutants and WT actin is not significant.
Simulation of Polymerization
We further tried to fit the actin polymerization data with a simple four-step actin nucleation/polymerization model as described under “Experimental Procedures” and using the TIRF-derived kon values as fixed values for kf. For the Lys113 mutations, we used values for kf based on a previous study with another mutant, R177H, that displayed similar kinetic behavior (26). Fig. 7 and Table 2 show that the simulations produce a good fit to the experimental data for the WT, E195A, and E/K actins (F-test values close to 1). In all cases, kf for the mutants was slower than kf for WT actin. Furthermore, kr4 for the mutants ranged from about 1.5 to 3 times faster than that of WT actin, with the largest deviations occurring with the Lys113 mutants.
The bulk polymerization data showed that the E195A actin displayed an overall slightly slower polymerization rate than the E/K double mutant. The simulations show that this retardation is probably not due to a difference in filament elongation but in nucleation. Nucleation occurs by an initial dimerization and then trimerization of monomers. Reversal of dimerization is represented by kr1 in the model, and Table 2 shows that for E195A, this value is 1.3 times faster than WT. Polymerization of WT and E/K actins follow similar kinetic curves. However, for E/K, kr1 is half as fast as the WT value, showing formation of a more stable nucleus. This increased stability is offset by a slower elongation rate, resulting in comparable overall polymerization rates.
The fit we obtained for K195E actin polymerization using the simple four-step model yielded an F-value for the fit of only 0.88 (Table 2), slightly less than what was achieved with the other actins. To improve this fit, we added an extra annealing step (described under “Experimental Procedures”). This extra step (Table 2) improves the F-value to 0.94, and this calculated propensity to anneal is consistent with our observation of an overall longer filament distribution for K195E compared with WT actin.
Apparent fast elongation of a mutant actin compared with WT actin, coupled with a significantly increased critical concentration, often suggests destabilization of the mutant filament, resulting in significant fragmentation during polymerization. We thus included a fragmentation step in the simulation of the Lys113 mutant actins. The major difference between the two Lys113 mutant actins is that the kr4 rate of K113E is about 1.5 times that of K113A, suggesting the K113A actin filament is more stable than the K113E actin filament, in agreement with its lower critical concentration.
Effects of the Mutations on Formin Action
Our recently published work with the R256H mutation, very near to residue 195, showed that this mutation resulted in an altered formin interaction with the filament (13). Furthermore, the loss of polarized growth of K113E cells and the abnormal cable arrangement coupled with the prolonged nucleation phase in vitro was consistent with an altered actin-formin interaction. We thus hypothesized that the Lys113–Glu195 interaction was part of a structural module through which the disruption caused by the R256H mutation was transmitted to the filament surface. If our hypothesis was correct, alteration of this interaction should give rise to a similar formin effect.
To test this hypothesis, we used the yeast formin Bni1p FH1-FH2 actin-binding fragment. Fig. 9 demonstrates, using a bulk solution assay, that, as published previously, the Bni1p fragment accelerates actin polymerization in a concentration-dependent fashion, consistent with its role as a filament nucleator. We observed a similar but more muted effect with the E195K or E195A mutation. The high critical concentration of K113E actin required that we increase the amount of this actin used in the assay. With the K113E or K113A actin, the Bni1p fragment did not promote but actually inhibited polymerization. This result suggested that with the mutant actin, the formin fragment acted as a barbed end capping protein, similar to what we had observed with the R256H mutation (13). When we repeated the experiment with the E/K double mutant actin, we again observed a WT-like actin-formin interaction, consistent with our proposed role for the ionic interaction in determining filament conformation. Attempts to do TIRF analysis with the mutant actins in the presence of the Bni1p formin fragment did not yield consistent measurements for reasons we do not understand.
FIGURE 9.

Effect of the Bni1p FH1-FH2 fragment on the polymerization of WT and mutant actins. A 2.3 μm solution of WT, E195K, E195A, or E/K actin was polymerized in F buffer in the presence of Bni1p FH1-FH2 fragment at the concentrations indicated in the figure legend. The symbols and concentrations shown in the WT panel apply to all other panels. Furthermore, either a 5 μm K113E actin or a 4 μm K113A actin solution was polymerized in the presence of Bni1p FH1-FH2 in F buffer because of the high critical concentrations of these actins. The net change in light scattering was monitored with time as described under “Experimental Procedures.” These experiments were repeated three times with different actin preparations with identical results. a.u., arbitrary units.
S. cerevisiae has a second formin, Bnr1p. Although at least partially redundant in terms of in vivo roles (27), the formins have distinct functional characteristics in vitro. Bnr1p promotes actin polymerization more efficiently than Bni1p, and at concentrations of >100 nm, it has the added capacity of cross-linking actin filaments to form bundles. It also modifies actin filament structure differently than does Bni1p (7, 20).
Because of the different characteristics of these formins, we wanted to determine if disruption of the 113–195 interaction differentially affected the formins' interaction with actin. We thus assessed the effect of the Bnr1p FH1-FH2 fragment on actin polymerization (Fig. 10). We used a lower concentration of Bnr1p in order to assess the effect of Bnr1p on polymerization in the absence of bundle formation. As in the case with Bni1p, we again used higher concentrations of the two Lys113 mutant actins as described above. Fig. 10 shows that the Bnr1p fragment accelerated E195K actin polymerization similar to but more slowly than what we observed with WT actin (data not shown). As expected, it also promoted polymerization more efficiently than Bni1p. Experiments with K113E or K113A actin, however, produced an unexpected result. The Bnr1p fragment did not inhibit actin polymerization, contrary to the case with Bni1p. Instead, it caused increased light scattering as observed with E195K and A actins. With E/K actin, the Bnr1p fragment restored filament behavior to that observed with E195K and E195A actins. By EM (data not shown), we observed single filaments with all of the actins at the concentrations used here. The addition of Bnr1p to the K113E and K113A mutants also produced single filaments. This result indicates that the increased light scattering we saw following the addition of the Bnr1p resulted from filament formation, not bundling or aggregation.
FIGURE 10.

Effect of the Bnr1p FH1-FH2 fragment on the polymerization of mutant actins. A 2.3 μm solution of WT, E195K, E195A, or E/K actin was polymerized in F buffer in the presence of Bnr1p FH1-FH2 fragment at the concentration indicated. Either a 5 μm K113E actin or a 4 μm K113A actin solution was polymerized in the presence of Bnr1p FH1-FH2 in F buffer because of the high critical concentrations of these actins. We also used higher formin fragment concentrations with the K113E sample. The net change of light scattering was monitored with time as described under “Experimental Procedures.” The assays were repeated twice with identical results using two different actin preparations. a.u., arbitrary units.
DISCUSSION
The goal of this paper was to test the hypothesis that an ionic bridge formed between Lys113 of one monomer and Glu195 in a monomer on the apposing strand of the actin helix played a crucial role in normal F-actin stabilization and its regulation by actin-binding proteins. If our hypothesis was correct, disruption of the ionic interaction by site-directed mutagenesis should have led to filament instability, and reconstruction of this proposed bond in the opposite orientation should have brought about a rescue of the defects caused by the first mutation. In agreement with these predictions, K113E actin resulted in drastic growth defects and polymerization defects in vitro, both of which were largely eliminated with reinstitution of the reversed ionic pair. The K113E mutation resulted in a prolonged nucleation phase and a slower elongation phase with nucleation being apparently more severely affected. This different severity level should be expected because weakened cross-strand contacts should have a more deleterious effect in a situation where a three- or four-monomer nucleus, an inherently unstable assembly, forms than when an altered interaction within a filament can be stabilized somewhat by contacts involving surrounding monomers.
The importance of a cross-strand ionic interaction for filament stabilization is further underscored by a recent study that examined the force needed to remove a monomer from the end of a filament using an approach involving atomic force microscopy (28). This study showed that monomer-filament bond strength was a function of the force applied to the monomer. Modeling predicted that Lys113 would be important, and mutating this residue in a way that would eliminate the proposed ionic interaction weakened the monomer-filament association.
These experiments, especially rescue of the defect by reversing the positions of the original residues, clearly demonstrate that a cross-strand ionic interaction involving these two residues is an important determinant of normal actin filament stability and function. Such a result emanating from a predicted interaction cannot be assumed to be true. In a similar situation, a simulation predicted that a 39–275 bond was necessary for stabilization as well (29). However, in that case, experimental results demonstrated that the predicted interaction was not important (30). This type of molecular insight is crucial in order to understand the forces that lead to filament polymerization and stabilization and their regulation and how their disturbance can ultimately lead to pathologic situations.
The E195K mutation also produced striking effects in vivo. However, the surprisingly minor effects we observed with the E195K mutation in vitro led us to hypothesize that in this case, perhaps a hydrophobic interaction between the Lys113 and Lys195 side chains was providing a stabilizing interaction in vitro that substituted for the ionic interaction normally present. As stated earlier, there is ample evidence in the literature that such interactions can occur due to the hydrophobic nature of the four methylene carbons in the lysine side chain (31, 32). Furthermore, the pKa values of lysine amino groups can vary over 5 orders of magnitude, so charge repulsion problems could easily be dampened, especially if the ends of the lysine side chains were pointing in opposite directions. Molecular modeling using PyMOL, version 1.0.5.4 (Schrödinger, LLC, New York) (Fig. 11) demonstrates that a lysine-lysine interaction can clearly be accommodated and that the charges would be facing away from one another.
FIGURE 11.

Structure of a possible Lys113 (blue)/Lys195 (red) interstrand hydrophobic interaction in E195K actin. The structure, based on the Oda actin dimer model, was generated using PyMOL, version 1.5.0.4. The interaction displayed is energetically allowable according to the modeling program.
If such a stabilizing interaction existed, decreasing the hydrophobicity of one of the residues should result in destabilization of the filament. This is exactly what we observed with a K113A mutation: an increased critical concentration for polymerization and an increased nucleation phase in in vitro polymerization experiments. Less consistent with our hypothesis is the relatively weak effect caused by the E195A mutation. This asymmetric effect was also observed with the original K113E and E195K mutations.
In vivo, we observed the same asymmetry with the two mutations to Ala. The K113A mutation produced more striking effects than the E195A mutation. Evidently, there is enough conformational flexibility in the area of residue 195 to allow for alternative stabilizing interactions in the absence of the original Glu195, although presently we cannot define what these might be.
A comparison of the E195K, E195A, and E/K double mutant actins, in terms of filament lengths, leads to intriguing results. Compared with WT actin, the E195K actin filaments are longer, whereas the E195A and E/K filaments are shorter. All exhibit approximately the same gross stability in terms of critical concentration. Our kinetics results suggest that the longer E195K filaments arise because of annealing of filament fragments, and this behavior apparently translates to more pronounced filament bundles in vivo. For the other two mutants, the E/K mutant actin exhibits faster nucleation but slower elongation, whereas the E195A actin shows slower nucleation but faster elongation, producing similar overall kinetics behavior for both actins. Thus, aside from providing cross-strand interactions that lead to overall filament stabilization, they individually cause changes in localized filament conformation that can differentially affect filament dynamics.
Our earlier work with R256H actin indicated that a mutation in the center of the actin filament could cause a propagated change in conformation to the outside of the filament, thereby affecting actin's interaction with regulatory proteins, in this case formin (13). We proposed that this propagation occurred through a system of amino acids, including residues 256 and 195 of one monomer and extending from residue 113 of the opposing monomer, leading ultimately to the filament surface (Fig. 1). If these residues work together as a structural module in transmitting these propagated changes, the effects caused by one mutation in the system might be expected to be reproduced by changes at another site in the system as well. This prediction was borne out by our results with the studies of Bni1 FH1-FH2 fragment-mediated actin polymerizations. The K113E mutation gave rise to the same type of apparent barbed end filament capping by the Bni1p fragment that we detected with R256H mutant actin but with an even stronger impact, and this aberrant behavior was rescuable by reestablishing the ionic interaction with residue 195 in the reverse orientation. We also detected an effect on Bni1p by the E195K interaction, although it was much less pronounced. This result is consistent with our hypothesis that in this mutant, a hydrophobic interaction partially replaced the normal ionic interaction, keeping the coupled system across the interstrand filament cleft largely intact.
A surprising result of our work was the fact that with K113E actin, the effect of the mutation on actin's interaction with the Bnr1p formin was very different from with Bni1p. Bnr1p actually promoted polymerization of this mutant actin at low concentrations and led to filament bundle formation at higher concentrations instead of inhibiting polymerization as did Bni1p. Our previous results with the Bni1p-R256H mutant actin (13) together with those presented here suggest that altering the 113–195 interaction produces propagated changes that affect the formin binding sites on the filament surface and that these changes ultimately affect Bni1p function much more adversely than Bnr1p. This differential effect might be explained in part by our previous work (7), which showed that Bnr1p can, itself, impart changes on the filament conformation that Bni1p cannot. Perhaps Bnr1p partially reverses the disruptive changes of the altered 113–195 interaction, leading to a more normal actin-formin interaction. These results further demonstrate that the interaction of the two formins with the actin filament surface can be very different, perhaps providing insight into the reason that Bnr1p seems to be a more efficient filament promoter than Bni1p with WT actin.
Our proposed system for transmitting propagated changes from residue 256 through a 195–113 interaction to the filament surface also involves 114, 115, 116, 117, and 118, the latter of which is on the filament surface near binding sites for formin and Arp2/3 (12, 33, 34). This model is further substantiated by the recent finding that in the crystal structure of an actin-formin FMNL3 FH2 complex, residue Asn575 on one of the FH2 monomers and Asp798 on the other may form a hydrogen bond interaction with Lys118 on the actin (35). Residue 256 is in the region of the binding site for the cofilin activator Aip1p, based on yeast two-hybrid studies (36). Thus, this system of residues, if it works as we predict, could be intimately involved in the regulation of filament dynamics by proteins that promote both filament assembly and disassembly. This assertion is based on the fact that if propagated changes work in one direction through this system, they must work equally well in the opposite direction due to thermodynamic linkage. Further credence for our hypothesis comes from the work of Nyitrai and colleagues (5, 6) and Bugyi and Carlier (37). They showed that formin binding to the filament barbed end can cause a propagated conformational change involving 160 actin monomers that results in altered filament susceptibility to severing by cofilin. They further demonstrated that this conformational change involved an alteration in the environment of the C-terminal actin helix. Within our system, residue 116 lies adjacent to a fragment containing residues 370–372 in this C-terminal helix, in agreement with their data. This system might also provide an explanation for the results of Reisler and colleagues (3), who showed that myosin binding to the filament exterior caused allosteric changes in the area of residue 256 of actin.
Particularly striking is the fact that almost every one of these positions in this postulated regulatory helix is the site of a mutation that leads to a human disease (Fig. 12). Two mutations at residue 118 in γ-nonmuscle actin lead to early onset deafness (38, 39). Mutations in α-smooth muscle actin at positions 115, 116, and 256 lead to the development of aortic aneurysms (40). A mutation in γ-nonmuscle actin at this position causes Baraitser-Winter syndrome, as does a mutation at residue 196 (41). A mutation at residue 113 in α-skeletal muscle actin causes a nemaline myopathy. A mutation in β-nonmuscle actin at residue 117 gives rise to a Baraitser-Winter-like syndrome.3 Finally, as stated above, residue 116 abuts residue 370 near the actin C terminus, and mutations at this site in α-skeletal muscle actin cause a nemaline myopathy (42), whereas a mutation here in γ-nonmuscle actin leads to deafness (39). This concentration of pathogenic mutations in this hypothetical module may shed light on how these mutations lead to disease. Instead of viewing each of the mutations as individual disease entities with individual sets of symptoms, our results suggest that the diseases may all stem from a similar dysregulation of actin filament dynamics that produces different diseases based on the particular actin isoforms in which the mutations occur and the physiological roles of the tissues in which these actin isoforms are localized.
FIGURE 12.

The locations of mutated actin residues linked to various diseases. The locations of the 113–126 helix (blue), Lys113 (marine), Asn115 (salmon red), Arg116 (green), Glu117 (yellow), Lys118 (magenta), Val370 (cyan), His371 (red), Arg372 (brown), Arg196 (purple), and R256H (orange) are highlighted in an F-actin dimer (based on the Oda model and using PyMOL, version 1.5.0.4, to render images) on the right, and the amplification of the region of interest is shown on the left.
Acknowledgment
We thank Dr. Cho-Yin Lee for suggestions in the early stages of this project.
This work was supported, in whole or in part, by National Institutes of Health Grant DC8803 (to P. A. R.).
Johnston, J. J., Wen, K. K., Keppler-Noreuil, K., McKane, M., Maiers, J. L., Greiner, A., Sapp, J. C., NIH Intramural Sequencing Center, Demali, K. A., Rubenstein, P. A., and Biesecker, L. G. (2013) Hum. Mutat., in press.
- TIRF
- total internal reflection fluorescence
- E/K
- K113E/E195K.
REFERENCES
- 1. Yin H. L., Stossel T. P. (1979) Control of cytoplasmic actin gel-sol transformation by gelsolin, a calcium-dependent regulatory protein. Nature 281, 583–586 [DOI] [PubMed] [Google Scholar]
- 2. Galkin V. E., Orlova A., VanLoock M. S., Shvetsov A., Reisler E., Egelman E. H. (2003) ADF/cofilin use an intrinsic mode of F-actin instability to disrupt actin filaments. J. Cell Biol. 163, 1057–1066 [DOI] [PMC free article] [PubMed] [Google Scholar]
- 3. Oztug Durer Z. A., Kamal J. K., Benchaar S., Chance M. R., Reisler E. (2011) Myosin binding surface on actin probed by hydroxyl radical footprinting and site-directed labels. J. Mol. Biol. 414, 204–216 [DOI] [PMC free article] [PubMed] [Google Scholar]
- 4. Bugyi B., Papp G., Hild G., Lõrinczy D., Nevalainen E. M., Lappalainen P., Somogyi B., Nyitrai M. (2006) Formins regulate actin filament flexibility through long range allosteric interactions. J. Biol. Chem. 281, 10727–10736 [DOI] [PMC free article] [PubMed] [Google Scholar]
- 5. Papp G., Bugyi B., Ujfalusi Z., Barkó S., Hild G., Somogyi B., Nyitrai M. (2006) Conformational changes in actin filaments induced by formin binding to the barbed end. Biophys. J. 91, 2564–2572 [DOI] [PMC free article] [PubMed] [Google Scholar]
- 6. Ujfalusi Z., Barkó S., Hild G., Nyitrai M. (2010) The effects of formins on the conformation of subdomain 1 in actin filaments. J. Photochem. Photobiol. B 98, 7–11 [DOI] [PMC free article] [PubMed] [Google Scholar]
- 7. Wen K.-K., Rubenstein P. A. (2009) Differential Regulation of Actin Polymerization and Structure by Yeast Formin Isoforms. J. Biol. Chem. 284, 16776–16783 [DOI] [PMC free article] [PubMed] [Google Scholar]
- 8. Fujii T., Iwane A. H., Yanagida T., Namba K. (2010) Direct visualization of secondary structures of F-actin by electron cryomicroscopy. Nature 467, 724–728 [DOI] [PubMed] [Google Scholar]
- 9. Galkin V. E., Orlova A., Schröder G. F., Egelman E. H. (2010) Structural polymorphism in F-actin. Nat. Struct. Mol. Biol. 17, 1318–1323 [DOI] [PMC free article] [PubMed] [Google Scholar]
- 10. Lorenz M., Poole K. J., Popp D., Rosenbaum G., Holmes K. C. (1995) An atomic model of the unregulated thin filament obtained by x-ray fiber diffraction on oriented actin-tropomyosin gels. J. Mol. Biol. 246, 108–119 [DOI] [PubMed] [Google Scholar]
- 11. Oda T., Iwasa M., Aihara T., Maéda Y., Narita A. (2009) The nature of the globular- to fibrous-actin transition. Nature 457, 441–445 [DOI] [PubMed] [Google Scholar]
- 12. Rouiller I., Xu X. P., Amann K. J., Egile C., Nickell S., Nicastro D., Li R., Pollard T. D., Volkmann N., Hanein D. (2008) The structural basis of actin filament branching by the Arp2/3 complex. J. Cell Biol. 180, 887–895 [DOI] [PMC free article] [PubMed] [Google Scholar]
- 13. Malloy L. E., Wen K. K., Pierick A. R., Wedemeyer E. W., Bergeron S. E., Vanderpool N. D., McKane M., Rubenstein P. A., Bartlett H. L. (2012) Thoracic aortic aneurysm (TAAD)-causing mutation in actin affects formin regulation of polymerization. J. Biol. Chem. 287, 28398–28408 [DOI] [PMC free article] [PubMed] [Google Scholar]
- 14. Rubenstein P. A. (1990) The functional importance of multiple actin isoforms. BioEssays 12, 309–315 [DOI] [PubMed] [Google Scholar]
- 15. Wen K.-K., McKane M., Stokasimov E., Fields J., Rubenstein P. A. (2010) A potential yeast actin allosteric conduit dependent on hydrophobic core residues Val-76 and Trp-79. J. Biol. Chem. 285, 21185–21194 [DOI] [PMC free article] [PubMed] [Google Scholar]
- 16. Schindelin J., Arganda-Carreras I., Frise E., Kaynig V., Longair M., Pietzsch T., Preibisch S., Rueden C., Saalfeld S., Schmid B., Tinevez J. Y., White D. J., Hartenstein V., Eliceiri K., Tomancak P., Cardona A. (2012) Fiji. An open-source platform for biological-image analysis. Nat. Methods 9, 676–682 [DOI] [PMC free article] [PubMed] [Google Scholar]
- 17. McKane M., Wen K. K., Meyer A., Rubenstein P. A. (2006) Effect of the substitution of muscle actin-specific subdomain 1 and 2 residues in yeast actin on actin function. J. Biol. Chem. 281, 29916–29928 [DOI] [PubMed] [Google Scholar]
- 18. García-Rodríguez L. J., Gay A. C., Pon L. A. (2007) Puf3p, a Pumilio family RNA binding protein, localizes to mitochondria and regulates mitochondrial biogenesis and motility in budding yeast. J. Cell Biol. 176, 197–207 [DOI] [PMC free article] [PubMed] [Google Scholar]
- 19. Boldogh I. R., Fehrenbacher K. L., Yang H.-C., Pon L. A. (2005) Mitochondrial movement and inheritance in budding yeast. Gene 354, 28–36 [DOI] [PubMed] [Google Scholar]
- 20. Moseley J. B., Goode B. L. (2005) Differential activities and regulation of Saccharomyces cerevisiae formin proteins Bni1 and Bnr1 by Bud6. J. Biol. Chem. 280, 28023–28033 [DOI] [PubMed] [Google Scholar]
- 21. Louis-Jeune C., Andrade-Navarro M. A., Perez-Iratxeta C. (2011) Prediction of protein secondary structure from circular dichroism using theoretically derived spectra. Proteins 80, 374–381 [DOI] [PubMed] [Google Scholar]
- 22. Strzelecka-Gołaszewska H., Moraczewska J., Khaitlina S. Y., Mossakowska M. (1993) Localization of the tightly bound divalent-cation-dependent and nucleotide-dependent conformation changes in G-actin using limited proteolytic digestion. Eur. J. Biochem. 211, 731–742 [DOI] [PubMed] [Google Scholar]
- 23. Kruth K. A., Rubenstein P. A. (2012) Two deafness-causing (DFNA20/26) actin mutations affect Arp2/3-dependent actin regulation. J. Biol. Chem. 287, 27217–27226 [DOI] [PMC free article] [PubMed] [Google Scholar]
- 24. Kuhn J. R., Pollard T. D. (2005) Real-time measurements of actin filament polymerization by total internal reflection fluorescence microscopy. Biophys. J. 88, 1387–1402 [DOI] [PMC free article] [PubMed] [Google Scholar]
- 25. Buzan J. M., Frieden C. (1996) Yeast actin. Polymerization kinetic studies of wild type and a poorly polymerizing mutant. Proc. Natl. Acad. Sci. U.S.A. 93, 91–95 [DOI] [PMC free article] [PubMed] [Google Scholar]
- 26. Wen K.-K., Rubenstein P. A. (2003) Biochemical consequences of the cardiofunk (R177H) mutation in yeast actin. J. Biol. Chem. 278, 48386–48394 [DOI] [PubMed] [Google Scholar]
- 27. Buttery S. M., Yoshida S., Pellman D. (2007) Yeast formins Bni1 and Bnr1 utilize different modes of cortical interaction during the assembly of actin cables. Mol. Biol. Cell 18, 1826–1838 [DOI] [PMC free article] [PubMed] [Google Scholar]
- 28. Lee C.-Y., Lou J., Wen K.-K., McKane M., Eskin S. G., Ono S., Chien S., Rubenstein P. A., Zhu C., McIntire L. V. (2013) Actin depolymerization under force is governed by lysine 113:glutamic acid 195-mediated catch-slip bonds. Proc. Natl. Acad. Sci. U.S.A. 110, 5022–5027 [DOI] [PMC free article] [PubMed] [Google Scholar]
- 29. Sahoo N., Beatty W., Heuser J., Sept D., Sibley L. D. (2006) Unusual kinetic and structural properties control rapid assembly and turnover of actin in the parasite Toxoplasma gondii. Mol. Biol. Cell 17, 895–906 [DOI] [PMC free article] [PubMed] [Google Scholar]
- 30. Stokasimov E., McKane M., Rubenstein P. A. (2008) Role of intermonomer ionic bridges in the stabilization of the actin filament. J. Biol. Chem. 283, 34844–34854 [DOI] [PMC free article] [PubMed] [Google Scholar]
- 31. Ishikita H. (2010) Origin of the pKa shift of the catalytic lysine in acetoacetate decarboxylase. FEBS Lett. 584, 3464–3468 [DOI] [PubMed] [Google Scholar]
- 32. Schmidt D. E., Jr., Westheimer F. H. (1971) PK of the lysine amino group at the active site of acetoacetate decarboxylase. Biochemistry 10, 1249–1253 [DOI] [PubMed] [Google Scholar]
- 33. Goley E. D., Rammohan A., Znameroski E. A., Firat-Karalar E. N., Sept D., Welch M. D. (2010) An actin-filament-binding interface on the Arp2/3 complex is critical for nucleation and branch stability. Proc. Natl. Acad. Sci. U.S.A. 107, 8159–8164 [DOI] [PMC free article] [PubMed] [Google Scholar]
- 34. Goode B. L., Eck M. J. (2007) Mechanism and function of formins in the control of actin assembly. Annu. Rev. Biochem. 76, 593–627 [DOI] [PubMed] [Google Scholar]
- 35. Thompson M. E., Heimsath E. G., Gauvin T. J., Higgs H. N., Kull F. J. (2013) FMNL3 FH2-actin structure gives insight into formin-mediated actin nucleation and elongation. Nat. Struct. Mol. Biol. 20, 111–118 [DOI] [PMC free article] [PubMed] [Google Scholar]
- 36. Clark M. G., Amberg D. C. (2007) Biochemical and genetic analyses provide insight into the structural and mechanistic properties of actin filament disassembly by the Aip1p cofilin complex in Saccharomyces cerevisiae. Genetics 176, 1527–1539 [DOI] [PMC free article] [PubMed] [Google Scholar]
- 37. Bugyi B., Carlier M. F. (2010) Control of actin filament treadmilling in cell motility. Annu. Rev. Biophys. 39, 449–470 [DOI] [PubMed] [Google Scholar]
- 38. Morin M., Bryan K. E., Mayo-Merino F., Goodyear R., Mencía A., Modamio-Høybjør S., del Castillo I., Cabalka J. M., Richardson G., Moreno F., Rubenstein P. A., Moreno-Pelayo M. A. (2009) In vivo and in vitro effects of two novel γ-actin (ACTG1) mutations that cause DFNA20/26 hearing impairment. Hum. Mol. Genet. 18, 3075–3089 [DOI] [PMC free article] [PubMed] [Google Scholar]
- 39. Zhu M., Yang T., Wei S., DeWan A. T., Morell R. J., Elfenbein J. L., Fisher R. A., Leal S. M., Smith R. J., Friderici K. H. (2003) Mutations in the γ-actin gene (ACTG1) are associated with dominant progressive deafness (DFNA20/26). Am. J. Hum. Genet. 73, 1082–1091 [DOI] [PMC free article] [PubMed] [Google Scholar]
- 40. Guo D. C., Papke C. L., Tran-Fadulu V., Regalado E. S., Avidan N., Johnson R. J., Kim D. H., Pannu H., Willing M. C., Sparks E., Pyeritz R. E., Singh M. N., Dalman R. L., Grotta J. C., Marian A. J., Boerwinkle E. A., Frazier L. Q., LeMaire S. A., Coselli J. S., Estrera A. L., Safi H. J., Veeraraghavan S., Muzny D. M., Wheeler D. A., Willerson J. T., Yu R. K., Shete S. S., Scherer S. E., Raman C. S., Buja L. M., Milewicz D. M. (2009) Mutations in smooth muscle α-actin (ACTA2) cause coronary artery disease, stroke, and Moyamoya disease, along with thoracic aortic disease. Am. J. Hum. Genet. 84, 617–627 [DOI] [PMC free article] [PubMed] [Google Scholar]
- 41. Rivière J.-B., van Bon B. W., Hoischen A., Kholmanskikh S. S., O'Roak B. J., Gilissen C., Gijsen S., Sullivan C. T., Christian S. L., Abdul-Rahman O. A., Atkin J. F., Chassaing N., Drouin-Garraud V., Fry A. E., Fryns J.-P., Gripp K. W., Kempers M., Kleefstra T., Mancini G. M., Nowaczyk M. J., van Ravenswaaij-Arts C. M., Roscioli T., Marble M., Rosenfeld J. A., Siu V. M., de Vries B. B., Shendure J., Verloes A., Veltman J. A., Brunner H. G., Ross M. E., Pilz D. T., Dobyns W. B. (2012) De novo mutations in the actin genes ACTB and ACTG1 cause Baraitser-Winter syndrome. Nat. Genet. 44, 440–444 [DOI] [PMC free article] [PubMed] [Google Scholar]
- 42. Laing N. G., Dye D. E., Wallgren-Pettersson C., Richard G., Monnier N., Lillis S., Winder T. L., Lochmüller H., Graziano C., Mitrani-Rosenbaum S., Twomey D., Sparrow J. C., Beggs A. H., Nowak K. J. (2009) Mutations and polymorphisms of the skeletal muscle α-actin gene (ACTA1). Hum. Mutat. 30, 1267–1277 [DOI] [PMC free article] [PubMed] [Google Scholar]