

Abstract
The organization of the keratin intermediate filament cytoskeleton is closely linked to epithelial function. To study keratin network plasticity and its regulation at different levels, tools are needed to localize and measure local network dynamics. In this paper, we present image analysis methods designed to determine the speed and direction of keratin filament motion and to identify locations of keratin filament polymerization and depolymerization at subcellular resolution. Using these methods, we have analyzed time-lapse fluorescence recordings of fluorescent keratin 13 in human vulva carcinoma-derived A431 cells. The fluorescent keratins integrated into the endogenous keratin cytoskeleton, and thereby served as reliable markers of keratin dynamics. We found that increased times after seeding correlated with down-regulation of inward-directed keratin filament movement. Bulk flow analyses further revealed that keratin filament polymerization in the cell periphery and keratin depolymerization in the more central cytoplasm were both reduced. Treating these cells and other human keratinocyte-derived cells with EGF reversed all these processes within a few minutes, coinciding with increased keratin phosphorylation. These results highlight the value of the newly developed tools for identifying modulators of keratin filament network dynamics and characterizing their mode of action, which, in turn, contributes to understanding the close link between keratin filament network plasticity and epithelial physiology.
Keywords: keratin filament turnover, keratin filament assembly, keratin filament disassembly, growth factor, live cell imaging
Mechanical properties of cells and tissues are determined by the cytoskeleton, which consists of complex filament networks. Among these networks, the intermediate filament-based network of epithelial cells is the most diverse. More than 50 keratin intermediate filament (KF) polypeptides are expressed in specific combinations in different epithelial cell types. Their importance for epithelial homeostasis is underscored by functions that go beyond cell mechanics as a basis of migration and tissue formation, and contribute to organelle trafficking, protein translation, signaling, immune response, and cell survival (1–4).
The continuous inward-directed movement of KFs and the repetitive cycles of KF assembly in the cell periphery and KF disassembly in the more central cytoplasm are striking features of the keratin network in cultured cells (2, 3, 5). These features were determined from time-lapse recordings of fluorescent protein-labeled keratins, fluorescence recovery after photobleaching (FRAP) experiments, and photoactivation analyses (6, 7). It has been suggested that keratin cycling is needed to establish cell type-specific network architecture and that keratin cycling supports network remodeling while maintaining network integrity, for example, during wound healing and differentiation (2, 5). The regulatory factors affecting keratin cycling and the parts of the cycle subject to regulation are unknown. A major challenge has been the shortage of sensitive image analysis tools for assessing keratin network dynamics in quantitative terms at subcellular resolution. Such sensitive tools are especially important in light of the minute and often variable changes occurring in response to various signals at the single-cell level.
We have designed image analysis tools to meet these existing challenges. In this paper, we demonstrate that these tools provide more information than FRAP experiments and are suitable for quantification of KF motion and for the assessment of keratin polymerization/depolymerization in specific subcellular regions. In testing the hypothesis that tight substratum attachment and growth factors affect keratin cycling, we found that the newly developed methods are sensitive enough to reveal significant changes in directed keratin movement and turnover depending on time after seeding and EGF stimulation.
Results
Measurement of Keratin Turnover by FRAP.
FRAP and photoactivation are standard methods for examining dynamics of fluorescent protein-labeled structures. A major problem with these approaches for the KF system has been the high degree of variability between different cells and culture conditions (6–8). To obtain reproducible results, we used defined cells and protocols to standardize imaging conditions. Only passages 16–30 of the clonal and well-characterized human vulva carcinoma-derived A431 cell line AK13-1 producing human keratin 13 (HK13)-EGFP were used (7, 9–13). We seeded 55,000 cells per cm2 onto glass-bottom dishes coated with a laminin-332–containing matrix (14), grew them in standard medium with FCS for 1 h, and then transferred them to medium without FCS. Cells were markedly more dynamic at early time points after seeding than at late time points (Movie S1). To examine whether this was also reflected in KF dynamics, single cells were subjected to FRAP analyses. One-half of each cell was bleached, and translocation of fluorescence from the unbleached part was subsequently monitored (Fig. 1). A total of 20.2 ± 0.7% fluorescence was translocated 25 min after bleaching in cells (n = 44) 24–33 h after seeding, whereas only 12.9 ± 0.6% was translocated in cells (n = 46) 48–57 h after seeding (P < 0.001). This indicated that the rate of KF assembly from the soluble pool, and hence keratin cycling, decelerates with increasing culture times.
Fig. 1.

Reduced FRAP in AK13-1 cells producing fluorescent HK13 at increased times after seeding. Cells were grown for either 24–33 h (early) or 48–57 h (late) before bleaching. (A) Examples of fluorescence images (sum projections at a z-resolution of 0.7 μm) immediately after (0 min) and 25 min after bleaching are shown for early and late time points after seeding. The horizontal lines depict borders between bleached and unbleached regions. The cell circumference is also demarcated. Percentage values were defined as 0% for the bleached half (Upper) and as 100% for the unbleached half (Lower) immediately after bleaching. The percent decrease of fluorescence in the lower half after 25 min (precisely corresponding to the increase in fluorescence in the upper half) was then taken as a measure of keratin translocation. (B) Histograms show the relative fluorescence recovery after 25 min in bleached regions of cells at early (n = 44) and late (n = 46) time points after seeding. (Scale bar, 10 μm.)
Measurement of Keratin Filament Dynamics by Motion and Bulk Flow Analysis.
To examine whether reduced KF turnover is coupled to reduced KF motion, we developed methods for image analysis of time-lapse fluorescence recordings (Fig. 2, Upper). Culture conditions were identical to those used for FRAP experiments. HK13-EGFP fluorescence was recorded every 30 s for 15 min using laser intensity, which avoided bleaching. The 3D images in Fig. S1 and Movie S2 show that most of the fluorescence was contained within the focal plane next to the culture dish surface and only a small fraction was located above the nucleus. The plane next to the culture dish surface was therefore used for the image analyses presented in this paper. Images were denoised, and local KF motion was analyzed by means of a maximum a posteriori motion estimation assuming stable brightness and using the sum of squared differences as the data term and an elasticity model as the regularization term. The results retrieved from two single-cell recordings (Movie S3, Upper) are presented in Fig. 2A. The color-coded heat map (15) of local KF net movement in the cell examined 27 h after seeding (early) revealed areas of fast motion (up to 500 nm/min) in the cell periphery and regions of slow motion (<100 nm/min) in the cell center. In contrast, the KF motility heat map of a cell imaged 54 h after seeding (late; Fig. 2A, Right) showed reduced overall KF motion. Analysis of more cells (Fig. S2A and data not shown) further corroborated these results. The average speed of motion (Fig. 2B) measured in 50 cells at early time points after seeding was 165 ± 6.4 nm/min. It was significantly (P < 0.001) faster than the average speed of motion measured in 84 cells examined at late time points after seeding (108 ± 3.3 nm/min; Fig. 2B).
Fig. 2.

Reduced KF motion, polymerization, and depolymerization at increased times after seeding. Keratin dynamics were recorded by high-resolution laser scanning microscopy at 30-s intervals for 15 min in AK13-1 cells expressing fluorescent keratin 13 either at early (24–33 h) or late (48–57 h) time points after seeding. (Upper) Workflow is diagrammed as detailed in Materials and Methods. Denoising was performed using the method of Herberich et al. (15). Cell shape normalization was determined according to the method of Möhl et al. (39). Motion was determined according to the registration method of Herberich et al. (15) and the optimization of Komodakis and Tziritas (25) and Komodakis et al. (41). (A, Top) Derived color-coded speed heat maps of single cells at 27 h (early) and 54 h (late) after seeding. (Scale bar, 10 μm.) (Middle) Correction of cell shape by converting the image data into a normalized circular cell resulted in the heat maps shown. (Bottom) Averaging of multiple independently derived heat maps (n = 50 for early time points and n = 84 for late time points) led to the images depicted. (B) Histogram of the determined mean speeds of keratin motion in nonnormalized cells (nn) in nanometers per minute vs. normalized cells (n) in arbitrary units (au). Note that both methods detect a comparable and significant speed reduction at late time points after seeding (P < 0.0001). (C) Vector maps correspond to the speed heat maps shown in A. The speed of motion is represented by different vector lengths. (D) Detail of vector maps in C (Top). (E) Sources and sinks corresponding to regions of assembly and disassembly, respectively, in color codes that were calculated for the cells whose speed and vector maps are depicted in the corresponding images of A and C. (F) Histogram provides a comparison of sources/sinks in arbitrary units determined for nonnormalized and normalized fluorescence recordings. In both instances, sources/sinks decrease significantly (***P < 0.0001) with increasing time after seeding.
To improve comparability of the differently sized and shaped cells and, more importantly, to compensate for cell shape changes during recording and to allow topological mapping, image data were converted into idealized round cells (16). The individual cell borders were approximated from the fluorescence channel (details are provided in Fig. S3) and were morphed into a normalized circular cell (Movie S3, Lower). A drawback of the normalization procedure is that it occasionally depicts erroneous movement, for example, in contracting cells when contraction is faster than inward-directed keratin motility (sequence in Movie S3, Lower Left). The morphed cell images were then used to calculate motion heat maps. The results for the cells depicted in Fig. 2A (Top) are presented in Fig. 2A (Middle), revealing obvious differences, although the overall pattern is maintained (additional examples are provided in Fig. S2). The average speed of KF motion dropped by 44.5% in the normalized cells, whereas a 34.5% drop was determined for the nonnormalized cells (Fig. 2B). The normalized data were superimposed, thereby very clearly delineating regions of fast motion in a ring-shaped segment in the peripheral cytoplasm and regions of slow motion in the central perinuclear part of the cell (Fig. 2A, Bottom). This pattern was observed at early and late time points after seeding, although the speed was considerably slower at late time points.
Next, the direction of KF motion was investigated and visualized in vector maps (Fig. 2 C and D). Although it was sometimes difficult to discern a preferred direction of KF motion in single cells, especially at late time points after seeding, averaging normalized data from many cells showed that net KF motion was directed toward the center both at early and late time points after seeding (Fig. 2C, Bottom).
Despite the overall inward flow of keratins, a corresponding accumulation of keratin fluorescence was not observed in the cell center. This was further supported by recording of the entire cellular fluorescence in three dimensions for three hours, which showed that fluorescence was not subducted or channeled to a cryptic cellular site (Movie S2). These findings imply that sinks exist in the central cytoplasm to eliminate surplus material and that, conversely, sources exist in the peripheral cytoplasm to replenish keratin fluorescence. To localize and quantify these sources and sinks, we determined bulk flow rates by calculating the amount of fluorescence (i.e., fluorescence intensity) transported along the vector field and performed a mass balance computation. We assumed that fluorescence intensity is directly proportional to the amount of keratins. The results, presented as color-coded maps in Fig. 2E, depict sources in red/yellow, sinks in green/blue, and the absence of either in black. The differential distribution was best seen at early time points after seeding and most clearly visualized by averaging multiple measurements derived from normalized images. Sources were detected exclusively in a ring-shaped segment of the cell periphery and were separated by a zone lacking sources and sinks from another inner ring-shaped segment of sinks. The cell center corresponding to the nucleus and its surrounding KFs was also devoid of sources and sinks (black). As expected, although sources and sinks were reduced in cells imaged at late time points after seeding, their topology remained identical (Fig. 2 E and F). In addition, we determined the sum over all sources and the sum over all sinks within one cell. We found that they balanced each other out, which is in accordance with the model of keratin cycling.
Taken together, we interpret sources as regions of KF assembly, directed motion as transport of KFs toward the cell interior, and sinks as regions of KF disassembly. Furthermore, the absence of sources and sinks around the nucleus is in accordance with the reported stability of the perinuclear cage-like KF structure (2).
EGF Increases Keratin Filament Turnover.
EGF is an important regulator of epithelial physiology and has been suggested to affect KF network organization. However, observations have been contradictory and inconclusive, and they have not accounted for network dynamics (e.g., refs. 17–20). We therefore wanted to find out whether and how EGF affects the keratin cycle.
Adding 20 ng/mL EGF was sufficient to elicit transient EGF receptor (EGFR) phosphorylation in AK13-1 cells (Fig. S4) and subsequent phosphorylation of keratin 8 at serine 73 and serine 431 (Fig. S5). FRAP analyses performed 48–57 h after seeding revealed that fluorescence translocation was up-regulated immediately after adding EGF (Fig. 3).
Fig. 3.

EGF-induced increase of FRAP. AK13-1 cells synthesizing fluorescent keratin 13 were grown for 48–57 h after seeding in serum-free medium on laminin-332. Imaging medium containing either 20 ng/mL EGF or no EGF was then substituted immediately before photobleaching of cell halves (time point = 0 min). FRAP was subsequently monitored as a measure of keratin translocation. Approximately 10% of cells that showed considerable contraction (>10% decrease in contact area during recording) were excluded from the analyses. The histogram reveals that FRAP increased in the presence of EGF.
To compare the EGF effect directly on KF dynamics in the same cell, the newly developed image analysis tools for motion and bulk flow assessment were applied to time-lapse fluorescence recordings of AK13-1 cells 15 min before and 15 min after EGF addition (Movie S4). The resulting maps of speed, direction of motion, and bulk flow (Fig. 4) revealed increased inward motion of elevated KF assembly/disassembly in response to EGF either at the single-cell level or in averaged images of multiple normalized cells (n = 16). The average speed was increased from 110.8 ± 8.2 nm/min to 152.3 ± 10.9 nm/min in the presence of EGF, which corresponded to a 33.3 ± 7.7% increase in normalized cells (Fig. 4B). To test the specificity of the EGF response rigorously, cells were treated before EGF application with 1 μg/mL cetuximab, a well-characterized inhibitor of EGF signaling (21). This treatment prevented EGF-inducible EGFR phosphorylation (data not shown). Keratin motion was not significantly affected by EGF treatment under these conditions (Fig. S6). Finally, it was observed that on EGF treatment, the rate of KF assembly (corresponding to the rate of KF disassembly) increased by 40.4 ± 9.8% in nonnormalized cells and by 39.5 ± 9.5% in the normalized cell paradigm (Fig. 4F).
Fig. 4.

EGF-induced increase of keratin dynamics. AK13-1 cells expressing fluorescent keratin 13 were imaged by confocal laser scanning microscopy at 30-s intervals for 15 min before and for 15 min starting 3 min after addition of 20 ng/mL EGF. Image analysis was done as diagrammed in Fig. 2 and detailed in Materials and Methods. (A) Motion heat maps for a nonnormalized single cell (Top), the corresponding normalized cell (Middle), and the average of 16 normalized cells (Bottom). (Scale bar, 10 μm.) (B) Histogram depicts the relative increase in speed in comparison to the speed measured before EGF addition determined for either the nonnormalized recordings or the normalized recordings. No significant differences are detectable between the two methods. (C) Vector heat maps correspond to the speed maps depicted in A. (D) Higher magnification view is taken from C (Middle). The speed of motion is represented by different vector lengths. (E) Graphic representation of sources and sinks corresponds to the heat maps in A and the vector maps in C. (F) Histogram shows the overall increase of sources/sinks after addition of EGF. Zero percent corresponds to the level observed before EGF addition. Note that the measurements for the normalized and nonnormalized recordings do not differ.
To test the image analysis routine further for the analysis of other keratins in another cell type, a subclone of the human keratinocyte cell line HaCaT producing keratin 5-YFP was examined. We found that 20 ng/mL EGF increased the inward-directed speed of motion from 92.4 ± 12.0 nm/min to 184.2 ± 16.48 nm/min, corresponding to a 60.9% increase in the normalized cell paradigm, and that the rate of peripheral keratin assembly was increased by 178.1 ± 22.8% in the nonnormalized cells and by 91.5 ± 14.0% in the normalized cell paradigm (Fig. S7).
Discussion
Keratin networks are highly motile and subject to continuous cycles of assembly and disassembly in cultured cells (2, 5, 8, 22, 23). Visual inspection is an inadequate means for discerning changes in KF motion and turnover. We therefore developed image recording techniques and image analysis routines that are suitable for quantifying changes in keratin cycling in response to regulatory cues in single cells. We demonstrated that motion of KFs can be quantified and that locations of filament polymerization and depolymerization can be determined and measured at subcellular resolution. Using these tools, we found that rates of keratin transport, assembly, and disassembly are dependent on culture conditions and modulated by EGF.
Most previous data on KF motion were obtained by cumbersome manual tracking of handpicked conspicuous network features (8, 9, 24). This method was clearly insufficient for quantitatively mapping network dynamics in entire cells. Subsequently, the feasibility of automated image analysis for motion detection in cellular subdomains was explored, leading to promising results (6). To refine motion estimation and to cope with large image datasets, a nonrigid registration method was developed based on free-form deformations, which were efficiently optimized by discrete optimization techniques (25). The quantitative evaluation of this approach revealed that motion can be estimated with subvoxel precision. We would like to point out that these image analysis routines mainly picked up the motility of KFs within the network and that some of the very few and weakly fluorescent precursor particles generated near the cell border may not have been detected. Still, we find it remarkable that particles and KFs move toward the cell center at comparable speeds (7–9, 24, 26, 27), which indicates similar transport mechanisms. Emergence of particles, however, may have led to occasional small “jumps” in the normalization routine. Furthermore, our methods may have been confounded by certain types of keratin motility, such as sliding of subunits within filaments and branching of filaments, which, however, have not been described to date.
Application of the newly developed image analysis routines allowed reliable quantification of KF motion only when fluorescence recordings were performed under highly standardized conditions. The observed decreased keratin motion at increased time after seeding most likely reflects the transition from a motile phenotype to a sessile phenotype. This interpretation was further strengthened by the observation that EGF treatment known to induce cell motility (28) stimulated keratin motion when applied to cells that had acquired the more sessile phenotype. Another advantage of automated motion analysis was its ability to generate speed maps at subcellular resolution, which, however, showed considerable variation as a consequence of different cell shapes. To account for this problem and to compensate for cell contraction during recording, cell shapes were warped into normalized round cell shapes before motion analysis. This allowed speed heat maps derived from different cells to be averaged. It also offers the possibility to orient migrating cells along an anterior-posterior axis to examine differential keratin dynamics as predicted by the proposed model of inducible keratin cycling (2).
Another major advance of automated image analysis is the derivation of motion vector fields. All resulting vectors in the averaged maps derived from different situations point toward the cell center (Figs. 2C, 4C, and S7B). These observations provided conclusive evidence for the net, inward-directed keratin flux as proposed by the keratin cycle hypothesis. It may be attributed to participation of actin filaments and microtubules, together with their associated proteins (2, 24, 29). At the same time, intrinsic properties of the keratin cytoskeleton may be implicated. The unique tools described here will help identify the contribution of these different factors and identify determinants for the observed topography of motion.
We further demonstrated that the datasets from which the motion vector fields were determined can also be used to monitor bulk flow of keratin fluorescence. Sources and sinks of keratin flux density corresponding to regions where either KF assembly or disassembly predominates were localized and quantified in this way. This approach has several advantages over methods like FRAP and photoactivation used to characterize KF turnover in the past (6–8). Advantages include (i) generation of assembly/disassembly maps for entire cells, (ii) automated image processing without manual adjustments (e.g., for shape changes), (iii) reduced phototoxicity, and (iv) monitoring of changes in assembly/disassembly before and after drug treatment in the same cells. It should be kept in mind, however, that FRAP and photoactivation measure overall turnover of structures, whereas bulk flow analyses do not detect turnover of structures whose fluorescence remains the same over time but exchange subunits during the recording intervals. This means that not all the lateral subunit exchange of filaments captured by FRAP/photoactivation measurements may be included in the bulk flow analyses. However, the data obtained with the different methods are consistent with and support the proposed model of keratin cycling with KF assembly occurring primarily in the cell periphery, centripetal transport of newly synthesized filaments, and KF disassembly in the cell center (2, 3, 5). Even more importantly, both experimental settings provided evidence for regulation of keratin cycling, and hence for its physiological relevance. This interpretation is also reinforced by the observation that subunit exchange of KFs is substantially increased on shear stress in alveolar epithelial cells (23). Taking these observations together establishes a link between epithelial cell behavior and KF network dynamics affecting such diverse processes as migration, tissue morphogenesis, and stress response (2).
The sources of KFs are fed by both newly formed keratin particles that assemble into the peripheral network (6) and soluble subunits that are directly integrated into preexisting KFs (8, 30, 31). The relative contribution of each pool is difficult to assess from the current data. The source domain, however, extends beyond the keratin particle-rich region and includes the peripheral filament network, which indicates that the latter directly recruits substantial amounts of soluble keratin subunits. Extending previous attempts to localize KF disassembly (6), the bulk flow analyses uncovered a very clear pattern of KF disassembly in a defined circular region in the cell center, which surrounds an area without net flux of keratin subunits containing the previously described stable perinuclear cage (2).
In two situations (time after seeding and EGF treatment), highly significant differences were detected for both KF motion and turnover. The changes occurred without obvious alterations in overall keratin fluorescence intensity and network topology during the observation periods. These results strongly suggest that transport rates, assembly, and disassembly are all coregulated. The simplest explanation is that these different processes are dependent on the same regulatory mechanism. For example, keratin phosphorylation may serve such a function as indicated by the EGF-inducible increase in keratin phosphorylation and the numerous reports on phosphorylation-dependent alterations in assembly, disassembly, and protein interaction (22, 23, 32–35). Different upstream signals, such as cell–cell or cell–ECM adhesion, or growth factors, such as EGF, may therefore regulate keratin dynamics by the same mechanism. Furthermore, nesprin 3-anchored plectin has been identified as an important factor determining the nuclear KF network boundary (36), and focal adhesion-bound plectin isoforms may define the peripheral KF network boundary [vimentin is discussed by Burgstaller et al. (37)].
Automated image analysis methods like those presented in this paper are essential for understanding the many facets of dynamic keratin network behavior, which presents an amazing degree of complexity as determined by posttranslational modifications, keratin isotypes, signaling pathways, cell communication, cell mechanics, and pathogens.
Materials and Methods
Cloning, Cell Culture, and Immunoblot Analyses.
Details are provided in SI Materials and Methods.
Microscopy.
Live-cell imaging and FRAP experiments were performed at 37 °C on a laser scanning microscope (LSM 710 DUO), an oil objective (63×/1.40-N.A. DIC M27) and a climate chamber (all from Zeiss). Cells were imaged in glass-bottom dishes in HBSS medium containing nonessential amino acids, essential amino acids, GlutaMAX, and 25 mM Hepes [4-(2-hydroxyethyl)-1-piperazineethanesulfonic acid; all from Invitrogen]; 4.8 mM N-acetyl-l-cysteine (Sigma–Aldrich); and 0.35 g/mL sodium bicarbonate (Carl Roth), which was adjusted to pH 7.4 with HCl.
For motion analysis of HK13-EGFP, a 67 × 67-μm area was scanned with a 488-nm argon laser and 1% laser power (light control potentiometer set to standby) at a pixel dwell time of 12.6 μs. The pinhole was set to 2 airy units, and a 488/543 dichroic beam splitter was used. A photomultiplier tube was used to record the emitted light at 480–599 nm at a 16-bit range at a resolution of 1024 × 1024 pixels every 30 s. For motion analysis of HK5-YFP, 3.5% laser power was used and the emitted light was recorded at 505–599 nm.
FRAP analyses were done by bleaching cell halves and measuring subsequent translocation of fluorescence from the unbleached cell halves to the bleached cell halves. Details are given in SI Materials and Methods.
Image Analyses.
Software and user manual are provided at http://www.moca.rwth-aachen.de/pubs/2013_01/softwarepackage_KeraMove_KeraDyn.zip. In brief, the image analyses included the following steps.
Denoising.
Image corruption by noise leads to a granular, discontinuous appearance of the curvilinear KFs, preventing reliable measurement of KF motion. To reduce noise without blurring filaments, curvelet transform-based denoising was used (15, 38). Curvelets are ridge-like basis functions localized in space, frequency, and orientation. Hence, the curvelet transform yields a sparse representation of multidimensional images with line-like structures, such as KFs, allowing noise to be reduced by thresholding curvelet coefficients according to their magnitude. In brief, the Anscombe transform was used to stabilize the variance of the signal-dependent noise. Then, the curvelet coefficients were thresholded before computing the inverse curvelet transform and the inverse Anscombe transform to obtain the denoised image.
Cell shape normalization (optional).
The cell shape in each frame was transformed into an idealized circular unit cell (39). First, the cell contour was determined by thresholding a smoothed version of the original image. The whole cell was then shifted in a way such that the centroid was localized in the image center. Toward deforming the centered cell into a unit cell, the Cartesian image coordinates were transformed into polar coordinates and the contour radius was normalized. To obtain dense results on the discrete image grid, the actual deformation was performed as inverse warping.
Motion analysis.
Local KF motion was measured using a deformable registration algorithm (15, 40) based on free-form deformations. A deformation grid was superimposed on the image. Motion at the grid points was estimated by minimizing a criterion consisting of the sum of squared differences of the image intensities as a data term (bleaching was ensured to be negligible), and an elastic regularizer, which favors small over large deformations, was used to enforce smoothness in the motion field. To process the huge amount of data efficiently, the criterion was reformulated as a labeling problem and minimized with a graph cut-based discrete optimization algorithm (25, 41). To obtain a dense motion vector field, the motion vector at each pixel was determined by interpolation. For optimal graphical representation, 1,000 randomly selected vectors were displayed. Further, motion is estimated in a coarse-to-fine manner, where image resolution and grid resolution are successively refined to capture large and small motion efficiently. Quantitative evaluation revealed that KF motion was measured with subvoxel precision (15).
Keratin flux density computation.
Fluorescence intensity I is related to the keratin mass m within the volume of a voxel VVoxel via the protein mass density ρ = m/VVoxel. The information contained in the motion vector field v(x,t) was coupled with the mass density. Assuming the intensity to be proportional to the mass, the keratin flux density J at position x = (x,y,z)T and time t was approximated in arbitrary units as J(x,t) = I(x,t)v(x,t)/VVoxel (Eq. 1).
Turnover analysis.
Locations of KF polymerization or depolymerization can be determined by identification of the sources and sinks of the keratin flux density. Sources and sinks were found by measurement of the mass flow through a closed surface S or, according to the divergence theorem, by calculation of the volume integral of the divergence:  . The net outflow therefore equals the source strength in the volume V, indicating the amount of KF mass leaving V within a time unit. Descriptively, this represents a mass balance computation over the volume V. If the same amount of KF mass enters as leaves the volume, the net outflow is zero, and so is the source strength. No polymerization has taken place. If, in contrast, the net outflow is greater than zero, the volume contains a source; KF assembly has taken place. A negative net outflow stands for a sink.
We set the volume to V = 51 × 51 × 1 voxels so that the net outflow represents polymerization or depolymerization. If, however, the volume V is small compared with the filament diameter, mere filament motion (i.e., keratin transport) leads to sources and sinks in J. For example, a filament with vertical orientation that moves to the right leads to sinks at its left-hand border and to sources at its right-hand side. By choosing the volume to be large with respect to the filament diameter, sources and sinks due to mere transport by KF motion were eliminated and turnover was measured.
The absolute turnover rate is defined as 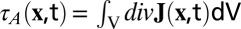 (Eq. 2). It was visualized as a turnover map, depicting the locations of KF polymerization and depolymerization. To obtain a smooth turnover map, we used a Gaussian smoothing over div
J(x,t). The partial derivatives in the divergence computation were calculated using separable optimized derivative filters (42).
(Eq. 2). It was visualized as a turnover map, depicting the locations of KF polymerization and depolymerization. To obtain a smooth turnover map, we used a Gaussian smoothing over div
J(x,t). The partial derivatives in the divergence computation were calculated using separable optimized derivative filters (42).
As a global measure, the absolute cellular assembly rate was defined as  (t) =
(t) = 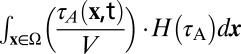 (Eq. 3) with the Heaviside step function
  to describe the assembly within the volume of a whole cell Ω.
Statistical analyses.
For each measurement series, the SEM is given as ±SEM. The Mann–Whitney test was used to calculate significance using Prism 5.01 (GraphPad Software).
Supplementary Material
Acknowledgments
We thank Dr. Harald Herrmann for keratin 5 cDNA, Dr. Nicole Schwarz for HaCaT B10 cells, and Dr. Bishr Omary for antibodies. We thank Dr. Nikos Komodakis for the permission to use FastPD and the Curvelet.org team for the permission to use the CurveLab toolbox. The work was supported by the German Research Council (Grant LE 566-18-1, Grant WI 1731/6-1, Grant WI 1731/8-1, and Grant AA 5/5-1). We dedicate this paper to Til Aach, who co-initiated this work. He is greatly missed since his untimely death in January 2012.
Footnotes
The authors declare no conflict of interest.
This article is a PNAS Direct Submission.
This article contains supporting information online at www.pnas.org/lookup/suppl/doi:10.1073/pnas.1306020110/-/DCSupplemental.
References
- 1.Pan X, Hobbs RP, Coulombe PA. The expanding significance of keratin intermediate filaments in normal and diseased epithelia. Curr Opin Cell Biol. 2013;25(1):47–56. doi: 10.1016/j.ceb.2012.10.018. [DOI] [PMC free article] [PubMed] [Google Scholar]
- 2.Windoffer R, Beil M, Magin TM, Leube RE. Cytoskeleton in motion: The dynamics of keratin intermediate filaments in epithelia. J Cell Biol. 2011;194(5):669–678. doi: 10.1083/jcb.201008095. [DOI] [PMC free article] [PubMed] [Google Scholar]
- 3.Haines RL, Lane EB. Keratins and disease at a glance. J Cell Sci. 2012;125(Pt 17):3923–3928. doi: 10.1242/jcs.099655. [DOI] [PubMed] [Google Scholar]
- 4.Omary MB, Ku NO, Strnad P, Hanada S. Toward unraveling the complexity of simple epithelial keratins in human disease. J Clin Invest. 2009;119(7):1794–1805. doi: 10.1172/JCI37762. [DOI] [PMC free article] [PubMed] [Google Scholar]
- 5.Leube RE, Moch M, Kölsch A, Windoffer R. “Panta rhei”: Perpetual cycling of the keratin cytoskeleton. BioArchitecture. 2011;1(1):39–44. doi: 10.4161/bioa.1.1.14815. [DOI] [PMC free article] [PubMed] [Google Scholar]
- 6.Kölsch A, Windoffer R, Würflinger T, Aach T, Leube RE. The keratin-filament cycle of assembly and disassembly. J Cell Sci. 2010;123(Pt 13):2266–2272. doi: 10.1242/jcs.068080. [DOI] [PubMed] [Google Scholar]
- 7.Windoffer R, Wöll S, Strnad P, Leube RE. Identification of novel principles of keratin filament network turnover in living cells. Mol Biol Cell. 2004;15(5):2436–2448. doi: 10.1091/mbc.E03-09-0707. [DOI] [PMC free article] [PubMed] [Google Scholar]
- 8.Yoon KH, et al. Insights into the dynamic properties of keratin intermediate filaments in living epithelial cells. J Cell Biol. 2001;153(3):503–516. doi: 10.1083/jcb.153.3.503. [DOI] [PMC free article] [PubMed] [Google Scholar]
- 9.Windoffer R, Leube RE. Detection of cytokeratin dynamics by time-lapse fluorescence microscopy in living cells. J Cell Sci. 1999;112(Pt 24):4521–4534. doi: 10.1242/jcs.112.24.4521. [DOI] [PubMed] [Google Scholar]
- 10.Windoffer R, Leube RE. De novo formation of cytokeratin filament networks originates from the cell cortex in A-431 cells. Cell Motil Cytoskeleton. 2001;50(1):33–44. doi: 10.1002/cm.1039. [DOI] [PubMed] [Google Scholar]
- 11.Strnad P, Windoffer R, Leube RE. In vivo detection of cytokeratin filament network breakdown in cells treated with the phosphatase inhibitor okadaic acid. Cell Tissue Res. 2001;306(2):277–293. doi: 10.1007/s004410100455. [DOI] [PubMed] [Google Scholar]
- 12.Strnad P, Windoffer R, Leube RE. Light-induced resistance of the keratin network to the filament-disrupting tyrosine phosphatase inhibitor orthovanadate. J Invest Dermatol. 2003;120(2):198–203. doi: 10.1046/j.1523-1747.2003.12038.x. [DOI] [PubMed] [Google Scholar]
- 13.Strnad P, Windoffer R, Leube RE. Induction of rapid and reversible cytokeratin filament network remodeling by inhibition of tyrosine phosphatases. J Cell Sci. 2002;115(Pt 21):4133–4148. doi: 10.1242/jcs.00096. [DOI] [PubMed] [Google Scholar]
- 14.Langhofer M, Hopkinson SB, Jones JC. The matrix secreted by 804G cells contains laminin-related components that participate in hemidesmosome assembly in vitro. J Cell Sci. 1993;105(Pt 3):753–764. doi: 10.1242/jcs.105.3.753. [DOI] [PubMed] [Google Scholar]
- 15.Herberich G, et al. Fluorescence microscopic imaging and image analysis of the cytoskeleton. Proceedings of the 44th Asilomar Conference on Signals, Systems and Computers: 2010:1359–1363. [Google Scholar]
- 16.Möhl C, et al. Becoming stable and strong: The interplay between vinculin exchange dynamics and adhesion strength during adhesion site maturation. Cell Motil Cytoskeleton. 2009;66(6):350–364. doi: 10.1002/cm.20375. [DOI] [PubMed] [Google Scholar]
- 17.Keski-Oja J, Lehto VP, Virtanen I. Keratin filaments of mouse epithelial cells are rapidly affected by epidermal growth factor. J Cell Biol. 1981;90(2):537–541. doi: 10.1083/jcb.90.2.537. [DOI] [PMC free article] [PubMed] [Google Scholar]
- 18.Baribault H, Blouin R, Bourgon L, Marceau N. Epidermal growth factor-induced selective phosphorylation of cultured rat hepatocyte 55-kD cytokeratin before filament reorganization and DNA synthesis. J Cell Biol. 1989;109(4 Pt 1):1665–1676. doi: 10.1083/jcb.109.4.1665. [DOI] [PMC free article] [PubMed] [Google Scholar]
- 19.Ku NO, Omary MB. Phosphorylation of human keratin 8 in vivo at conserved head domain serine 23 and at epidermal growth factor-stimulated tail domain serine 431. J Biol Chem. 1997;272(11):7556–7564. doi: 10.1074/jbc.272.11.7556. [DOI] [PubMed] [Google Scholar]
- 20.Chung BM, Murray CI, Van Eyk JE, Coulombe PA. Identification of novel interaction between annexin A2 and keratin 17: Evidence for reciprocal regulation. J Biol Chem. 2012;287(10):7573–7581. doi: 10.1074/jbc.M111.301549. [DOI] [PMC free article] [PubMed] [Google Scholar]
- 21.Harding J, Burtness B. Cetuximab: An epidermal growth factor receptor chemeric human-murine monoclonal antibody. Drugs Today (Barc) 2005;41(2):107–127. doi: 10.1358/dot.2005.41.2.882662. [DOI] [PubMed] [Google Scholar]
- 22.Flitney EW, Kuczmarski ER, Adam SA, Goldman RD. Insights into the mechanical properties of epithelial cells: The effects of shear stress on the assembly and remodeling of keratin intermediate filaments. FASEB J. 2009;23(7):2110–2119. doi: 10.1096/fj.08-124453. [DOI] [PMC free article] [PubMed] [Google Scholar]
- 23.Sivaramakrishnan S, Schneider JL, Sitikov A, Goldman RD, Ridge KM. Shear stress induced reorganization of the keratin intermediate filament network requires phosphorylation by protein kinase C zeta. Mol Biol Cell. 2009;20(11):2755–2765. doi: 10.1091/mbc.E08-10-1028. [DOI] [PMC free article] [PubMed] [Google Scholar]
- 24.Wöll S, Windoffer R, Leube RE. Dissection of keratin dynamics: Different contributions of the actin and microtubule systems. Eur J Cell Biol. 2005;84(2-3):311–328. doi: 10.1016/j.ejcb.2004.12.004. [DOI] [PubMed] [Google Scholar]
- 25.Komodakis N, Tziritas G. Approximate labeling via graph cuts based on linear programming. IEEE Trans Pattern Anal Mach Intell. 2007;29(8):1436–1453. doi: 10.1109/TPAMI.2007.1061. [DOI] [PubMed] [Google Scholar]
- 26.Kölsch A, Windoffer R, Leube RE. Actin-dependent dynamics of keratin filament precursors. Cell Motil Cytoskeleton. 2009;66(11):976–985. doi: 10.1002/cm.20395. [DOI] [PubMed] [Google Scholar]
- 27.Windoffer R, Kölsch A, Wöll S, Leube RE. Focal adhesions are hotspots for keratin filament precursor formation. J Cell Biol. 2006;173(3):341–348. doi: 10.1083/jcb.200511124. [DOI] [PMC free article] [PubMed] [Google Scholar]
- 28.Wells A, Kassis J, Solava J, Turner T, Lauffenburger DA. Growth factor-induced cell motility in tumor invasion. Acta Oncol. 2002;41(2):124–130. doi: 10.1080/028418602753669481. [DOI] [PubMed] [Google Scholar]
- 29.Helfand BT, Chang L, Goldman RD. Intermediate filaments are dynamic and motile elements of cellular architecture. J Cell Sci. 2004;117(Pt 2):133–141. doi: 10.1242/jcs.00936. [DOI] [PubMed] [Google Scholar]
- 30.Miller RK, Khuon S, Goldman RD. Dynamics of keratin assembly: Exogenous type I keratin rapidly associates with type II keratin in vivo. J Cell Biol. 1993;122(1):123–135. doi: 10.1083/jcb.122.1.123. [DOI] [PMC free article] [PubMed] [Google Scholar]
- 31.Miller RK, Vikstrom K, Goldman RD. Keratin incorporation into intermediate filament networks is a rapid process. J Cell Biol. 1991;113(4):843–855. doi: 10.1083/jcb.113.4.843. [DOI] [PMC free article] [PubMed] [Google Scholar]
- 32.Omary MB, Ku NO, Liao J, Price D. Keratin modifications and solubility properties in epithelial cells and in vitro. Subcell Biochem. 1998;31:105–140. [PubMed] [Google Scholar]
- 33.Ku NO, Omary MB. Keratins turn over by ubiquitination in a phosphorylation-modulated fashion. J Cell Biol. 2000;149(3):547–552. doi: 10.1083/jcb.149.3.547. [DOI] [PMC free article] [PubMed] [Google Scholar]
- 34.Ridge KM, et al. Keratin 8 phosphorylation by protein kinase C delta regulates shear stress-mediated disassembly of keratin intermediate filaments in alveolar epithelial cells. J Biol Chem. 2005;280(34):30400–30405. doi: 10.1074/jbc.M504239200. [DOI] [PubMed] [Google Scholar]
- 35.Busch T, et al. Keratin 8 phosphorylation regulates keratin reorganization and migration of epithelial tumor cells. J Cell Sci. 2012;125(Pt 9):2148–2159. doi: 10.1242/jcs.080127. [DOI] [PMC free article] [PubMed] [Google Scholar]
- 36.Wilhelmsen K, et al. Nesprin-3, a novel outer nuclear membrane protein, associates with the cytoskeletal linker protein plectin. J Cell Biol. 2005;171(5):799–810. doi: 10.1083/jcb.200506083. [DOI] [PMC free article] [PubMed] [Google Scholar]
- 37.Burgstaller G, Gregor M, Winter L, Wiche G. Keeping the vimentin network under control: Cell-matrix adhesion-associated plectin 1f affects cell shape and polarity of fibroblasts. Mol Biol Cell. 2010;21(19):3362–3375. doi: 10.1091/mbc.E10-02-0094. [DOI] [PMC free article] [PubMed] [Google Scholar]
- 38.Ma J, Plonka G. The curvelet transform. IEEE Signal Process Mag. 2010;27(2):118–133. [Google Scholar]
- 39.Möhl C, Kirchgessner N, Schäfer C, Hoffmann B, Merkel R. Quantitative mapping of averaged focal adhesion dynamics in migrating cells by shape normalization. J Cell Sci. 2012;125(Pt 1):155–165. doi: 10.1242/jcs.090746. [DOI] [PubMed] [Google Scholar]
- 40. Herberich G, Windoffer R, Leube R, Aach T (2010) 3D motion analysis of keratin filaments in living cells. SPIE Medical Imaging 2010: Image Processing 7623:76232B1-9.
- 41.Komodakis N, Tziritas G, Paragios N. Performance vs computational efficiency for optimizing single and dynamic MRFs: Setting the state of the art with primal-dual strategies. Comput Vis Image Underst. 2008;112(1):14–29. [Google Scholar]
- 42. Scharr H (2000) Optimale Operatoren in der Digitalen Bildverarbeitung (Ruprecht-Karls-Universität Heidelberg, Heidelberg). German.
Associated Data
This section collects any data citations, data availability statements, or supplementary materials included in this article.