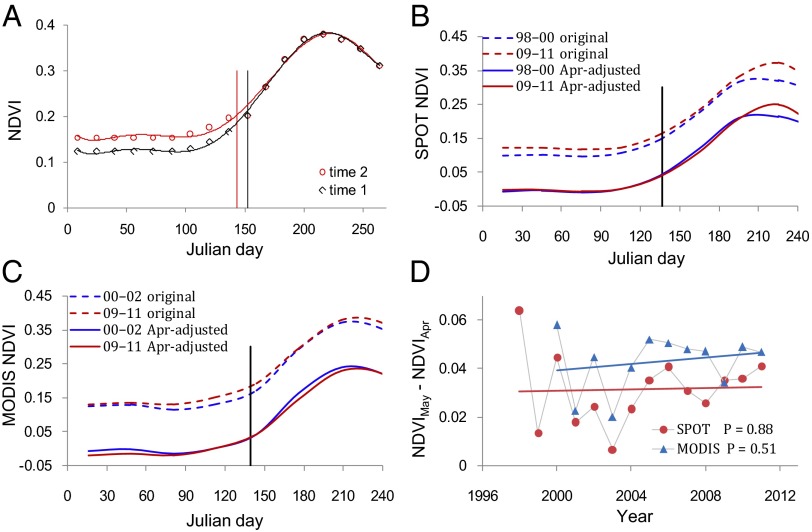
Zhang et al. (1) report that the green-up dates in the Tibetan Plateau (TP) have continuously advanced from 1982 to 2011. They retrieved green-up dates from the multiannual time-series of Normalized Difference Vegetation Index (NDVI) using the method proposed by Piao et al. (2). This method assumes that the nongrowing season NDVI values remain constant among the different years and thus requires sophisticated preprocess of the nongrowing season NDVI. Otherwise, the retrieved green-up dates by the step of polynomial fitting will be negatively biased (i.e., advanced) by the increase in the nongrowing season NDVI (Fig. 1A).
Fig. 1.
(A) A schematic diagram indicating that increase of nongrowing season NDVI leads to artificial advance of green-up dates (the difference between the black and red vertical lines). From time 1 to time 2, growing season NDVI almost does not change, but the nongrowing season NDVI systematically increases, which thus biases the derived green-up date toward advancing. (B) Annual curve of SPOT NDVI averaged for the earliest (2000–2002) and for the latest (2009–2011) three years. The label “Apr-adjusted” indicates that the annual NDVI values are subtracted by the April NDVI of the same year. The black vertical line indicates the mean green-up dates of 1998–2011 given in figure 1 of Zhang et al. (1). (C) Similar to B, but for MODIS NDVI. (D) Temporal changes in the difference of SPOT and MODIS NDVI between May and April (NDVIMay − NDVIApr). In B, C, and D, NDVI is averaged from all of the pixels of steppes and meadows on the Tibetan Plateau with growing season NDVI > 0.10.
As shown in Fig. 1B [also in figures S1 and S3 of Zhang et al. (1)], there is indeed an increase in the nongrowing season Système Pour l'Observation de la Terre (SPOT) NDVI for the steppes and meadows in the TP. After eliminating the impact of nongrowing season NDVI increase, we found no change of green-up dates in 2009–2011 compared with that in 1998–2000 (Fig. 1B). A similar result was also found using the Moderate Resolution Imaging Spectroradiometer (MODIS) NDVI data (Fig. 1C). Furthermore, because the green-up onset in the TP usually occurs in May and June during the period from 1998 to 2011 (1, 3, 4), the advance in green-up dates should result in an increase in the difference of NDVI between May and April, according to the method for retrieving green-up dates (2). However, such increase was not found in the NDVI datasets from both SPOT and MODIS (Fig. 1D). Therefore, so far, there is no evidence for the continuously advancing trend of green-up dates in the TP over the last decade. The continuously advancing trend of green-up dates revealed by Zhang et al. (1) is likely caused by not correcting for the increased nongrowing season NDVI.
Satellite-derived greenness vegetation indices provide a valuable way to retrieve spatially continuous information about phenological change and have been thus widely used to assess the influences of climatic changes on vegetation, especially in the TP (2, 4, 5), where field observations are scarce. However, satellite-derived phenology should be viewed with caution because vegetation indices are easily contaminated by adverse meteorological conditions and other factors, such as background changes, in particular during the green-up times when the signal from vegetation is weak.
Acknowledgments
This work is supported by a “Strategic Priority Research Program (B)” of the Chinese Academy of Sciences (Grant XDB03030404) and a fund from National Natural Science Foundation of China granted to M.S. (Grant 41201459).
Footnotes
The authors declare no conflict of interest.
References
- 1.Zhang G, Zhang Y, Dong J, Xiao X. Green-up dates in the Tibetan Plateau have continuously advanced from 1982 to 2011. Proc Natl Acad Sci USA. 2013;110(11):4309–4314. doi: 10.1073/pnas.1210423110. [DOI] [PMC free article] [PubMed] [Google Scholar]
- 2.Piao S, Fang JY, Zhou LM, Ciais P, Zhu B. Variations in satellite-derived phenology in China's temperate vegetation. Glob Change Biol. 2006;12(4):672–685. [Google Scholar]
- 3.Shen M. Spring phenology was not consistently related to winter warming on the Tibetan Plateau. Proc Natl Acad Sci USA. 2011;108(19):E91–E92, author reply E95. doi: 10.1073/pnas.1018390108. [DOI] [PMC free article] [PubMed] [Google Scholar]
- 4.Ding M, et al. Spatiotemporal variation in alpine grassland phenology in the Qinghai-Tibetan Plateau from 1999 to 2009. Chin Sci Bull. 2012;58(3):396–405. [Google Scholar]
- 5.Yu HY, Luedeling E, Xu JC. Winter and spring warming result in delayed spring phenology on the Tibetan Plateau. Proc Natl Acad Sci USA. 2010;107(51):22151–22156. doi: 10.1073/pnas.1012490107. [DOI] [PMC free article] [PubMed] [Google Scholar]


