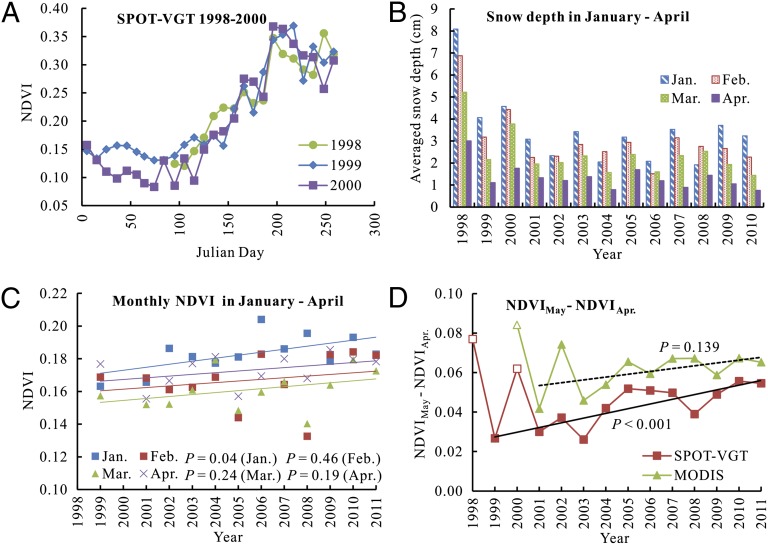
We appreciate the comments on our article (1) from Shen et al. (2). They raise the issue of whether the nongrowing season (NGS) Normalized Difference Vegetation Index (NDVI) could affect spring phenology as interpreted from time series NDVI data. To address it, they compared the NGS NDVIs of two separate periods (1998–2000 and 2009–2011) and found a higher 2009–2011 NGS NDVI than that of 1998–2000, which was considered to negatively (e.g., advanced) bias retrieved spring phenology results [figure 1 A and B in the letter (2)]. We found that the NGS NDVI increase from 1998–2000 to 2009–2011 was overused to represent the trend from 1998 to 2011 because of the effects of outliers in 1998 and 2000 (Fig. 1A). We used snow depth data derived from passive microwave remote sensing for the studied area (3) and found that snow depth from January to April was significantly higher in 1998 and 2000 (Fig. 1B). The El Niño Southern Oscillation (ENSO) event resulted in the most severe snow storm in the 1997/1998 winter across the Tibetan Plateau (4), which led to lower NGS NDVI from January to April in 1998. The La Niña in year 1999/2000 also resulted in big snow and lower NGS NDVI on the plateau in 2000 (Fig. 1B). Actually, the trends of the NDVIs in February, March, and April were not statistically significant when we removed the outliers in 1998 and 2000 (Fig. 1C). January NDVI increasing was significant. However, it will not affect start of the vegetation growing season (SOS) retrieval because all of the green-up dates happened after March on the plateau.
Fig. 1.
(A) SPOT-VGT NDVI dynamics in 1998, 1999, and 2000 in the Tibetan Plateau. (B) The averaged snow depths on the plateau in January, February, March, and April from 1998 to 2010. The snow depth data were derived from passive microwave remote-sensing data (3). The years 1998 and 2000 were exceptional years with dramatic snow events, which led to lower NGS NDVIs in 1998 and 2000 in A. The lower NGS NDVIs in the two years didn’t negatively bias the spring phenology estimate. Actually, the spring phenology in 1998 was identified as earlier than other years, e.g., 1999 [figure 1 of Zhang et al. (2)]. That may be because the higher temperature in the spring of 1998 converted big snowpack into abundant soil moisture and promoted vegetation growth. (C) Variations in January, February, March, and April NDVIs from 1999 to 2011, excluding 2000. We did not include 1998 and 2000 due to the outliers. The fitted linear regression lines with different colors represent the trends of monthly NDVIs. NDVIs in February to April didn’t show significant increase in this period. (D) Dynamics of May and April NDVI difference (NDVIMay − NDVIApr) for SPOT-VGT and MODIS. The averaged NDVIs from all of the vegetated pixels with NDVI > 0.1 in growing season were used. The fitted linear regression lines represent the trends of NDVIMay − NDVIApr with the outliers (nonfilled data point) in 1998 and 2000 being removed.
They conclude that no evidence existed for continued advancement of spring phenology on the plateau as they found the increasing trend in NDVIMay − NDVIApr during 1998–2011 was not significant [figure 1D of Shen et al. (2)]. As NDVI in April of 1998 and 2000 was substantially affected by big snow in those two years, NDVIMay − NDVIApr values were likely to be biased and could be considered outliers. When we removed the values in 1998 and 2000, NDVIMay − NDVIApr showed obvious increasing trends over time (Fig. 1D), which is consistent with the conclusion in our paper that spring phenology advanced (1). The trend is statistically significant for Système Pour l'Observation de la Terre vegetation (SPOT-VGT) NDVI but insignificant for Moderate Resolution Imaging Spectroradiometer (MODIS) data due to a shorter data range.
The different conclusions between Shen et al. (2) and our paper (1) suggest that statistical data analysis needs to have careful screening of data quality and identification of outlier data. The effects of snow cover on NGS NDVI and spring phenology are complicated, and vary with regions and local climates, which clearly affect the theory generalized in Fig. 1A of Shen et al. (2). In summary, the NGS NDVI has limited effects on our retrieval of spring phenology, which has been validated using in situ observed phenological data (1) as well as previous studies (5).
Footnotes
The authors declare no conflict of interest.
References
- 1.Zhang G, Zhang Y, Dong J, Xiao X. Green-up dates in the Tibetan Plateau have continuously advanced from 1982 to 2011. Proc Natl Acad Sci USA. 2013;110(11):4309–4314. doi: 10.1073/pnas.1210423110. [DOI] [PMC free article] [PubMed] [Google Scholar]
- 2.Shen M, et al. No evidence of continuously advanced green-up dates in the Tibetan Plateau over the last decade. Proc Natl Acad Sci USA. 2013;110:E2329. doi: 10.1073/pnas.1304625110. [DOI] [PMC free article] [PubMed] [Google Scholar]
- 3.Che T, Xin L, Jin R, Armstrong R, Zhang T. Snow depth derived from passive microwave remote-sensing data in China. Ann Glaciol. 2008;49(1):145–154. [Google Scholar]
- 4.Shaman J, Tziperman E. The effect of ENSO on Tibetan plateau snow depth: A stationary wave teleconnection mechanism and implications for the south Asian monsoons. J Clim. 2005;18(12):2067–2079. [Google Scholar]
- 5.Ding M, et al. Spatiotemporal variation in alpine grassland phenology in the Qinghai-Tibetan Plateau from 1999 to 2009. Chin Sci Bull. 2013;58(3):396–405. [Google Scholar]


