

Abstract
Purpose
The primary aim of this study was to quantitatively assess pulmonary radiation toxicity in patients who received thoracic radiotherapy combined with induction and/or concurrent chemotherapy with or without taxanes for esophageal cancer.
Materials/Methods
Subjects were 139 patients treated at The University of Texas M. D. Anderson Cancer Center for esophageal cancer and who had [18F]-fluorodeoxyglucose positron emission tomography/computed tomography imaging from November 1, 2003 to December 15, 2007, for disease restaging after chemoradiotherapy. Patients were grouped as having had (1) no taxanes, (2) induction or concurrent taxanes, and (3) both induction and concurrent taxanes. Clinical pulmonary toxicity was scored using the NCI Common Terminology Criteria for Adverse Events version 3. Linear regression was applied to the FDG uptake versus radiation dose to determine the pulmonary metabolic radiation response (PMRR) for each case. Clinical toxicity scores and PMRR among groups were evaluated for significance differences.
Results
The crude rates of pneumonitis symptoms were 46%, 62%, and 74% for groups 1, 2, and 3, respectively. The ANOVA test of log(PMRR) by treatment was significant (p=0.0046). Group 3 had 61% higher PMRR compared with group 1 (p=0.002). Group 2 had 38% higher PMRR compared with group 1 (p=0.015). Group 3 had 17% higher PMRR compared with group 2 (p=0.31). A PMRR enhancement ratio of 1.60 (95% CI: 1.19–2.14) was observed for group 3 versus group 1.
Conclusions
Patients given taxanes chemotherapy as induction and concurrent chemotherapy had significantly higher PMRR and clinical pneumonitis symptoms than did patients whose chemotherapy did not include taxanes.
Keywords: Radiation pneumonitis, taxanes, positron emission tomography
Introduction
Taxanes are plant-derived chemotherapy agents that are considered to be among the most effective anticancer drugs 1. Taxanes target tumors by both promoting microtubule assembly and inhibiting microtubule disassembly 2. Combination therapy with taxanes and radiation has been reported to be safe and effective for patients treated for various epithelial cell cancers including head-and-neck 1, esophagus 3, lung 1, and breast cancer 4. However, therapy with paclitaxel has been reported to cause hypersensitivity reactions 5. Respiratory symptoms may develop hours to weeks after paclitaxel administration. Symptom severity ranges from mild dyspnea to respiratory failure 5, 6. Radiation pneumonitis (RP), a serious and potentially fatal complication, has been reported in patients treated with thoracic irradiation combined with concurrent or sequential taxane-based chemotherapy. (RP reviewed in Ghafoori et al 7)
Investigations of the effect of taxanes on the incidence of RP have yielded conflicting findings. Taghian et al.8 retrospectively analyzed 41 patients who received paclitaxel with radiotherapy as part of their treatment for breast cancer. The crude rates of RP in that study were 14.6% with paclitaxel compared with 1.1% without the taxane therapy (p < 0.001). Hanna et al. 9 reported similar findings in this patient population. In subsequent study, Taghian et al.10 advocated a reduction in the volume of lung irradiated in breast cancer patient who receive paclitaxel to reduce the risk of RP to 1%. On the other hand, Yu et al. 11 reported that sequential adjuvant paclitaxel followed by radiotherapy for breast cancer was associated with a very low risk (4–5%) of clinically apparent pneumonitis which was comparable to that among patients treated without paclitaxel in a retrospective analysis of 189 evaluable patients prospectively randomized to receive treatment with or without paclitaxel. Both studies relied on patient reporting to generate the pneumonitis data, which introduces uncertainties into the analysis 12. An objective measure of RP response would remove the uncertainties in the assessment of taxane-based chemotherapy effect on lung toxicity, and may improve the sensitivity to detect difference in toxicity between patient groups.
RP is an inflammatory reaction within irradiated lung tissue in response to radiation injury 7, 13, 14 that can be visualized on [18F]-fluorodeoxyglucose positron emission tomography (FDG PET). In a model of pulmonary inflammation endotoxin was instilled into the right middle lobe bronchus of normal volunteers, the subsequent pneumonitis appeared as enhanced FDG uptake on PET imaging 15. Moreover, FDG uptake was found to be proportional to neutrophil concentration in bronchioalveolar lavage samples obtained in that study. FDG PET imaging was shown to provide a quantitative assessment of pneumonitis in patients with chronic obstructive pulmonary disease, asthma, or cystic fibrosis 16, 17. We previously explored the use of FDG PET/computed tomography (FDG PET/CT) (Figure 1), acquired for restaging after chemoradiotherapy, as an objective quantitative measure of pneumonitis response after thoracic radiotherapy for esophageal cancer 18, 19. A linear relationship between FDG uptake and radiation dose was found for each patient, with the slope varying between patients. The slope of this linear relation, which we refer to as the pulmonary metabolic radiation response (PMRR), provides an objective, quantifiable measure of the inflammation response to radiation. We further found a significant correlation between RP clinical symptoms and the PMRR measured by FDG PET/CT after thoracic radiotherapy 19. Notably, the PMRR combined with treatment-planning parameters proved better at distinguishing symptomatic from asymptomatic patients than treatment-planning parameters alone 19. These findings led us to hypothesize that the PMRR derived from post-treatment FDG PET/CT can be used as an imaging biomarker of RP response to assess the effect of taxane-based chemotherapy.
Figure 1. The pulmonary metabolic response rate (PMRR) as the normalized FDG PET response.
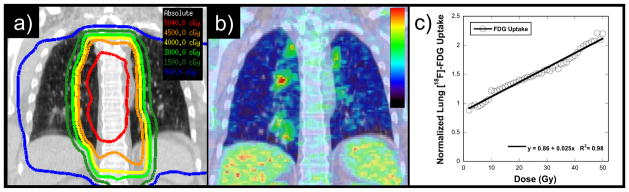
a) Coronal section through the radiotherapy treatment planning CT and isodose distribution for a representative patient with mid-esophageal cancer. b) Corresponding section through restaging non-contrast CT with superimposed FDG PET image obtained after chemoradiotherapy. c) The normalized FDG uptake response per voxel versus radiotherapy dose (in Gy) is shown for this case along with the linear regression fit. The FDG uptake response is normalized to the unirradiated (0–5 Gy) lung response, allowing each case to act as its own internal control. The regression slope is the PMRR.
At The University of Texas M. D. Anderson Cancer Center, patients with esophageal cancer routinely undergo restaging FDG PET/CT 6 weeks after chemoradiotherapy to identify patients with interval metastases 20. In this study, we retrospectively investigated the effect of induction and concurrent taxane-based chemotherapy on clinical pneumonitis symptoms and the PMRR.
Materials and Methods
Patient Radiation Dose and PET Data
The study population comprised patients treated in the Department of Radiation Oncology at M. D. Anderson Cancer Center for esophageal cancer between November 1, 2003 and December 15, 2007 (n=267) who had CT treatment planning and follow-up PET/CT imaging between 24 and 84 days after completion of radiotherapy at M. D. Anderson Cancer Center. Because the PMRR can be affected by the image registration quality, we elected to include only patients who received CT radiotherapy planning and follow-up PET/CT with the same arm positioning (n=139). Patient identifiers were removed in accordance with a retrospective study protocol (RCR 03-0800) approved by the M. D. Anderson Institutional Review Board in compliance with the Health Insurance Portability and Accountability Act of 1996 regulations.
Each patient had undergone treatment-planning CT imaging of the entire thorax and upper abdomen without contrast. Gross target delineation and margin generation was performed in a consistent manner as our group has reported 21. The radiation dose was calculated either with a free-breathing treatment planning CT (most cases) or with an average CT calculated from a 4-dimensional CT (4D CT) image set 22, 23. Radiation treatment was planned using standard 3D conformal techniques for 53 patients (15 in group 1, 25 in group 2, 13 in groups 3) or intensity modulated techniques for 86 patients (31 in group 1, 35 in group 2, 20 in groups 3) with at least 95% of the planning target volume receiving 45 – 50.4 Gy. Ten radiation oncologists who specialize in the treatment of esophageal cancer designed the radiation treatment plans. All treatment radiotherapy plans and field arrangements were prospectively reviewed in quality assurance meetings in which consensus was obtained according to each patient’s clinical circumstances.
FDG PET/CT images had been obtained between 24 and 84 days after completion of radiotherapy with the General Electric Discovery ST PET/CT scanner for disease restaging purposes. Use of the average CT for attenuation correction had been introduced at M. D. Anderson in 2006 24. Approximately two-thirds of the PET/CT images used in this study were attenuation corrected with mid-inspiratory breath-hold, and the remaining used an average CT obtained from a 4D CT acquisition.
Image Registration and Lung Segmentation
The treatment plan for each patient was imported into a research dosimetry workstation and evaluated with the Pinnacle3 version 7.6c or 8.0u treatment-planning system (Philips Medical Systems, Andover, MA). The radiation dose distributions were all recalculated using a collapsed-cone convolution algorithm 25 with lung heterogeneity corrections. The restaging FDG PET/CT was imported into the Pinnacle treatment-planning system and spatially registered to the planning CT scan by using the Syntegra image fusion software version 1.2b (Philips Medical Systems, Andover, MA). Manual segmentation of the vertebral column was performed on each CT volume. A CT-to-CT six-degrees-of-freedom rigid-body registration of the vertebral column was performed between the treatment planning CT and the PET/CT CT images by using a mutual information algorithm 26. The registered images were visually verified, and minor adjustments of less than 1 cm along each axis were made to improve the registration of the lung regions.
The images, registration parameters, and dose distribution were then exported for analysis. A pulmonary segmentation algorithm 27, based on an eight-point connectivity scheme and a set of three seed points, was applied to each treatment planning CT image set. CT voxels between −920 and −250 Hounsfield units were selected as representing lung parenchyma if they connected to one of the two lung seed points and did not connect to the tracheal-bronchial tree seed point. The resulting lung parenchyma region of interest was used in subsequent analyses. Lung segmentation was also applied to the CT image from the restaging PET/CT and used to evaluate pulmonary CT and PET image characteristics.
Calculation of 18F-FDG Uptake
The standard uptake values (SUV) were calculated from the PET count rate by using the following equation 28:
| (1) |
The mean SUV within the pulmonary tissue was obtained for each case. Using the registration between the treatment-planning CT and the CT from the PET/CT, the mean SUV values in the lung tissue were obtained for each case over the dose ranges 0–5 Gy, 5–10 Gy, 10–20 Gy, and subsequently in 10-Gy intervals to 60 Gy. The median of SUV mean values and the range of the means for the 139 cases were determined. The maximum SUV value within pulmonary tissue irradiated above 5 Gy was found for all 139 cases.
Histograms were formed of the FDG PET count rate versus radiation dose in 1-Gy intervals by using the following equation 18:
| (2) |
A linear regression model was applied to the normalized [18F]-FDG uptake to obtain the PMRR for each case.
Treatment Group, Clinical Toxicity, and Radiation Parameters
Patients were placed into 1 of 3 treatment groups: (1) No taxanes, (2) taxanes in induction or concurrent chemotherapy, and (3) taxanes in both induction and concurrent chemotherapy. Pneumonitis was scored by using the National Cancer Institute Common Terminology Criteria for Adverse Events, version 3 (CTCAE v3) 29. Clinically symptomatic pneumonitis was defined as grade 2 or higher. Mean lung dose (MLD), the volume of lung irradiated to 20 Gy (V20), and the volume of lung irradiated to 30 Gy (V30) were used as dosimetric parameters to estimate the volume of lung irradiated. These dosimetric parameters were included as endpoints because they are widely used to assess pneumonitis risk 30, 31.
An enhancement ratio was calculated from the average PMRR of groups 1 and 3 by using the equation:
| (3) |
where is the average PMRR of group 3 and is the average PMRR of group 1.
Statistical Analysis
Continuous variables (mean lung dose, V20, V30, radiation dose, time between radiotherapy and PET imaging, smoking pack-years, and age) were summarized in the form of mean (SD, range). Categorical variables (toxicity, tumor location, tumor histology, and smoking status) were summarized in the form of frequency tables. Analysis of variance, the Kruskal-Wallis test 32, and the Wilcoxon rank sum test were used to compare PMRR across treatment groups. Standard errors of PMRR values in different treatment groups were used to estimate a 95% confidence interval (CI) for the enhancement ratio. The estimations and CIs were transformed back to the raw scale to yield ratios and corresponding 95% CIs. Time to first symptom was compared across patient characteristics (treatment group, tumor histology, tumor location, type of radiation planning, sex, and smoking status) by using a log-rank test. The Chi-square test was used to determine the association between symptom status and taxane treatment. The Cox proportional hazard model method was used for multivariate analysis. All tests were two-sided with P-values of 0.05 or less considered significant. Statistical analysis was done with SAS version 9 (SAS Institute, Cary, NC) and S-Plus version 7 (Insightful Co., Seattle, WA).
Results
Patient Characteristics
The patients included in this study were categorized by age, sex, TNM stage 33, tumor location and histology, smoking status, and details regarding radiation treatment. Group 1 had 46 patients, group 2 had 58 patients, and groups 3 had 35 patients. Each pretreatment characteristic shown in Table 1 was balanced across treatment groups. The chemotherapy agents used are reported in Table 2 by taxane treatment group. No statistically significant differences were noted between the distributions of MLD, V5, V10, V20 and V30 (Table 3) between the three groups. Though the rank order of V5 values followed group number, there was no difference in their distribution (p=0.38 by ANOVA F-test). The distribution of PMRR values for asymptomatic and symptomatic patients are shown in Figure 2. There were also no significant differences found in the PMRR distribution between patient groups from differing attendings or from radiation delivery technique. Above the median value, the percentage of asymptomatic patients in each interval decreased (Figure 2).
Table 1.
Patient characteristics by chemotherapy group
| Characteristic | No Taxane | Induction or Concurrent Taxane | Induction and Concurrent Taxane |
|---|---|---|---|
|
| |||
| Age (y) | |||
| Median (Range) | 58.5 (36–81) | 66 (34–83) | 66 (44–84) |
|
| |||
| Sex | |||
| Male / Female | 41/5 | 50/8 | 27/8 |
|
| |||
| Disease Stage | |||
| I | 0 (0) | 2 (3) | 0 (0) |
| IIa | 14 (30) | 15 (26) | 6 (17) |
| IIb | 3 (7) | 5 (9) | 3 (9) |
| III | 26 (57) | 27 (47) | 17 (49) |
| IVA | 0 (0) | 0 (0) | 0 (0) |
| IVB | 3 (6.5) | 8 (14) | 8 (23) |
| recurrent | 0 (0) | 1 (2) | 1 (3) |
|
| |||
| Tumor Location | |||
| Proximal | 2 (4) | 0 (0) | 0 (0) |
| Middle | 5 (11) | 8 (14) | 2 (6) |
| Distal | 20 (43) | 21 (36) | 13 (37) |
| Gastroesophageal junction | 19 (41) | 29 (50) | 20 (57) |
|
| |||
| Smoking History | |||
| Current | 7 (15) | 4 (7) | 2 (6) |
| Former | 32 (70) | 42 (72) | 23 (66) |
| Never | 7 (15) | 12 (21) | 10 (29) |
|
| |||
| Histology | |||
| Adenocarcinoma | 37 (80) | 50 (86) | 31 (89) |
| Squamous Cell Carcinoma | 7 (15) | 8 (14) | 3 (9) |
| Small Cell Carcinoma | 1 (2) | 0 (0) | 1 (3) |
| Neuroendocrine | 1 (2) | 0 (0) | 0 (0) |
|
| |||
| Radiation Planning | |||
| 3D-CRT | 15 (33) | 25 (43) | 13 (37) |
| IMRT | 31 (67) | 33 (57) | 22 (63) |
|
| |||
| Planning target volume (mL) | |||
| Median | 797 mL | 721 mL | 774 mL |
| Range | 345–1420 mL | 355–1842 mL | 188–2056 mL |
|
| |||
| Prescription dose (Gy) | |||
| Median (Range) | 50.4 (41.4–54) | 50.4 (45.0–63.0) | 50.4 (45.0–59.4) |
|
| |||
| Time between completion of radiotherapy and PET (days) | |||
| Median | 39 days | 41 days | 41 days |
| Range | 27–78 days | 23–70 days | 27–78 days |
Values are N (%) unless noted as median or range.
Abbreviations: 3D-CRT, 3-dimensional conformal radiation therapy; IMRT, intensity-modulated radiation therapy; PET, positron emission tomography.
Table 2.
Chemotherapy usage by taxane treatment group
| Chemotherapy | No Taxane | IN or CC Taxane | IN and CC Taxane | |||
|---|---|---|---|---|---|---|
|
| ||||||
| IN | CC | IN | CC | IN | CC | |
|
| ||||||
| None | 27 | 3 | 36 | |||
| 5FU | 3 | 2 | ||||
| 5FU/cisplatin | 5 | 10 | ||||
| 5FU/irinotecan/cisplatin | 1 | |||||
| 5FU/oxaliplatin | 14 | 27 | 1 | 2 | ||
| ECF, EOX, then cetuximab, bavacizumab, irinotecan | 1 | |||||
| epirubicin/capecitabine/cis platin | 1 | |||||
| etoposide/cisplatin | 2 | 2 | ||||
| irinotecan/carboplatin | 2 | 1 | ||||
| irinotecan/cisplatin | 1 | 4 | 1 | |||
| oxaliplatin | 1 | |||||
| S-1/cisplatin | 3 | |||||
| docetaxel | 1 | |||||
| docetaxel/5FU | 1 | 33 | 17 | |||
| docetaxel/5FU/carboplatin | 1 | |||||
| docetaxel/5fu/cisplatin | 1 | 15 | 2 | |||
| docetaxel/5fu/POAT-101 | 1 | |||||
| docetaxel/5FU/irinotecan | 1 | 12 | 7 | |||
| docetaxel/5FU/oxaliplatin | 3 | 4 | ||||
| paclitaxel/5FU | 5 | 8 | ||||
| paclitaxel/5FU/carboplatin | 1 | 2 | 2 | 1 | ||
| paclitaxel/5FU/cisplatin | 8 | |||||
| paclitaxel/carboplatin | 1 | 1 | ||||
Abbreviations: 5FU = fluorouracil. ECF = epirubicin/cisplatin/fluorouracil. EOX = capecitabine/oxaliplatin/epirubicin. S-1 = tegafur/5-chloro-2,4-dihydroxypyridine/oxonic acid. AT-101 = experimental pan Bcl-2 inhibitor agent. CC = concurrent, IN = induction.
Table 3.
Dosimetric parameters according to taxane treatment group
| Taxane Treatment Group | n | MLD | V5 | V10 | V20 | V30 |
|---|---|---|---|---|---|---|
| None | 46 | 11.9 (2.6–19.4) | 52.6 (9.5–87.3) | 36.0 (2.9–73.6) | 21.6 (0.6–36.4) | 13.2 (0.2–27.5) |
| Either | 60 | 12.5 (3.4–20.9) | 55.4 (10.9–95.0) | 38.5 (8.1–76.9) | 23.2 (4.7–40.5) | 13.8 (2.1–29.5) |
| Both | 33 | 12.5 (5.2–18.8) | 56.7 (21.9–90.7) | 38.1 (15.4–61.0) | 21.5 (7.4–34.8) | 13.4 (4.3–24.8) |
Abbreviations: MLD = mean lung dose. None = no taxane. Either = induction or concurrent taxane. Both = induction and concurrent taxane. For V5, V10, V20, and V30 see text. Data are expressed as mean (range) dose in Gray.
Figure 2. Distribution of the pulmonary metabolic radiation response (PMRR).

A linear regression was applied to the normalized FDG uptake response versus radiotherapy dose for each of the 139 cases studied in this study. The patient records were reviewed and scored for symptomatic pneumonitis according CTCAE v.3. The distribution of the regression slopes for patients with symptoms (CTCAE v. 3 grade > 1) and those without symptoms are shown in this histogram plot. The percentage of symptomatic patients increased with increases in PMRR values.
Taxanes and Symptoms of Pneumonitis
The crude rates of pneumonitis symptoms were 46%, 62%, and 74% for groups 1, 2, and 3, respectively (Table 4). The association between symptom status and taxane treatment was significant (p=0.02 by Chi-square test) in that patients in group 3 had a significantly higher probability of developing symptomatic toxicity than did groups 1 or 2. The univariate analysis showed a trend in the crude rate from group 1 to group 2 to group 3 (p=0.03).
Table 4.
Pulmonary toxicity rates according to taxane treatment group
| Toxicity Grade* | Group 1 (No Taxane; n = 46) | Group 2 (Induction or Concurrent Taxane; n = 58) | Group 3 (Induction and Concurrent Taxane; n = 35) |
|---|---|---|---|
|
| |||
| 0 or 1 | 25 (54.3) | 22 (37.9) | 9 (25.7) |
| 2 | 20 (43.5) | 32 (55.2) | 25 (71.4) |
| 3 | 1 (2.2) | 3 (5.2) | 1 (2.9) |
| 4 | 0 | 0 | 0 |
| 5 | 0 | 1 (1.7) | 0 |
| Crude rate, %† | 45.6 | 62.1 | 74.3 (p = 0.03)‡ |
CTCv3 = National Cancer Institute Common Toxicity Criteria Version 3. Percentages per group are given in parentheses.
Crude rate = number of patients with symptoms (grade 2 or higher toxicity) divided by total number of patients for each group.
p-value is for univariate analysis of pneumonitis crude rate by taxane treatment group.
Taxanes and PMRR
The mean PMRR values were 0.016 Gy−1 for group 1, 0.018 Gy−1 for group 2, and 0.022 Gy−1 for group 3. The ANOVA test of log(PMRR) by treatment was significant (p-value = 0.005). Group 3 had 61% higher PMRR compared with group 1 (p = 0.002). Group 2 had 38% higher PMRR compared with group 1 (p = 0.015). Group 3 had 17% higher PMRR compared with group 2, but the difference was not statistically significant (p = 0.31). The enhancement ratio was found to be 1.60 (95% CI: 1.19–2.14) ; hence, on average for a given radiation dose the metabolic response measured on restaging FDG PET/CT was greater for group 3 by that ratio.
Taxanes and Time to First Pneumonitis Symptom
Symptomatic toxicity was defined as that occurring within 1 year after treatment. Therefore, all follow-up evaluations after 1 year were censored. No clinical factor (treatment group, tumor histology or location, type of radiation planning, sex, or smoking status) was significantly associated with the time to first symptom. Three Cox proportional hazard models were constructed for multivariate analysis, based on different combinations of PMRR and radiation dose parameters. Overall, higher PMRR and radiation dosimetric parameters (V20, V30, MLD) were associated with shorter time to symptom development. Specifically, in multivariate Cox models in which time to onset was the dependent variable, PMRR improved prediction when entered into the regression function with each of the dosimetric parameters. For example, when included in the model with V20, the p-values of PMRR and V20 were 0.05 and 0.02, respectively; when included with V30 the p-values were 0.04 and 0.01, respectively; and when included with MLD the p-values were 0.06 and 0.02, respectively.
Discussion
The primary aim of this study was to evaluate the effect of taxane-based chemotherapy on pulmonary radiation toxicity in patients receiving thoracic irradiation for esophageal cancer. We found that patients who had had taxanes in both induction and concurrent chemotherapy had a higher crude rate of pneumonitis symptoms (74%) than did those who had received taxanes as either induction or concurrent taxanes (62%) or no taxanes (46%) (Table 4). The PMRR, used as an imaging biomarker of RP response to quantify the effect of taxane-based chemotherapy on pulmonary response, showed that the post-radiation pneumonitis response was enhanced among patients who received taxanes in both induction and concurrent chemotherapy compared with those who received no taxanes (enhancement ratio 1.60, CI: 1.19 – 2.14). The group average PMRR was significantly (p=0.005) higher for groups 2 and 3 than for group 1, but the individual pulmonary radiation response varied widely (Figure 2). The link between symptomatic pneumonitis and MLD or V20 has been long established 30, 31, 34, but the development of pneumonitis symptoms also depends on the individual response, as reflected in the PMRR 19. In this study, we found that higher PMRR and MLD or V20 were associated with shorter time to symptom development.
Overall, the incidence of symptomatic pneumonitis in this retrospective analysis was high at 58% and included one case of fatal pneumonitis during the study period. A second case of fatal pneumonitis was not included because that patient died before undergoing the restaging FDG PET/CT imaging. Both patients had received taxane-based chemotherapy, one weekly concurrent with therapy and the other concurrently plus a prior extensive course of taxane-based chemotherapy for malignant melanoma. Recently, a phase II trial of induction paclitaxel plus carboplatin followed by paclitaxel with concurrent radiotherapy for 21 patients with stage IIIB non-small-cell lung cancer showed pneumonitis in 13 patients (62%), grade 1–2 in nine patients (43%) and grade 3–4 in four (19%) 35. One patient in that study died from radiation-associated pneumonitis. Schweitzer et al. 36 reported a case of radiographically consistent recall pneumonitis in a patient who received thoracic radiation for lung cancer followed 12 days later by paclitaxel.
Severe or fatal pneumonitis has also been described after taxane therapy without radiotherapy. Wong et al. 37 reported a fatal case of pneumonitis after a single dose of paclitaxel, confirmed by imaging and transbronchial biopsy revealing cellular mononuclear-cell interstitial pneumonitis. Shitara et al. 38 reported two cases of fatal pneumonitis after paclitaxel administration for advanced gastric cancer. Read et al. 39 reported four cases of severe pneumonitis, two of which were fatal, after docetaxel administration to patients with no pulmonary neoplasm or metastasis.
The finding from the present study are also in agreement with those from previous studies of taxanes plus radiotherapy considering the volumes of lung irradiated and time between taxane administration and radiotherapy. Taghian et al. 8 retrospectively studied 41 patients with breast cancer who had received a taxane as concurrent or induction chemotherapy, and concluded that the combination of a taxane and radiation requires careful evaluation of patients for RP. The radiation technique used in that study was point-in-field, a method that facilitates dosimetric calculation, but can lead to increased volumes of lung being irradiated when large breast tangent fields are used. Irradiated lung volume in that study was estimated from central lung distance (CLD); the mean CLD was 2.3 cm (range not given). Paclitaxel was given either concurrently or sequentially, with 4–10 weeks separating the chemotherapy and radiation. Yu et al. in studying 100 patients with breast cancer who received an induction taxane and 89 who did not, concluded that patients with breast cancer treated with sequential paclitaxel and radiation therapy appeared to have a very low rate of clinically relevant RP, a rate that was no different from that for patients treated with non-taxane chemotherapy 11. The technique used in that study yielded an estimated mean CLD of < 2 cm (range not given). Further, the time between the induction taxane chemotherapy and radiotherapy in that study was 8 weeks or more, which may have reduced the synergistic toxicity of paclitaxel and radiation to the lung. Interestingly, Yu found a higher frequency of radiographic changes, that would be classified as grade 1 toxicity by CTCAE v3, after radiation among those given taxane-based chemotherapy. This supports the premise that use of induction taxane chemotherapy with a small volume of lung irradiation and a relatively long period between taxane administration and irradiation leads to limited subclinical radiographic changes. In the present study, a larger volume of lung was irradiated because of the anatomic location of esophageal cancer as compared with breast cancer cases. As expected, the rate of pneumonitis was high at 58%. Both the PMRR and likelihood of experiencing RP were higher in those given taxanes. The findings in this study suggest that the potential advantage of combining taxane-based chemotherapy with thoracic radiotherapy for thoracic malignancies may be offset by increased pulmonary toxicity
The current study had several limitations. The variation in PMRR values was relatively low in the group that received taxanes in both induction and concurrent therapy. This finding needs to be investigated further to confirm its clinical significance. Because this was a retrospective analysis, standardized questionnaires of pulmonary symptoms were not used. A prospective study addressing pulmonary toxicity response should include standardized acquisition parameters such as the NCI consensus guidelines.40 Standardizing the image acquisition would make the evaluation of SUV values more informative. The chemotherapy varied among patients in each group, which may make these findings more generalizable to an association between any induction and/or concurrent systemic therapy with thoracic radiation and incidence of PMRR and pulmonary symptoms.
Conclusions
In this study, patients who received taxane-based chemotherapy as part of both induction and concurrent chemotherapy had significantly higher PMRR than did patients without any taxane-based treatment. Patients who received a taxane had significantly higher PMRR compared with patients without any taxane treatment. A PMRR enhancement factor of 1.60 (95% CI: 1.19–2.14) was found for the group that received both induction and concurrent taxane-based chemotherapy. Time to first symptom was significantly associated with PMRR and radiation dosimetry parameters (MLD, V20, and V30), in that higher PMRR and higher MLD, V20, or V30 were associated with shorter time to first symptom.
Figure 3. Dot Plots of PMRR by treatment group.

A linear regression was applied to the normalized FDG uptake response versus radiotherapy dose for each of the 139 cases studied in this study. The distribution of the regression slopes is shown in this point plot for the 58 patients who received induction or concurrent taxanes(◇), the 35 who got both induction and concurrent (△), versus the 46 patients who did not receive taxanes (○). The Kruskal-Wallis test, a nonparametric test that uses order statistics rather than the raw values, yielded significant results (P-value = 0.005) indicating that PMRR was highest in the “Both” group, lower in the “Either” group and lowest in the “None” group.
Acknowledgments
We extend our gratitude to The University of Texas M. D. Anderson Cancer Center’s Physician Scientist Program who provided funds for this project (TG). Additional funding for this study was provided from a pilot grant from the Radiation Countermeasures Center of Research Excellence (NIH 1U19AI067798) at Duke University (TG). Stipend support was provided by a Medical Student Research Grant from the Radiological Society of North America and the Medical Scientist Training Program at Baylor College of Medicine (MM).
Footnotes
Presented at the American Radium Society 90th Annual Meeting, Laguna Niguel, California, USA,
Conflict of Interest Notification
The authors have no commercial or financial interests related to this study to disclose.
Publisher's Disclaimer: This is a PDF file of an unedited manuscript that has been accepted for publication. As a service to our customers we are providing this early version of the manuscript. The manuscript will undergo copyediting, typesetting, and review of the resulting proof before it is published in its final citable form. Please note that during the production process errors may be discovered which could affect the content, and all legal disclaimers that apply to the journal pertain.
References
- 1.Rowinsky EK. The development and clinical utility of the taxane class of antimicrotubule chemotherapy agents. Annu Rev Med. 1997;48:353–374. doi: 10.1146/annurev.med.48.1.353. [DOI] [PubMed] [Google Scholar]
- 2.Pazdur R, Kudelka AP, Kavanagh JJ, et al. The taxoids: paclitaxel (Taxol) and docetaxel (Taxotere) Cancer Treat Rev. 1993;19:351–386. doi: 10.1016/0305-7372(93)90010-o. [DOI] [PubMed] [Google Scholar]
- 3.Ajani JA, Ilson DH, Daugherty K, et al. Activity of Taxol in Patients With Squamous Cell Carcinoma and Adenocarcinoma of the Esophagus. J Natl Cancer Inst. 1994;86:1086–1091. doi: 10.1093/jnci/86.14.1086. [DOI] [PubMed] [Google Scholar]
- 4.Beal K, Hudis C, Norton L, et al. Radiation pneumonitis in breast cancer patients treated with taxanes: Does sequential radiation therapy lower the risk? Breast J. 2005;11:317–320. doi: 10.1111/j.1075-122X.2005.21696.x. [DOI] [PubMed] [Google Scholar]
- 5.Weiss RB, Donehower RC, Wiernik PH, et al. Hypersensitivity reactions from taxol. J Clin Oncol. 1990;8:1263–1268. doi: 10.1200/JCO.1990.8.7.1263. [DOI] [PubMed] [Google Scholar]
- 6.Sekine I, Nishiwaki Y, Watanabe K, et al. Phase II study of 3-hour infusion of paclitaxel in previously untreated non-small cell lung cancer. Clin Cancer Res. 1996;2:941–945. [PubMed] [Google Scholar]
- 7.Ghafoori P, Marks LB, Vujaskovic Z, et al. Radiation-induced lung injury assessment, management, and prevention. Oncology (Huntingt) 2008;22:37–47. [PubMed] [Google Scholar]
- 8.Taghian AG, Assaad SI, Niemierko A, et al. Risk of pneumonitis in breast cancer patients treated with radiation therapy and combination chemotherapy with paclitaxel. J Natl Cancer Inst. 2001;93:1806–1811. doi: 10.1093/jnci/93.23.1806. [DOI] [PubMed] [Google Scholar]
- 9.Hanna YM, Baglan KL, Stromberg JS, et al. Acute and subacute toxicity associated with concurrent adjuvant radiation therapy and paclitaxel in primary breast cancer therapy. Breast J. 2002;8:149–153. doi: 10.1046/j.1524-4741.2002.08306.x. [DOI] [PubMed] [Google Scholar]
- 10.Taghian AG, Assaad SI, Niemierko A, et al. Is a reduction in radiation lung volume and dose necessary with paclitaxel chemotherapy for node-positive breast cancer? Int J Radiat Oncol Biol Phys. 2005;62:386–391. doi: 10.1016/j.ijrobp.2004.09.044. [DOI] [PubMed] [Google Scholar]
- 11.Yu TK, Whitman GJ, Thames HD, et al. Clinically relevant pneumonitis after sequential paclitaxel-based chemotherapy and radiotherapy in breast cancer patients. J Natl Cancer Inst. 2004;96:1676–1681. doi: 10.1093/jnci/djh315. [DOI] [PubMed] [Google Scholar]
- 12.Movsas B, Chetty I, Ajlouni M. Can patient reporting affect radiation pneumonitis? Oncology (Huntingt) 2008;22:52–53. [Google Scholar]
- 13.Roberts CM, Foulcher E, Zaunders JJ, et al. Radiation pneumonitis: A possible lymphocyte-mediated hypersensitivity reaction. Ann Intern Med. 1993;118:696–700. doi: 10.7326/0003-4819-118-9-199305010-00006. [DOI] [PubMed] [Google Scholar]
- 14.Fajardo LF, Berthrong M, Anderson RE. Radiation Pathology. New York: Oxford Univ. Press; 2001. [Google Scholar]
- 15.Chen DL, Rosenbluth DB, Mintun MA, et al. FDG-PET imaging of pulmonary inflammation in healthy volunteers after airway instillation of endotoxin. J Appl Physiol. 2006;100:1602–1609. doi: 10.1152/japplphysiol.01429.2005. [DOI] [PubMed] [Google Scholar]
- 16.Jones HA, Marino PS, Shakur BH, et al. In vivo assessment of lung inflammatory cell activity in patients with COPD and asthma. Eur Respir J. 2003;21:567–573. doi: 10.1183/09031936.03.00048502. [DOI] [PubMed] [Google Scholar]
- 17.Chen DL, Ferkol TW, Mintun MA, et al. Quantifying pulmonary inflammation in cystic fibrosis with positron emission tomography. Am J Respir Crit Care Med. 2006;173:1363–1369. doi: 10.1164/rccm.200506-934OC. [DOI] [PMC free article] [PubMed] [Google Scholar]
- 18.Guerrero T, Johnson V, Hart J, et al. Radiation pneumonitis: Local dose versus [18F]-fluorodeoxyglucose uptake response in irradiated lung. Int J Radiat Oncol Biol Phys. 2007;68:1030–1035. doi: 10.1016/j.ijrobp.2007.01.031. [DOI] [PubMed] [Google Scholar]
- 19.Hart JP, McCurdy MR, Ezhil M, et al. Radiation pneumonitis: correlation of toxicity with pulmonary metabolic radiation response. Int J Radiat Oncol Biol Phys. 2008;71:967–971. doi: 10.1016/j.ijrobp.2008.04.002. [DOI] [PMC free article] [PubMed] [Google Scholar]
- 20.Ajani JA, Komaki R, Putnam JB, et al. A three-step strategy of induction chemotherapy then chemoradiation followed by surgery in patients with potentially resectable carcinoma of the esophagus or gastroesophageal junction. Cancer. 2001;92:279–286. doi: 10.1002/1097-0142(20010715)92:2<279::aid-cncr1320>3.0.co;2-2. [DOI] [PubMed] [Google Scholar]
- 21.Liao Z, Liu H, Komaki R. Target delineation for esophageal cancer. Journal of Women’s Imaging. 2003;5:177–186. [Google Scholar]
- 22.Vedam SS, Keall PJ, Kini VR, et al. Acquiring a four-dimensional computed tomography dataset using an external respiratory signal. Phys Med Biol. 2003;48:45–62. doi: 10.1088/0031-9155/48/1/304. [DOI] [PubMed] [Google Scholar]
- 23.Pan T, Lee TY, Rietzel E, et al. 4D-CT imaging of a volume influenced by respiratory motion on multi-slice CT. Med Phys. 2004;31:333–340. doi: 10.1118/1.1639993. [DOI] [PubMed] [Google Scholar]
- 24.Pan T, Mawlawi O, Luo D, et al. Attenuation correction of PET cardiac data with low-dose average CT in PET/CT. Med Phys. 2006;33:3931–3938. doi: 10.1118/1.2349843. [DOI] [PubMed] [Google Scholar]
- 25.Ahnesjo A. Collapsed cone convolution of radiant energy for photon dose calculation in heterogeneous media. Med Phys. 1989;16:577–592. doi: 10.1118/1.596360. [DOI] [PubMed] [Google Scholar]
- 26.Studholme C, Hawkes DJ, Hill DLG. A normalised entropy measure for multi-modality image alignment. Proceedings of the SPIE Medical Imaging. 1998;3338:132–142. [Google Scholar]
- 27.Hu S, Hoffman EA, Reinhardt JM. Automatic lung segmentation for accurate quantitation of volumetric X-ray CT images. IEEE Trans Med Imaging. 2001;20:490–498. doi: 10.1109/42.929615. [DOI] [PubMed] [Google Scholar]
- 28.Strauss LG, Conti PS. The applications of PET in clinical oncology. J Nucl Med. 1991;32:623–648. [PubMed] [Google Scholar]
- 29.Trotti A, Colevas AD, Setser A, et al. CTCAE v3.0: Development of a comprehensive grading system for the adverse effects of cancer treatment. Semin Radiat Oncol. 2003;13:176–181. doi: 10.1016/S1053-4296(03)00031-6. [DOI] [PubMed] [Google Scholar]
- 30.Graham MV, Purdy JA, Emami B, et al. Clinical dose-volume histogram analysis for pneumonitis after 3D treatment for non-small cell lung cancer (NSCLC) Int J Radiat Oncol Biol Phys. 1999;45:323–329. doi: 10.1016/s0360-3016(99)00183-2. [DOI] [PubMed] [Google Scholar]
- 31.Kwa SL, Lebesque JV, Theuws JC, et al. Radiation pneumonitis as a function of mean lung dose: An analysis of pooled data of 540 patients. Int J Radiat Oncol Biol Phys. 1998;42:1–9. doi: 10.1016/s0360-3016(98)00196-5. [DOI] [PubMed] [Google Scholar]
- 32.Kruskal WH, Wallis WA. Use of ranks in one-criterion variance analysis. Journal of the American Statistical Association. 1952;47:583–621. [Google Scholar]
- 33.AJCC Staging Manual. 6. Philadelphia: Lippincott-Raven Press; 2002. (American Joint Committee on Cancer). [Google Scholar]
- 34.Martel MK, Ten Haken RK, Hazuka MB, et al. Dose-volume histogram and 3-D treatment planning evaluation of patients with pneumonitis. Int J Radiat Oncol Biol Phys. 1994;28:575–581. doi: 10.1016/0360-3016(94)90181-3. [DOI] [PubMed] [Google Scholar]
- 35.Pallarés C, Capdevila J, Paredes A, et al. Induction chemotherapy with paclitaxel plus carboplatin followed by paclitaxel with concurrent radiotherapy in stage IIIB non-small-cell lung cancer (NSCLC) patients: A phase II trial. Lung Cancer. 2007;58:238–245. doi: 10.1016/j.lungcan.2007.06.003. [DOI] [PubMed] [Google Scholar]
- 36.Schweitzer VG, Juillard GJF, Bajada CL, et al. Radiation recall dermatitis and pneumonitis in a patient treated with paclitaxel. Cancer. 1995;76:1069–1072. doi: 10.1002/1097-0142(19950915)76:6<1069::aid-cncr2820760623>3.0.co;2-7. [DOI] [PubMed] [Google Scholar]
- 37.Wong P, Leung AN, Berry GJ, et al. Paclitaxel-induced hypersensitivity pneumonitis: Radiographic and CT findings. Am J Roentgenol. 2001;176:718–720. doi: 10.2214/ajr.176.3.1760718. [DOI] [PubMed] [Google Scholar]
- 38.Shitara K, Ishii E, Kondo M, et al. Suspected paclitaxel-induced pneumonitis. Gastric Cancer. 2006;9:325–328. doi: 10.1007/s10120-006-0388-1. [DOI] [PubMed] [Google Scholar]
- 39.Read WL, Mortimer JE, Picus J. Severe interstitial pneumonitis associated with docetaxel administration. Cancer. 2002;94:847–853. doi: 10.1002/cncr.10263. [DOI] [PubMed] [Google Scholar]
- 40.Shankar LK, Hoffman JM, Bacharach S, et al. Consensus Recommendations for the Use of 18F-FDG PET as an Indicator of Therapeutic Response in Patients in National Cancer Institute Trials. J Nucl Med. 2006;47:1059–1066. [PubMed] [Google Scholar]