

Abstract
Background
The American Heart Association has established criteria for the evaluation of novel markers of cardiovascular risk. In accordance with these criteria, we assessed the association between a multi-locus genetic risk score (GRS) and incident coronary heart disease (CHD), and evaluated whether this GRS improves the predictive capacity of the Framingham risk function.
Methods and results
Using eight genetic variants associated with CHD but not with classical cardiovascular risk factors (CVRFs), we generated a multi-locus GRS, and found it to be linearly associated with CHD in two population based cohorts: The REGICOR Study (n=2,351) and The Framingham Heart Study (n=3,537) (meta-analyzed HR [95%CI]: ~1.13 [1.01–1.27], per unit). Inclusion of the GRS in the Framingham risk function improved its discriminative capacity in the Framingham sample (c-statistic: 72.81 vs.72.37, p=0.042) but not in the REGICOR sample. According to both the net reclassification improvement (NRI) index and the integrated discrimination index (IDI), the GRS improved re-classification among individuals with intermediate coronary risk (meta-analysis NRI [95%CI]: 17.44 [8.04; 26.83]), but not overall.
Conclusions
A multi-locus GRS based on genetic variants unrelated to CVRFs was associated with a linear increase in risk of CHD events in two distinct populations. This GRS improves risk reclassification particularly in the population at intermediate coronary risk. These results indicate the potential value of the inclusion of genetic information in classical functions for risk assessment in the intermediate risk population group.
Keywords: Coronary artery disease, Cardiovascular disease, Genetic variants, Genetic risk, Polymorphisms, Risk Assessment
INTRODUCTION
The main goal of primary cardiovascular prevention is to reduce the incidence of clinical events [1]. Generally, two strategies are used: i) population-wide interventions based on the promotion of healthy lifestyles and public health policies; and ii) targeting of high risk individuals, in whom intensive strategies are implemented to control cardiovascular risk factors. In clinical practice, cardiovascular risk functions are used to identify the high risk individuals by estimating the probability of presenting a coronary (CHD) event, usually in the subsequent 10 years [2]. Although these screening methods are well established and widely used, the majority of the CHD events occur in individuals who are classified as having low or intermediate risk [3]. Therefore, the improvement of risk estimation, especially in the intermediate risk group, is a priority for research. In this regard, the identification of new biomarkers, particularly those that provide information complementary to that already provided by classical cardiovascular risk factors (CVRFs) [4], has been the subject of intense research in recent years. To that end, the American Heart Association (AHA) has proposed several essential steps [5] for assessing the potential value of such novel biomarkers in estimating risk: i) initial demonstration of association between marker and event risk (proof of concept), ii) validation of this relationship in prospective cohort studies, iii) assessment of the improvement of the predictive capacity of the risk function due to the addition of the marker, iv) assessment of effects on patient management and outcomes, and, v) cost-effectiveness of population-wide implementation.
Genome-wide association studies (GWAS) have led to the identification of a series of genetic variants that are robustly associated with CHD risk [6], although their individual effects on risk are generally quite small. Since these effects have also been observed to be generally additive, overall genetic risk load, formulated as a multi-locus genetic risk score (GRS), has been proposed [7,8] as a potentially informative biomarker for improving the estimation of coronary risk [1,9]. We have recently reported the results of a large case-control study aimed at addressing the first step of the AHA recommendations, in which we observed a robust association between CHD risk and a GRS composed of variants associated with CHD, but not with classical CVRFs [10]. Following on from our previous work, the aims of the current study were to address steps 2 and 3 of the AHA recommendations for the same GRS. First, we assessed the association between the multi-locus GRS and incident CHD events in two prospective cohort studies with low and high CHD mortality (AHA, step 2). Second, we assessed whether the inclusion of this GRS improves the predictive capacity of the Framingham risk function (AHA, step 3). In addition, we evaluated the hypothesis that the improvement in predictive capacity provided by the GRS is greater among individuals with intermediate risk.
METHODS
An extended description of the methods used is given in the Supplementary Methods. Supplementary Materials section (Sx.x), table (S.Tx), figure (S.Fx) and analysis (S.Ax) numbers are indicated in parentheses throughout the manuscript.
Design
Two prospective population-based cohorts were analyzed in this study. i) The REGICOR (Registre Gironí del Cor) cohort originally included 4,778 individuals from two population-based cross-sectional studies conducted in the province of Girona, in northeastern Spain, in 1995 and 2000 [11]. This population has low CHD mortality [12]. ii) The Framingham Heart Study originally included 5,209 men and women recruited in 1948 [13] and 5,124 offspring of the original participants and their spouses recruited in 1971 [14], from whom DNA was collected during the 1980s and 1990s [15]. This population has relatively high CHD mortality. We obtained access to phenotype and genotype data for the Framingham sample under the Framingham Share initiative via the Database of Genotypes and Phenotypes (dbGaP, ncbi.nlm.nih.gov/dbgap; Project number 1534). To maximize the number of participants included in the analysis for whom genetic data was available, we set exams 15 and 5 as the baseline visits for the Original Cohort (2,632 individuals, 1977–79) and the Offspring Cohort (3,799 individuals, 1991–95), respectively (S.F1).
For both cohorts we selected participants aged 35 to 74 years at the time of the exams, who were free of cardiovascular disease (CVD) at that time, and for whom DNA and complete follow-up information was available.
Selection of genetic variants, genotyping and multi-locus risk score generation
We selected 8 genetic variants associated with CHD but not with CVRFs (blood pressure, total cholesterol, low density lipoprotein (LDL) cholesterol, high density lipoprotein (HDL) cholesterol, triglycerides, diabetes, smoking) and generated a multi-locus GRS as previously described [10]. Briefly, the genetic variants were selected from the catalog of GWA studies of the National Human Genome Research Institute (NHGRI GWAS catalog [6], reviewed in August 2010) using the following criteria: a) the genetic variants were associated with CHD (p≤1×10⁻⁶); b) when two or more genetic variants were in linkage disequilibrium (r2>0.3) only one was selected; c) we excluded SNPs that were previously reported, either in the literature or the NHGRI GWAS catalog, to be associated with one or more CVRFs (see more detail of this process in S1.1 and S.F2). The variants selected were: rs17465637 in MIA3; rs6725887 in WDR12; rs9818870 in MRAS; rs12526453 in PHACTR1; rs1333049 near CDKN2A/2B; rs1746048 near CXCL12; rs9982601 near SCL5A3. We also included the rs10455872 variant in LPA, which has recently been shown to be strongly associated with CHD risk independently of CVRFs [16].
REGICOR samples were genotyped by Centro Nacional de Investigación Oncológica (CNIO, Madrid, Spain) using the Cardio inCode chip (Ferrer inCode, Barcelona, Spain), which is based on Veracode (Illumina, San Diego, USA) and KASPar (KBioscience, Hoddesdon, United Kingdom) technologies. Genotype data for the Framingham participants was obtained via dbGaP for genotyped (Affymetrix 500K and 50K chips) and imputed variants (HapMap CEU release 22, b36) (S1.3). Quality control criteria were applied both to individuals and selected SNPs (S1.4).
A multi-locus GRS was computed for each individual as the sum of the number of risk alleles across all 8 variants [10], after weighting each one by its estimated effect size in the CARDIoGRAM study (S1.2) [17].
Follow-up and phenotype definition
All REGICOR participants were periodically contacted to ascertain whether they had presented any CHD event up until the end of 2009, and events were reviewed using hospital or primary care records. Fatal events were identified from regional and national mortality registers. After reviewing all medical records and physician notes, suspected CHD events were classified in committee according to standardized criteria [18].
Among Framingham participants, a record was made of all CHD events that occurred during follow-up until the end of 2007. Suspected CHD events were reviewed by a panel of Framingham physician investigators after reviewing all available medical records and physician notes using standardized criteria [19].
CHD events included myocardial infarction (MI), angina, coronary revascularization and death due to CHD (S2).
Estimation of ten-year cardiovascular risk
Coronary risk was estimated using the standard 10-year Framingham risk function [19] and the REGICOR function, which is an adaptation of the former that has been validated and calibrated for the Spanish population (S3 and S4) [9]. Both functions included age, sex, systolic and diastolic blood pressure, total cholesterol level, HDL cholesterol level, smoking status, diabetes status and the GRS, where appropriate. Risk was computed using the following formula (also see S4),
where (1-S) is the probability of presenting a CHD event in the next 10 years based on the incidence of CHD in the population, (Fj) is the individual’s exposure to the variousrisk factors considered, including the genetic risk factor (GRS), (F̄j, ) is the population mean of those risk factors, and (β) is the effect size of each risk factor.
Statistical analysis
We used standard parametric and non-parametric methods to compare the characteristics of different groups of individuals (S4). We tested for association between incidence of coronary events and individual genetic variants and the GRS using Cox proportional hazards models, with adjustment for CVRFs (see formula above). We accounted for family relatedness in the Framingham cohort by adjusting for the first five genetic principal components [20]. Each cohort was analyzed separately, and the estimates were pooled using an inverse-variance weighted meta-analysis under a random effects model [21].
We used three different statistics to assess the potential value of including the GRS in risk prediction:
the goodness-of-fit of the models was evaluated using a version of the Hosmer-Lemeshow test [22];
the discriminative capacity of the model was evaluated using the concordance index (c-statistic) [23];
reclassification improvement was calculated using the net reclassification improvement (NRI) index [24] and the integrated discrimination improvement (IDI) index [25].
For the assessment of reclassification improvement, we defined four risk categories (low, intermediate-low, intermediate-high and high) with cut-off points defined in each cohort, according to current guidelines in each country (REGICOR: [0–5)%, [5–10)%, [10–15)%, ≥15%; Framingham: [0–10)%, [10–15)%, [15–20)%, ≥20%, respectively). Analyses that focused on individuals with intermediate risk included individuals from both the intermediate-low and intermediate-high groups. We calculated the expected number of events at 10-years in each risk category and in each cohort using Kaplan-Meier estimates [26]. A bootstrapping method was used to construct confidence intervals for IDI and NRI in order to account for uncertainty in the Kaplan-Meier estimates, as suggested by Steyerberg et al [26].
For each SNP and for the GRS we computed our study’s power to detect associations in each cohort and in the meta-analysis (S5).
All analyses were performed using the R statistical package (version 2.11) [27].
RESULTS
Sample selection and sample characteristics
The process of selection of individuals to include in our analysis is described in S.F1. From the REGICOR sample we included 2,351 individuals, including 107 CHD events, with a mean follow-up of 9.75 years. From the Framingham sample we included 3,537 individuals, including 429 events, with a mean follow-up of 13.32 years. In the REGICOR sample, we observed no significant difference in the estimated 10-year coronary risk between individuals who were included in the analysis compared to those who were not included (S.T1). In the Framingham sample, many individuals were excluded from our study due to the non-availability of genetic data, with the result that those who were included presented a better cardiovascular risk profile (S.T1) and a lower incidence of CHD events than those who were not included (suggesting a survival bias related to DNA availability; S.F3).
The characteristics of the participants from each cohort that were included in our analyses, stratified by presence of CHD events are shown in Table 1. The observed effects of each cardiovascular risk factor on risk of having a CHD event were concordant with those expected and are presented in S.T2.
Table 1.
Description of the phenotypic characteristics of the individuals included in the analysis from the REGICOR and from the Framingham Heart Study cohorts.
|
|
|
|||||||
|---|---|---|---|---|---|---|---|---|
| REGICOR
|
Framingham
|
|||||||
| All | None | CHD | p-value | All | None | CHD | p-value | |
| N | 2,351 | 2,190 | 107 | - | 3,537 | 2,863 | 429 | - |
|
| ||||||||
| Age (years)a | 53.9 (11.2) | 53.3 (11.1) | 61.4 (9.40) | <0.001 | 56.0 (9.3) | 54.8 (9.2) | 60.5 (7.8) | <0.001 |
|
| ||||||||
| Gender (male)b | 1123 (47.8) | 1,016 (46.4) | 74 (69.2) | <0.001 | 1,540 (43.5) | 1,190 (41.6) | 250 (58.3) | <0.001 |
|
| ||||||||
| SBP (mmHg)a | 132 (20.8) | 131 (20.5) | 147 (18.0) | <0.001 | 127 (18.3) | 125 (17.9) | 134 (17.4) | <0.001 |
|
| ||||||||
| DBP (mmHg)a | 79.5 (10.4) | 79.3 (10.3) | 82.6 (10.7) | 0.004 | 75.0 (9.8) | 74.6 (9.8) | 77.7 (9.6) | <0.001 |
|
| ||||||||
| Hypertensionb | 938 (40.1) | 822 (37.7) | 78 (72.9) | <0.001 | 1121 (31.7) | 802 (28.0) | 214 (50.0) | <0.001 |
|
| ||||||||
| Smokingb | 511 (22.0) | 476 (22.0) | 27 (25.5) | 0.469 | 713 (20.2) | 531 (18.5) | 111 (25.9) | 0.002 |
|
| ||||||||
| Total cholesterol (mg/dL)a | 225 (42.4) | 224 (42.0) | 233 (46.6) | 0.103 | 210 (38.6) | 207 (37.4) | 224 (41.0) | <0.001 |
|
| ||||||||
| LDL cholesterol (mg/dL)a | 152 (37.9) | 151 (37.7) | 159 (39.6) | 0.125 | 126 (34.0) | 124 (33.3) | 133 (35.7) | 0.001 |
|
| ||||||||
| HDL cholesterol (mg/dL)a | 51.7 (13.3) | 52.1 (13.2) | 44.8 (12.4) | <0.001 | 51 (15.2) | 52 (15.3) | 46 (13.1) | <0.001 |
|
| ||||||||
| Triglycerides (mg/dL)c | 92 (70–127) | 91 (69–125) | 123 (90–170) | <0.001 | 116 (83–172) | 112 (80–164) | 158 (104–217) | <0.001 |
|
| ||||||||
| Cholesterol treatmentb | 157 (6.7) | 136 (6.2) | 16 (15.0) | 0.003 | 166 (4.7) | 118 (4.1) | 28 (6.5) | 0.055 |
|
| ||||||||
| Diabetesb | 316 (13.8) | 280 (13.1) | 29 (27.6) | <0.001 | 226 (6.4) | 138 (4.8) | 60 (14.0) | <0.001 |
|
| ||||||||
| Diabetes treatmentb | 96 (4.11) | 74 (3.4) | 18 (16.8) | <0.001 | 90 (2.5) | 48 (1.7) | 31 (7.2) | <0.001 |
|
| ||||||||
| Body mass index (kg/m2)a | 27.4 (4.47) | 27.3 (4.46) | 28.9 (4.47) | 0.001 | 27.1 (4.8) | 27.0 (4.8) | 27.9 (4.4) | <0.001 |
|
| ||||||||
| Obesity (BMI≥30 kg/m2)b | 596 (25.6) | 540 (24.9) | 38 (35.8) | 0.046 | 780 (22.1) | 604 (21.2) | 117 (27.3) | 0.006 |
|
| ||||||||
| Family history of CHDb | 272 (11.7) | 301 (11.5) | 19 (17.9) | 0.150 | 551 (24.8) | 478 (24.3) | 55 (32.5) | 0.016 |
CHD: individuals who presented a coronary event during the follow-up; SBP: systolic blood pressure; DBP: diastolic blood pressure; LDL: low density lipoprotein; HDL: high density lipoprotein; BMI: body mass index; CI: confidence interval.
“None”: all individuals except those who presented any cardiovascular event (CHD, stroke or peripheral arterial disease).
mean (standard deviation);
n (proportion, %);
median (25th and 75th percentiles);
mean (95% confidence interval).
Validation of the association between the GRS and risk of CHD
The results of the genotyping quality control process are shown in S.T3, and those of the test for association between the genetic variants included in the GRS and incidence of CHD events is shown in S.T3 (also see S.T4 for power computations). Only the rs1333049 variant in CDKN2A/2B was nominally associated with CHD events in the meta-analysis of both studies.
Clinical characteristics of the participants within each quintile of the GRS are shown in Table 2. The GRS was not directly associated with any of the classical CVRFs in either cohort, with the exception of gender in Framingham (which we believe to be an artefact of the survival bias among individuals for whom DNA was available). The proportion of participants with a positive family history of CHD did not change between quintiles of the GRS. We observed a general increase in the incidence of coronary events from the bottom to the top quintile of the GRS in both cohorts (Table 2).
Table 2.
Description of the characteristics of the participants across quintiles of the genetic risk score in both cohorts.
| Variables | Quintiles of genetic score | p-value | p-trend | ||||
|---|---|---|---|---|---|---|---|
| Q1 | Q2 | Q3 | Q4 | Q5 | |||
| REGICOR | |||||||
| N | 524 | 416 | 473 | 471 | 467 | ||
| Age (years)a | 54.1 (11.1) | 52.9 (11.0) | 54.6 (11.4) | 54.2 (11.0) | 53.6 (11.3) | 0.170 | 0.998 |
| Gender (men)b | 243 (46.4) | 205 (49.3) | 217 (45.9) | 234 (49.7) | 224 (48.0) | 0.705 | 0.581 |
| Total cholesterol (mg/dL)a | 221 (42.8) | 225 (41.8) | 227 (42.5) | 228 (42.0) | 225 (42.8) | 0.072 | 0.049 |
| HDL cholesterol (mg/dL)a | 51.1 (12.9) | 52.4 (13.5) | 52.5 (13.4) | 51.0 (13.0) | 51.5 (13.4) | 0.304 | 0.866 |
| SBP (mmHg)a | 132.0 (22.0) | 131.0 (20.4) | 132.0 (20.4) | 134.0 (21.5) | 132.0 (19.5) | 0.278 | 0.749 |
| DBP (mmHg)a | 78.9 (10.2) | 79.5 (10.8) | 79.0 (10.2) | 80.2 (10.6) | 79.8 (10.0) | 0.257 | 0.099 |
| Diabetesb | 62 (12.1) | 71 (17.5) | 66 (14.3) | 61 (13.3) | 56 (12.3) | 0.137 | 0.590 |
| Smokingb | 107 (20.7) | 87 (21.0) | 98 (20.8) | 107 (23.1) | 112 (24.3) | 0.577 | 0.128 |
| Family history of CHDb | 46 (8.88) | 51 (12.4) | 55 (11.6) | 63 (13.5) | 57 (12.4) | 0.207 | 0.064 |
| Estimated 10-y coronary riskc | 3.2 (1.7–6.4) | 3.2 (1.6–5.6) | 3.4 (1.69–6.5) | 3.5 (1.8–6.6) | 3.1 (1.8–5.9) | 0.196 | 0.607 |
| Incidence of coronary eventsd | 5.08 | 3.44 | 3.97 | 5.98 | 7.06 | 0.038 | 0.015 |
| FRAMINGHAM | |||||||
| N | 743 | 712 | 681 | 711 | 690 | ||
| Age (years)a | 56.6 (9.10) | 56.1 (9.12) | 55.6 (9.58) | 56.1 (9.12) | 55.6 (9.41) | 0.172 | 0.060 |
| Gender (men)b | 351 (47.2) | 321 (45.1) | 305 (44.8) | 299 (42.1) | 264 (38.3) | 0.008 | <0.001 |
| Total cholesterol (mg/dL)a | 208 (37.1) | 209 (37.6) | 213 (39.0) | 211 (39.3) | 210 (39.8) | 0.151 | 0.242 |
| HDL cholesterol (mg/dL)a | 50.5 (14.7) | 50.2 (14.9) | 51.1 (15.2) | 52.0 (15.8) | 51.3 (15.2) | 0.151 | 0.048 |
| SBP (mmHg)a | 127 (18.4) | 126 (17.0) | 127 (18.8) | 126 (18.2) | 127 (18.9) | 0.938 | 0.647 |
| DBP (mmHg)a | 75.2 (10.2) | 75.1 (9.54) | 74.8 (9.81) | 75.0 (9.65) | 74.7 (9.73) | 0.872 | 0.329 |
| Diabetesb | 47 (6.33) | 59 (8.29) | 32 (4.70) | 39 (5.49) | 49 (7.10) | 0.059 | 0.658 |
| Smokingb | 132 (17.8) | 146 (20.5) | 146 (21.4) | 140 (19.7) | 149 (21.6) | 0.358 | 0.144 |
| Family history of CHDb | 113 (24.6) | 112 (24.7) | 105 (24.7) | 109 (24.8) | 112 (25.3) | 0.999 | 0.763 |
| Estimated 10-y coronary riskc | 8.3 (4.7–14.4) | 8.0 (4.8–13.9) | 8.5 (4.4–14.7) | 7.7 (4.1–13.7) | 7.7 (4.2–13.9) | 0.261 | 0.229 |
| Incidence of coronary eventsd | 5.39 | 6.60 | 7.62 | 7.50 | 8.42 | 0.361 | 0.054 |
HDL: high density lipoprotein; SBP: systolic blood pressure; DBP: diastolic blood pressure; CHD: coronary heart disease.
mean (standard deviation);
n (proportion, %);
estimation of 10-year coronary risk based on the classical risk function without the GRS, mean (95% confidence interval);
number of cases/100 individuals in 10 years.
For the GRS, we estimated that our study had 80% power to detect a HR of 1.17, 1.09 and 1.18 per unit increase in REGICOR, Framingham, and the meta-analysis, respectively (S.T4). Both the models with and without the GRS were well calibrated in the REGICOR sample, but not in the Framingham sample, where we observed fewer events than expected, likely due to the survival bias mentioned above (S.F4).
The GRS was linearly associated with incidence of CHD in both cohorts (p=0.001 in REGICOR and p=0.016 in Framingham; Table 3), and in the meta-analysis (HR=1.13; 95% CI: 1.01–1.27) (Table 3). This association remained statistically significant after further adjustment for family history of CHD (HR=1.17; 95% CI: 1.09–1.26). Participants in the top quintile of the GRS had 1.44 times greater risk of CHD, compared to those in the bottom quintile (p-value for linear trend 0.002) (Table 3). In both cohorts the distribution of the GRS was slightly shifted to the right in individuals who had had an event, compared to those who had not (Figure 1).
Table 3.
Multivariate adjusted association between the genetic risk score and risk of coronary events as a continuous variable and between quintiles.
|
|
|
|
|
|||
|---|---|---|---|---|---|---|
| Genetic risk score | REGICOR
|
Framingham
|
Meta-analysis
|
|||
| HR [95%CI]a | P-value | HR [95%CI]a | P-value | HR [95%CI]a | P-value | |
| Continuous | 1.21 [1.09–1.36] | 0.001 | 1.07 [1.01–1.14] | 0.016 | 1.13 [1.01–1.27] | 0.038 |
|
|
|
|
|
|||
| Quintiles | P-trend | 0.010 | P-trend | 0.032 | P-trend | 0.002 |
| Q1 | 1 | --- | 1 | --- | 1 | --- |
| Q2 | 0.76 [0.37–1.53] | 0.437 | 1.06 [0.78–1.45] | 0.711 | 1.00 [0.76–1.34] | 0.973 |
| Q3 | 0.84 [0.45–1.58] | 0.586 | 1.22 [0.90–1.66] | 0.206 | 1.12 [0.83–1.52] | 0.448 |
| Q4 | 1.19 [0.67–2.12] | 0.555 | 1.33 [0.99–1.80] | 0.060 | 1.30 [1.00–1.69] | 0.053 |
| Q5 | 1.86 [1.08–3.20] | 0.025 | 1.29 [0.95–1.75] | 0.104 | 1.44 [1.04–2.01] | 0.030 |
All models were adjusted for the sum of the products of the coefficient for each classical risk factor estimated in the Framingham original and calibrated risk functions and the difference between the participant’s value and the population mean of that risk factor (see main text for formula). To account for family structure in the Framingham cohort we also adjusted for the first five genetic principal components.
HR [95%CI]: Hazard ratio [95% confidence interval].
Figure 1.
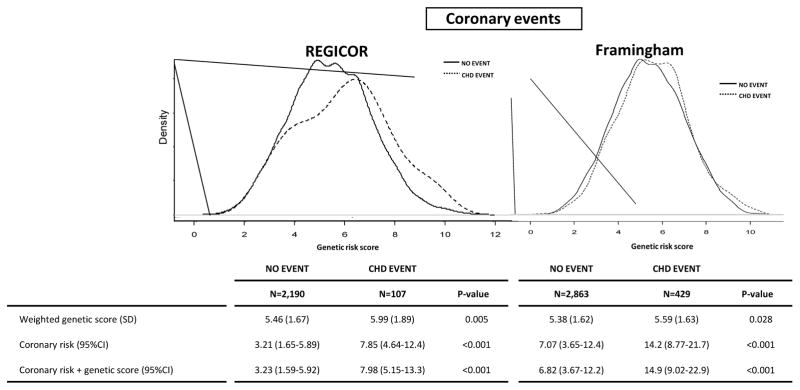
Distribution of genetic risk score in REGICOR and Framingham participants according to the incidence of coronary events during the follow-up. The genetic risk score is represented in the ordinal axis (X axis) and is computed as a cumulative sum of all the risk alleles that a person carries, weighted by the effect of each SNP, and theoretically ranging from 0 to 16 copies.
“No event”: all individuals except those who presented any cardiovascular event (CHD, stroke or peripheral arterial disease)
Improvement in predictive capacity: discrimination and reclassification
The addition of the GRS to the basic risk function improved its capacity to predict CHD in the Framingham cohort (c-statistic, 72.81 vs. 72.37, p-value=0.042) but not in the REGICOR cohort (78.35 vs. 78.33, p-value=0.806).
We observed a general tendency for both measures of reclassification improvement, the NRI and IDI, to increase after addition of the GRS to the basic risk function, although this improvement was not statistically significant for either measure in the meta-analysis of the two cohorts. However, reclassification improvement was more marked in the group with intermediate risk, and was statistically significant for both measures (NRI: 17.44, 95%CI 8.04;26.83; IDI: 0.29, 95%CI 0.01;0.56). Reclassification data and NRI and IDI for each cohort are shown in Figure 2.
Figure 2.
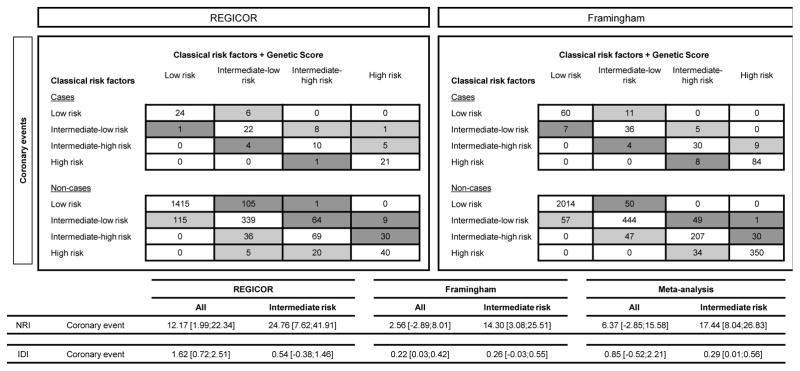
Reclassification of individuals based on the 10-year predicted risk of coronary heart disease with and without the genetic risk score. Risk categories were defined using national recommendations. In REGICOR the cut-off points were: low [0–5)%, intermediate-low [5–10)%, intermediate-high [10–15)%, and high ≥15% risk; in Framingham the cut-off points were: low [0–10)%, intermediate-low [10–15)%, intermediate-high [15–20)% and high ≥20% risk. Light grey cells represent an improvement in reclassification and dark grey cells represent the opposite.
Results for a GRS constructed from 4 SNPs that had consistent directions of effect in both cohorts, and for a GRS without the CDKN2A/B variant were similar and are described in S.A2 and S.A3.
DISCUSSION
In accordance with the AHA statement regarding assessment of the value of novel risk biomarkers [5], we have validated the association between a multi-locus GRS and incidence of CHD events in two prospective cohort studies, and have shown that this GRS improves the capacity of the Framingham risk function to predict CHD events, primarily among individuals with intermediate risk.
Validation of the association between the GRS and risk of CHD
In this study, we selected a series of genetic variants that have been found to be robustly associated with CHD risk in multiple large independent samples and populations, but have not been reported to be associated with CVRFs. Unsurprisingly, most of these variants were not nominally associated with CHD incidence in either of the cohorts in this study, mainly due to their sample size and the weak risk effects of the variants. However, the relevance of these variants for CHD risk is beyond doubt and has been validated in different meta-analyses [17].
A GRS constructed using these variants was linearly associated with incidence of CHD events in two cohorts with distinct background levels of 10-year coronary risk. The effect size of the GRS was modest (~13% increase in risk of CHD per unit), and was also independent of familial history of CHD [4]. This effect size is smaller than that reported in the initial discovery case-control studies [10], which is likely due to these studies’ tendency to overestimate the effect sizes of real associations. In fact, the effect size of our GRS could even be slightly underestimated because of the fact that the individuals included in the Framingham analysis have a more favorable cardiovascular risk profile than those who were excluded due to non-availability of DNA samples, thereby introducing a survival bias.
A recent study of the Framingham Heart Study investigators using a GRS comprising 13 SNPs associated with CHD reports the same results that we have obtained in this analysis, although the group of SNPs is slightly different and the events of interest include only myocardial infarction and coronary death [28]. We also observed a similar difference in risk between the top and bottom quintiles of the score (HR=1.44) to that reported by Ripatti et al. [8] (meta-analyzed HR=1.66) for a similar GRS comprising 13 SNPs associated with CHD, but not explicitly independent of CVRFs. However, this association has not been confirmed by other authors [29]. A number of differences between the Women’s Health Study (WHS) and the rest of studies may explain the observed discordant results, but probably the most important is related to the different sampling strategy used in the WHS which included young women with relatively low baseline risk for CHD whereas the rest of studies are community- or population-based including men and women that may have a higher baseline CHD risk.
Improvement in predictive capacity: discrimination and reclassification
As has been observed for several other biomarkers [30], we observed no marked improvement in the discriminative capacity of the risk function, as measured by the c-statistic, which highlights the challenge of risk prediction for complex traits [31]. However, some authors have expressed concerned about the use of the c-statistic as the main predictive metric, when the main goal in clinical practice is to better estimate an individual’s risk category, leading to more effective preventive treatment decisions [32]. To address this problem metrics such as IDI and NRI have been proposed that assess a risk function’s ability to re-classify individuals who go on to have a coronary event and those who do not into higher and lower risk categories, respectively [24].
In this study, we observed a general tendency for reclassification to improve after addition of the GRS to the basic risk function (Figure 2), although, as has been observed in previous studies [8,33], the numbers of cases correctly reclassified into higher risk categories was a modest fraction of the total number of cases, and also some individuals were also incorrectly reclassified. This reclassification improvement was not statistically significant overall.
Improved reclassification in individuals with intermediate coronary risk using the GRS
From a clinical perspective, the low sensitivity of risk functions is exemplified by the fact that a significant proportion of CHD events occur in individuals with intermediate coronary risk [3,34], so improving risk estimation in this group could have a significant impact on the total burden of CHD, and on the effectiveness of population-wide treatment strategies. We observed that the GRS significantly improved the reclassification of individuals with intermediate risk, above the level of improvement observed overall. Similarly, Ripatti et al. have recently reported a higher NRI in individuals with intermediate CHD risk (9.7%) than that observed in the population as a whole [8], although the improvement was less marked than for the intermediate risk group in our study (17.44%). Improvements in risk reclassification have also been observed in other studies through the inclusion of single genetic variants or a GRS in cardiovascular risk functions [8,28,33,35,36], with greater improvement in the intermediate risk group, where this has been assessed [8,33].
Strengths and limitations of the study
We highlight the following strengths in our study. First, we included two cohorts, which allowed us to evaluate the robustness of the effect size of the GRS, and to verify this effect size in populations with distinct basal cardiovascular risks. Second, the variants included in our score are likely to represent loci that are truly relevant for CHD risk. The fact that most of these variants individually were not significantly associated with CHD incidence, but that the GRS was significantly associated and also generally improved risk reclassification highlights the potential gain in information afforded by using the GRS. Third, these variants are largely independent of CVRFs, which is considered as an optimal strategy [4]. Consequently, we found that the GRS constructed from these variants was also independent of the CVRFs, and of the 10-year risk estimation based only on those CVRFs [4]. This indicates that this GRS provides complementary information to that already provided by the classical risk function. Moreover, the GRS was also found to be independent of family history of CHD [4].
Finally, and in accordance with European guidelines highlighting the importance of assessing overall cardiovascular risk [1], we have also extended our analysis to a broader definition of CVD events, including coronary events, stroke and peripheral artery disease, and observed largely consistent results to those for coronary events only (S.A1).
The main limitation of this study is the fact that the size of the individual cohorts and the number of events observed is limited. This is especially true in the REGICOR sample because of the low incidence of disease in this population. Moreover, a number of additional markers that fulfill our selection criteria have been reported since we performed our initial SNP selection in August 2010 (rs12936587, rs2505083, rs17114036 and rs11556924, reported in refs [17,37]). However, adding these 4 SNPs to the 8-SNP GRS and repeating the analyses in the Framingham cohort (genotype data for these SNPs were not available in REGICOR), we obtained similar results in terms of the strength of the per-unit and per-quintile risk effects, and similar improvements in reclassification (S.A4). These results are also consistent with those of a recent study [28], which indicated that the addition of 16 recently discovered SNPs to a 13-SNP GRS did not provide a significant improvement in discrimination between individuals with and without CVD events. Also, the findings in this study may be applicable only to European Caucasians or their descendants. Finally, due to the survival bias mentioned above, we have probably underestimated the true per unit effect size of the GRS on risk of CHD in the Framingham study.
Conclusions
A multi-locus GRS based on genetic variants unrelated to CVRFs was associated with a linear increase in risk of CHD events in two distinct populations. This GRS improves risk reclassification particularly in the population at intermediate coronary risk. These results indicate the potential value of the inclusion of genetic information in classical functions for risk assessment in the intermediate risk population group.
Supplementary Material
Highlights.
A multi-locus GRS based on genetic variants unrelated to CVRFs was associated with a linear increase in risk of CHD events in two distinct populations. This GRS improves risk reclassification particularly in the population at intermediate coronary risk. These results indicate the potential value of the inclusion of genetic information in classical functions for risk assessment in the intermediate risk population group.
Acknowledgments
Funding sources:
This work was supported by a grant from ACC1Ó (RD08-1-0024), the European Funds for Development (ERDF-FEDER), the Spanish Ministry of Science and Innovation through the Carlos III Health Institute [CIBER Epidemiología y Salud Pública, Red HERACLES RD06/0009, PI061254, PI09/90506], Fundació Marató TV3 (081810 and 080431), and by the Catalan Research and Technology Innovation Interdepartmental Commission [SGR 1195]. GL was funded by the Juan de la Cierva Program, Ministerio de Educación (JCI-2009-04684). MT was funded the Comissionat per a Universitat I Recerca del Departament d’Innovacio, Universitats I Empresa de la Generalitat de Catalunya (2007-BP-B1-0068). JMO was supported by the National Heart, Lung, and Blood Institute grants HL-54776, National Institute of Diabetes and Digestive and Kidney Diseases, Grant Number DK075030 and by contracts 53-K06-5-10 and 58-1950-9-001 from the US Department of Agriculture Research. We also thank the Spanish National DNA Bank for providing DNA samples (Project 2008/0012).
The Framingham Heart Study is conducted and supported by the National Heart, Lung, and Blood Institute (NHLBI) in collaboration with Boston University (Contract No. N01-HC-25195). This manuscript was not prepared in collaboration with investigators of the Framingham Heart Study and does not necessarily reflect the opinions or views of the Framingham Heart Study, Boston University, or NHLBI. Funding for SHARe genotyping was provided by NHLBI Contract N02-HL-64278.
The corresponding author had full access to all of the data in the study and takes responsibility for the integrity of the data and the accuracy of the data analysis.
Abbreviations and acronyms
- AHA
American Heart Association
- CHD
Coronary heart disease
- CVD
Cardiovascular diseases
- CVRFs
Cardiovascular risk factors
- DNA
Deoxyribonucleic Acid
- GRS
Genetic risk score
- GWAS
Genome-wide association studies
- IDI
integrated discrimination improvement
- MI
Myocardial infarction
- NRI
Net reclassification improvement
- REGICOR
Registre Gironí del Cor
Footnotes
Disclosures:
The authors from the Epidemiology and Cardiovascular Genetics Group, IMIM, declare that they are collaborating with the companies Gendiag.exe and Ferrer InCode in the assessment of genetic markers as a tool to improve the predictive capacity of cardiovascular risk functions. This collaboration was formalized by an agreement between these companies and IMIM, without personal benefit for the signing authors. Access to the Framingham data through the Framingham Share initiative in the Database of Genotypes and Phenotypes (Project number 1534) was available only for some of the authors (CL, IS, GL, MT, RE). ES is employee of Gendiag.exe.
Publisher's Disclaimer: This is a PDF file of an unedited manuscript that has been accepted for publication. As a service to our customers we are providing this early version of the manuscript. The manuscript will undergo copyediting, typesetting, and review of the resulting proof before it is published in its final citable form. Please note that during the production process errors may be discovered which could affect the content, and all legal disclaimers that apply to the journal pertain.
References
- 1.Graham I, Atar D, Borch-Johnsen K, et al. European guidelines on cardiovascular disease prevention in clinical practice: full text. Fourth Joint Task Force of the European Society of Cardiology and other societies on cardiovascular disease prevention in clinical practice (constituted by representatives of nine societies and by invited experts) Eur J Cardiovasc Prev Rehabil. 2007;14 (Suppl 2):S1–113. doi: 10.1097/01.hjr.0000277983.23934.c9. [DOI] [PubMed] [Google Scholar]
- 2.Wilson PW, D’Agostino RB, Levy D, Belanger AM, Silbershatz H, Kannel WB. Prediction of coronary heart disease using risk factor categories. Circulation. 1998;97:1837–47. doi: 10.1161/01.cir.97.18.1837. [DOI] [PubMed] [Google Scholar]
- 3.Marrugat J, Vila J, Baena-Diez JM, et al. Relative validity of the 10-year cardiovascular risk estimate in a population cohort of the REGICOR study. Rev Esp Cardiol. 2011;64:385–94. doi: 10.1016/j.recesp.2010.12.011. [DOI] [PubMed] [Google Scholar]
- 4.Thanassoulis G, Vasan RS. Genetic cardiovascular risk prediction: will we get there? Circulation. 2010;122:2323–34. doi: 10.1161/CIRCULATIONAHA.109.909309. [DOI] [PMC free article] [PubMed] [Google Scholar]
- 5.Hlatky MA, Greenland P, Arnett DK, et al. Criteria for evaluation of novel markers of cardiovascular risk: a scientific statement from the American Heart Association. Circulation. 2009;119:2408–16. doi: 10.1161/CIRCULATIONAHA.109.192278. [DOI] [PMC free article] [PubMed] [Google Scholar]
- 6.Hindorff LA, Junkins HA, Mehta JP, Manolio TA. A Catalog of Published Genome-Wide Association Studies. 2009 ( http://www.genome.gov/26525384)
- 7.Janssens AC, Aulchenko YS, Elefante S, Borsboom GJ, Steyerberg EW, van Duijn CM. Predictive testing for complex diseases using multiple genes: fact or fiction? Genet Med. 2006;8:395–400. doi: 10.1097/01.gim.0000229689.18263.f4. [DOI] [PubMed] [Google Scholar]
- 8.Ripatti S, Tikkanen E, Orho-Melander M, et al. A multilocus genetic risk score for coronary heart disease: case-control and prospective cohort analyses. Lancet. 2010;376:1393–1400. doi: 10.1016/S0140-6736(10)61267-6. [DOI] [PMC free article] [PubMed] [Google Scholar]
- 9.Marrugat J, D’Agostino R, Sullivan L, et al. An adaptation of the Framingham coronary heart disease risk function to European Mediterranean areas. J Epidemiol Community Health. 2003;57:634–8. doi: 10.1136/jech.57.8.634. [DOI] [PMC free article] [PubMed] [Google Scholar]
- 10.Lluis-Ganella C, Lucas G, Subirana I, et al. Additive effect of multiple genetic variants on the risk of coronary artery disease. Rev Esp Cardiol. 2010;63:925–33. doi: 10.1016/s1885-5857(10)70186-9. [DOI] [PubMed] [Google Scholar]
- 11.Grau M, Subirana I, Elosua R, et al. Trends in cardiovascular risk factor prevalence (1995–2000–2005) in northeastern Spain. Eur J Cardiovasc Prev Rehabil. 2007;14:653–9. doi: 10.1097/HJR.0b013e3281764429. [DOI] [PubMed] [Google Scholar]
- 12.Masia R, Pena A, Marrugat J, et al. High prevalence of cardiovascular risk factors in Gerona, Spain, a province with low myocardial infarction incidence. REGICOR Investigators. J Epidemiol Community Health. 1998;52:707–15. doi: 10.1136/jech.52.11.707. [DOI] [PMC free article] [PubMed] [Google Scholar]
- 13.Dawber TR, Kannel WB. The Framingham study. An epidemiological approach to coronary heart disease. Circulation. 1966;34:553–5. doi: 10.1161/01.cir.34.4.553. [DOI] [PubMed] [Google Scholar]
- 14.Kannel WB, Feinleib M, McNamara PM, Garrison RJ, Castelli WP. An investigation of coronary heart disease in families. The Framingham offspring study. Am J Epidemiol. 1979;110:281–90. doi: 10.1093/oxfordjournals.aje.a112813. [DOI] [PubMed] [Google Scholar]
- 15.Larson MG, Atwood LD, Benjamin EJ, et al. Framingham Heart Study 100K project: genome-wide associations for cardiovascular disease outcomes. BMC Med Genet. 2007;8 (Suppl 1):S5. doi: 10.1186/1471-2350-8-S1-S5. [DOI] [PMC free article] [PubMed] [Google Scholar]
- 16.Shiffman D, Louie JZ, Rowland CM, Malloy MJ, Kane JP, Devlin JJ. Single variants can explain the association between coronary heart disease and haplotypes in the apolipoprotein(a) locus. Atherosclerosis. 2010;212:193–6. doi: 10.1016/j.atherosclerosis.2010.05.009. [DOI] [PubMed] [Google Scholar]
- 17.The CARDIoGRAM Consortium. Large-scale association analysis identifies 13 new susceptibility loci for coronary artery disease. Nat Genet. 2011;43:333–8. doi: 10.1038/ng.784. [DOI] [PMC free article] [PubMed] [Google Scholar]
- 18.Grau M, Subirana I, Elosua R, et al. Why should population attributable fractions be periodically recalculated? An example from cardiovascular risk estimation in southern. Europe Prev Med. 2010;51:78–84. doi: 10.1016/j.ypmed.2010.03.012. [DOI] [PubMed] [Google Scholar]
- 19.Cupples LA, D’Agostino RB, Kiely D. Survival following cardiovascular events: 30 year follow-up. Bethesda, MD: National Heart, Lung and Blood Institute; 1988. The Framingham Heart Study, Section 35. An epidemiological investigation of cardiovascular disease. [Google Scholar]
- 20.Purcell S, Neale B, Todd-Brown K, et al. PLINK: a tool set for whole-genome association and population-based linkage analyses. Am J Hum Genet. 2007;81:559–75. doi: 10.1086/519795. [DOI] [PMC free article] [PubMed] [Google Scholar]
- 21.DerSimonian R, Laird N. Meta-analysis in clinical trials. Control Clin Trials. 1986;7:177–88. doi: 10.1016/0197-2456(86)90046-2. [DOI] [PubMed] [Google Scholar]
- 22.D’Agostino RB, Nam BH. Handbook of Statistics Advances in Survival Analysis. N.B. Elsevier; 2003. Evaluation of the Performance of Survival Analysis Models: Discrimination and Calibration Measures; pp. 1–25. [Google Scholar]
- 23.Newson R. Confidence intervals for rank statistics: Somers’ D and extensions. Stata Journal. 2006;6:309–34. [Google Scholar]
- 24.Pencina MJ, D’Agostino RB, Sr, Steyerberg EW. Extensions of net reclassification improvement calculations to measure usefulness of new biomarkers. Stat Med. 2011;30:11–21. doi: 10.1002/sim.4085. [DOI] [PMC free article] [PubMed] [Google Scholar]
- 25.Chambless LE, Cummiskey CP, Cui G. Several methods to assess improvement in risk prediction models: Extension to survival analysis. Stat Med. 2010;30:22–38. doi: 10.1002/sim.4026. [DOI] [PubMed] [Google Scholar]
- 26.Steyerberg EW, Pencina MJ. Reclassification calculations for persons with incomplete follow-up. Ann Intern Med. 2010;152:195–6. doi: 10.7326/0003-4819-152-3-201002020-00019. [DOI] [PubMed] [Google Scholar]
- 27.R Development Core Team. R: A language and environment for statistical computing. R Foundation for Statistical Computing; Vienna, Austria: 2010. ( http://www.R-project.org/) [Google Scholar]
- 28.Thanassoulis G, Peloso GM, Pencina MJ, et al. A Genetic Risk Score is Associated with Incident Cardiovascular Disease and Coronary Artery Calcium - The Framingham Heart Study. Circ Cardiovasc Genet. 2012 doi: 10.1161/CIRCGENETICS.111.961342. Epub ahead of print. [DOI] [PMC free article] [PubMed] [Google Scholar]
- 29.Paynter NP, Chasman DI, Pare G, et al. Association between a literature-based genetic risk score and cardiovascular events in women. JAMA. 2010;303:631–7. doi: 10.1001/jama.2010.119. [DOI] [PMC free article] [PubMed] [Google Scholar]
- 30.Wang TJ, Gona P, Larson MG, et al. Multiple biomarkers for the prediction of first major cardiovascular events and death. N Engl J Med. 2006;355:2631–9. doi: 10.1056/NEJMoa055373. [DOI] [PubMed] [Google Scholar]
- 31.Ware JH. The limitations of risk factors as prognostic tools. N Engl J Med. 2006;355:2615–7. doi: 10.1056/NEJMp068249. [DOI] [PubMed] [Google Scholar]
- 32.Cook NR. Use and misuse of the receiver operating characteristic curve in risk prediction. Circulation. 2007;115:928–35. doi: 10.1161/CIRCULATIONAHA.106.672402. [DOI] [PubMed] [Google Scholar]
- 33.Brautbar A, Ballantyne CM, Lawson K, et al. Impact of adding a single allele in the 9p21 locus to traditional risk factors on reclassification of coronary heart disease risk and implications for lipid-modifying therapy in the Atherosclerosis Risk in Communities study. Circ Cardiovasc Genet. 2009;2:279–85. doi: 10.1161/CIRCGENETICS.108.817338. [DOI] [PMC free article] [PubMed] [Google Scholar]
- 34.Greenland P, LaBree L, Azen SP, Doherty TM, Detrano RC. Coronary artery calcium score combined with Framingham score for risk prediction in asymptomatic individuals. JAMA. 2004;291:210–5. doi: 10.1001/jama.291.2.210. [DOI] [PubMed] [Google Scholar]
- 35.Kathiresan S, Melander O, Anevski D, et al. Polymorphisms associated with cholesterol and risk of cardiovascular events. N Engl J Med. 2008;358:1240–9. doi: 10.1056/NEJMoa0706728. [DOI] [PubMed] [Google Scholar]
- 36.Talmud PJ, Cooper JA, Palmen J, et al. Chromosome 9p21. 3 coronary heart disease locus genotype and prospective risk of CHD in healthy middle-aged men. Clin Chem. 2008;54:467–74. doi: 10.1373/clinchem.2007.095489. [DOI] [PubMed] [Google Scholar]
- 37.Coronary Artery Disease (C4D) Genetics Consortium. A genome-wide association study in Europeans and South Asians identifies five new loci for coronary artery disease. Nat Genet. 2011;43:339–44. doi: 10.1038/ng.782. [DOI] [PubMed] [Google Scholar]
Associated Data
This section collects any data citations, data availability statements, or supplementary materials included in this article.