

Abstract
Autosomal dominant polycystic kidney disease (ADPKD) is the most common inherited renal disease, and sirolimus, a mammalian target of rapamycin (mTOR) inhibitor, has been shown to significantly retard cyst expansion in animal models. The optimal therapeutic dose of sirolimus is not yet defined. Here, we report the history of a previously unknown ADPKD deceased donor whose kidneys were engrafted in two different recipients. One of the two received an immunosuppressive regimen based on sirolimus for 5 years while the other did not. After transplantation, both patients developed severe transplant cystic disease. Donor DNA sequence identified a new hypomorphic mutation in PKD1. The rate of cyst growth was identical in the two patients regardless of the treatment. While sirolimus treatment reduced the activation of mTOR in peripheral blood mononuclear cells, it failed to prevent mTOR activation in kidney tubular cells, this could account for the inefficiency of treatment on cyst growth. Together, our results suggest that the dose of sirolimus required to inhibit mTOR varies according to the tissue
Keywords: Disease transmission, DNA sequencing, donor risk, mTOR inhibitor, peripheral blood, polycystic kidney disease, renal allograft biopsies, renal medicine, sirolimus
Introduction
Autosomal dominant polycystic kidney disease (ADPKD) is the most common inherited renal disease, occurring in 1 out of every 1000 people in the general population (1). Mutations in two genes, PKD1(encoding polycystin-1, PC-1) and PKD2 (encoding polycystin-2, PC-2), account for approximately 85% and 15% of all cases of ADPKD (2). The pathophysiology of polycystic kidney disease (PKD) is complex and remains largely unknown. Cystogenesis has been related to increased cell proliferation and apoptosis, abnormal secretion, remodeling of the extracellular matrix and abnormal planar cell polarity (1,3). Many signaling pathways have been shown to be activated in PKD, including the mammalian target of rapamycin (mTOR) pathway (3– 6). Cumulative evidence in rodent models has shown that mTOR inhibitors (e.g. sirolimus and everolimus) can significantly retard cyst expansion (6,7). Furthermore, recent data from retrospective studies of ADPKD patients after kidney transplantation have shown a significant reduction in kidney and hepatic cyst volume in those treated with sirolimus as compared to those receiving calcineurin inhibitors (6,8). Accordingly, four randomized prospective clinical trials are in progress (NCT00346918, NCT00491517, NCT00286156 and NCT00414440). However, the optimal serum concentration of sirolimus or everolimus required to inhibit mTOR pathway in the kidney is not known.
Case Report
The probant was a 30-year-old male donor who died in January 2004 due to the rupture of an intracranial aneurysm. There was no clinical evidence of kidney disease in either the donor or his family. His kidneys and liver were engrafted in three different recipients. The left kidney was transplanted into a 42-year-old man who had been on hemodialysis for 3 years due to IgA nephropathy. At time of transplantation, the duration of cold ischemia was 16 h, and his immunosuppressive regimen included steroids, tacrolimus and mycophenolate mofetil. This patient will be referred as patient 1 (Siro −). The right kidney was transplanted into a 40-year-old woman who had been on hemodialysis for 2.5 years due to interstitial nephritis. At time of transplantation, the duration of cold ischemia was 17 h, and her immunosuppressive regimen included steroids, tacrolimus and sirolimus at a daily dose of 2 mg. This patient will be referred as patient 2 (Siro +). Clinical and biological data (e.g. serum creatinine level and sirolimus concentration) were monitored every month the first year and every 3 months thereafter. The patients were followed over 5 years.
At the time of transplantation, macroscopic and ultrasonographic exams did not reveal any cyst formation in the kidney or liver. The early follow-up of both patients was successful and uneventful, except an acute cellular rejection episode that was successfully treated by steroid infusions in patient 2 (Siro +) at 3 months after transplantation. A few months after transplantation, we observed the development of a polycystic kidney phenotype in both kidneys. This phenotype in combination with the rupture of an intracranial aneurysm as the cause of death led us to hypothesize that the donor carried a PKD mutation.
Material and Methods
Clinical samples
The control group was composed of four kidney transplant recipients (two males, two females; mean age of 42.4 years, range 30–51 years) and four healthy volunteers (two males, two females; mean age of 31.8 years, range 23–38 years). All patients provided written informed consent.
DNA sequencing
DNA was extracted using standard techniques from peripheral blood mononuclear cells (PBMCs) taken from the patient at time of procurement. Mutation screening was performed by direct sequencing of all the PKD1 and PKD2 exons and flanking intronic regions as previously described (2).
Volumetric determination
Magnetic resonance imaging (MRI) was used to determine the volume of each kidney and total cyst volume calculated as described in the CRISP study (9). MRI was performed at 4 and 5 years after transplantation in both kidney transplant recipients. Kidney volume was measured using T1-weighted images as previously described (9–11). In brief, the volume was calculated by summing the products of the area measurements and slice thickness. A region-based threshold method was used to calculate cyst volume. In addition, the diameters of three randomly selected cysts were measured in both recipients.
Renal function and morphology
The serum creatinine level was measured monthly during the first year and every 3 months thereafter using a Synchron CX4 autoanalyser (Beckman Coulter, Villepinte, France). Glomerular filtration rate was evaluated by iohexol clearance, 4 years after transplantation as previously described (12). Sirolimus serum levels were determined monthly by high-performance liquid chromatography during the first year and every 3 months thereafter. Blood was taken 12 h after the previous dose.
Biopsies from patient 1 (Siro −) and 2 (Siro +) and the transplant recipient in the control group were all available for this study. Biopsies were routinely performed in all recipients 1 year after transplantation. The tumor-free pole of kidneys removed for carcinoma (n = 4) were used as controls. Kidney biopsies were fixed in alcohol–formalin–acetic acid solution and embedded paraffin, and 4-μm sections were stained with periodic acid Schiff, Masson's trichrome, hematoxylin and eosin.
Immunohistochemistry
For immunohistochemistry, 4-μm sections were incubated with either a rabbit antihuman phospho-S6 ribosomal protein (Ser240/244) antibody (Cell Signaling Technologies) at 1:100 or a rabbit antimouse phospho-4E-BP1 (Thr 37/46) antibody (Cell Signaling Technology, Danvers, MA) at 1:100, followed by an antirabbit biotinylated antibody (Dako) at 1:200. The biotinylated antibody was detected using HRP-labeled streptavidin (Dako) at 1:500 and 3-3′-diamino-benzidine-tetrahydrochloride (DAB). Liver tumors from PTEN −/− mice and kidneys from S6 kinase 1 and 2−/− mice were used as positive and negative control, respectively, for the phospho-S6 ribosomal protein antibody. The phospho-4E-BP1 antibody was replaced by an unrelated antibody of the same subclass as an isotype control. PTEN−/− and S6 kinase 1 and 2 −/− mice were kindly provided by Mario Pende (INSERM U845, Paris).
Western blot
PBMCs were isolated and western blot were performed as previously described (13,14), using a rabbit antibody to human phospho-p70 S6 kinase (Thr389) (Cell Signaling Technologies) at 1:1000 followed by a horseradish peroxidase-conjugated antirabbit secondary antibody at 1:10,000 (Dako). The phosphorylation status of the p70 S6 kinase at the Thr389 site is specific for mTOR phosphorylation (15). A mouse monoclonal anti-β-actin antibody (Sigma-Aldrich, Lyon, France) was used as control. Protein phosphorylation levels were normalized to the matching densitometric values of β-actin.
Results
A new PKD1 mutation
To test the hypothesis that the donor carried a PKD mutation, we sequenced PKD1 and PKD2 genes. This screening revealed a novel PKD1 in-frame deletion A3571_3572delAV (10710_10715del6) as the only likely mutation (Figure 1A). This deletion is located in the fourth transmembrane (TM) region of polycystin-1 and is predicted to change the site of the TM domain to four amino acids earlier than normal.
Figure 1. Molecular characterization and pathological consequence of the A3571_3572delAV PKD1 mutation.
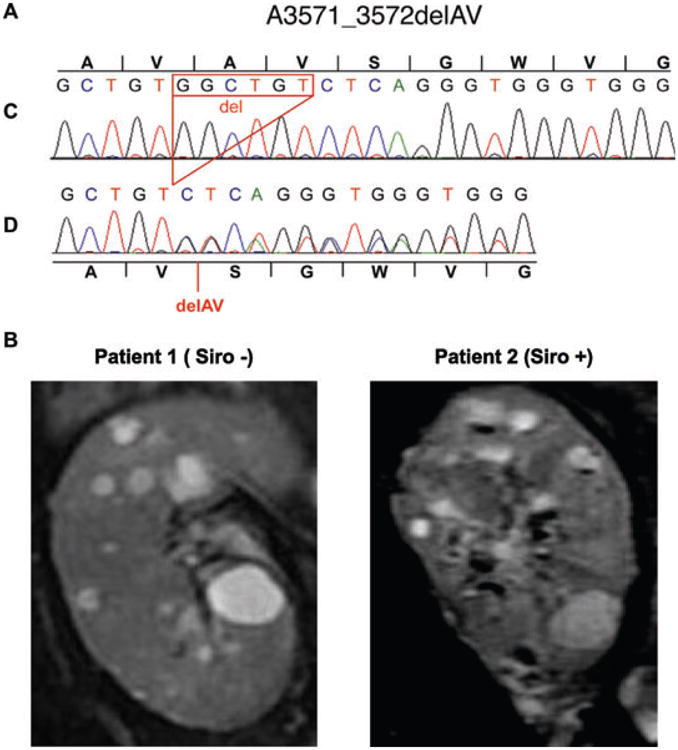
Panel A shows DNA sequencing of the control (C) and donor (D) alleles showing a six-nucleotide deletion resulting in the in-frame deletion of two amino acid, A3571_3572delAV. Panel B shows coronal T2-weighted MRI images of the two transplanted kidneys at 5 years after transplantation.
Sirolimus impact on total kidney volume and renal function
To investigate the effect of long-term administration of sirolimus on cyst growth, we performed an MRI study at 4 years after transplantation in both patients. In patient 1 (Siro −), the total kidney volume was 255 cm3 and the total cyst volume was 23.5 cm3. One year later, the total kidney volume and total cyst volume had increased by 9.8% and 13.6%, respectively (Table 1 and Figure 1B). In patient 2 (Siro +), the total kidney volume and total cyst volume were essentially the same as in patient 1 (Siro −) 4 years after transplantation (246 cm3 and 21.4 cm3, respectively) (Table 1 and Figure 1 B), and the MRI performed 1 year later showed the same rate of kidney and cyst growth (12.9% and 17.2%, respectively). In addition, the diameters of three randomly selected cysts were essentially the same in both patients (Table 1).
Table 1. Impact of sirolimus on kidney and cyst growth.
| Patient 1 (Siro −) | Patient 2 (Siro +) | |||
|---|---|---|---|---|
|
|
|
|||
| Years post-Tx | 4 | 5 | 4 | 5 |
| Total kidney volume (cm3) | 255 | 280 | 246 | 277.8 |
| Total cyst volume (cm3) | 23.5 | 26.7 | 21.4 | 25.1 |
| Cyst 1 diameter (mm) | 22.4 × 13 | 24 × 13.9 | 21 × 16 | 23.5 × 18 |
| Cyst 2 diameter (mm) | 18.4 × 11 | 19.5 × 11.7 | 13 × 9.3 | 15 × 10 |
| Cyst 3 diameter (mm) | 16.1 × 12 | 17.1 × 13 | 12.6 × 7.8 | 13.2 × 8.9 |
Tx: Transplantation.
The serum creatinine level remained stable in both patients during the follow-up with a mean value of 89.8 ± 14.1 μmol/L in patient 1 (Siro −) and 95.9 ± 13.9 μmol/L in patient 2 (Siro +) (data not shown and Figure 2C). The glomerular filtration rate was 51 mL/min/1.73 m2 and 54 mL/min/1.73 m2 in patient 1 (Siro −) and patient 2 (Siro +) at 4 years after transplantation.
Figure 2. Impact of sirolimus on mammalian target of rapamycin (mTOR) pathway.

Panel A shows inhibition of mTOR pathway by sirolimus in peripheral blood mononuclear cells (PBMCs). A representative western blot of the phosphorylation status of p70 S6 kinase in PBMCs is shown for the control (C, n = 4), the transplant recipient without sirolimus (Tx, n = 4), patient 1 (Siro −) and patient 2 (Siro +). Panel B shows the activity of the mTOR pathway in the kidneys. Representative immunohistochemistry for two downstream targets of mTOR (phospho-S6 ribosomal protein and phospho-4E-BP1) is shown on serial section of samples derived from tumor-free pole of native kidneys (control kidney, n = 4), non-PKD control transplant biopsies (n = 4), and the transplant biopsies from patient 1 (Siro −) and 2 (Siro +). Scale bar 100 μm. Panel C shows the 5 years of follow-up for the serum creatinine and serum sirolimus levels of patient 2 (Siro +).
mTOR pathway activity
Given that the rates of total kidney volume and total cyst volume progression were identical in the two kidney recipients, we next investigated the efficacy of sirolimus in inhibiting the mTOR pathway. To that end, we studied the phosphorylation status of p70 S6 kinase in PBMCs. Western blot analysis showed that p70 S6 kinase was highly phosphorylated in healthy volunteers, but this phosphorylation was slightly decreased after transplantation (19 ± 5.2%, p = NS). More importantly, sirolimus treatment completely prevented the phosphorylation of p70 S6 kinase in PBMCs from patient 2 (Siro +) (Figure 2A).
To evaluate the impact of sirolimus on renal tissue, we analyzed the phosphorylation of two other downstream targets of mTOR, phospho-S6 ribosomal protein and phospho-4E-BP1. In the control kidneys, the antibodies failed to detect any phosphorylation (Figure 2B). Similarly, after transplantation in the non-PKD patients, the biopsies did not show a phosphorylation signal. In transplanted PKD kidney of patient 1 (Siro −) and 2 (Siro +), however, we observed intense cytoplasmic staining for both phospho-S6 ribosomal protein and phospho-4E-BP1, mainly localized in tubular cells. In addition, using serial sections, we were able to show that phospho-S6 ribosomal protein and phospho-4E-BP1 staining colocalized in the same tubular segments (data not shown). Notably, the intensity of the staining was identical in the two patients regardless of sirolimus, indicating the absence of intratubular inhibition of mTOR. Of note, the intersitial fibrosis and tubular atrophy (IF/TA) scores assessed by the BANFF'05 classification were similar in patient 1 (IF/TA 1) and in patient 2 (IF/TA 1).
Serum sirolimus level
Finally, we retrospectively evaluated the serum concentration of sirolimus. During all 5 years follow-up, sirolimus was never interrupted and the mean serum sirolimus concentration was 3.68 ± 1.04 μg/L (range: 2.3–7.3 μg/L) (Figure 2C). Of note, at the time of biopsy, sirolimus serum concentration was 4.1 μg/L.
Discussion
ADPKD is the most common inherited renal disease and is associated with intracranial aneurism. Thus, the posttransplant discovery of ADPKD in a donor kidney is a rare but not exceptional event (16–21). Typically, the diagnosis is clinically evident and does not require confirmation at the molecular level. The occurrence of a polycystic kidney phenotype in the two recipients and the association with a cerebral aneurism suggest that our donor may have had a PKD mutation. By carrying out mutation screening, we identified a novel PKD1 gene mutation involving the deletion of two amino acids, A3571_3572delAV, in the PKD1 gene in the fourth TM domain. Since the TM domain is not predicted to be lost, simply moved, and considering that no cysts were detected by ultrasound up to 30 years, this could represent a hypomorphic mutation, as previously suggested (22).
After 5 years of uninterrupted treatment, the rates of total kidney and cyst volume progression assessed by MRI were similar in both patients. Interestingly, the rate of progression was within the range reported by the CRISP study (23 ± 22.2 mL/year) (9). In the last few years, several studies using experimental models of PKD have shown that proliferative burst favors cyst formation. In particular, it has been demonstrated that ischemia-reperfusion injury may promote tubular cell proliferation and cystogenesis (23,24). Thus, a longer time of cold ischemia in patient 2 (Siro +) could have explained the absence of cyst reduction/retardation. However, the cold ischemia times were similar for the two recipients, arguing against this hypothesis.
Cystogenesis in ADPKD is associated with dysregulation of multiple molecular pathways. Intact polycystins are essential to maintain the differentiated phenotype of tubular cells, and the reduction in either of these proteins leads to a polycystic phenotype (4). The mTOR pathway is inappropriately activated both in animal models of ADPKD and patients with PKD (6,25). Thus, beside vaptans and somatostatin agonist (3), mTOR inhibitors such as sirolimus or everolimus represent a promising therapeutic strategy. To date, the optimal serum concentration of these drugs able to simultaneously inhibit the mTOR pathway in kidney and avoid side effects is not known. Two small retrospective studies of ADPKD patients after transplantation have shown a significant reduction in the volume of the polycystic kidneys or polycystic liver in patients treated with sirolimus compared with patients treated with calcineurin inhibitors (6,8). However, none of them described the sirolimus dosages or sirolimus blood level used in these retrospective cohorts. For these reasons, the serum level used in the four ongoing clinical trials is extremely heterogeneous (ranging from 4 to 15 μg/L) (3). Sirolimus is an immunosuppressive drug associated with a high risk for severe adverse events (e.g. myelosuppression, hyperlipidemia, impaired wound healing, proteinuria and serious infection) (26). In renal transplant recipients, the incidence of these side effects is quite high (up to 50%), leading to breaks in drug treatment in 10% of patients (26,27). Notably, adverse reactions to sirolimus and their severity seem to be correlated with the dose (28). Thus a determination of the critical serum level of sirolimus and everolimus needed to completely inhibit the basal mTOR pathway in the kidneys of ADPKD is a crucial issue. A simple approach could be to measure mTOR pathway activity in PBMCs and to extrapolate these results to other tissues. Our study, however, argues against this method. In fact, we observed that, although a sirolimus serum level of 3 μg/L resulted in mTOR inhibition in PBMCs, the pathway was still active in kidney. Interestingly, a previous study showed constant inhibition of mTOR pathway in PBMCs when the serum concentration of sirolimus was higher than 6 μg/L (14). These disparate results could be due to our use of different downstream targets of mTOR to measure the pathway activity in PBMCs and the kidneys. The fact that 4E-BP1and p70 S6 kinase are direct targets of mTOR, however, exclude this hypothesis (15).
One could also hypothesize that sirolimus/tacrolimus interaction in patient 2 is a confounding variable. At the molecular level both molecules bind and inhibit FBP12, which is also a known inhibitor of TGF-β receptor (29). The synergistic activation of TGF-β receptor could theoretically lead to more extracellular matrix production in patient 2. However, identical fibrosis scores (IF/TA 1) in graft biopsies argue against this hypothesis.
Taken together, our results suggest that kidney biopsies are required to predict inhibition of mTOR pathway in patients treated with sirolimus. Furthermore, they also suggest that the lack of efficacy of sirolimus with regard to cyst growth in our case was due to a low concentration of sirolimus. In the near future, ongoing clinical trials with sirolimus serum concentration ranging from 4 to 15 μg/L, will be able to answer to this question.
References
- 1.Wilson PD. Polycystic kidney disease. N Engl J Med. 2004;350:151–164. doi: 10.1056/NEJMra022161. [DOI] [PubMed] [Google Scholar]
- 2.Rossetti S, Consugar MB, Chapman AB, et al. Comprehensive molecular diagnostics in autosomal dominant polycystic kidney disease. J Am Soc Nephrol. 2007;18:2143–2160. doi: 10.1681/ASN.2006121387. [DOI] [PubMed] [Google Scholar]
- 3.Torres VE, Harris PC. Autosomal dominant polycystic kidney disease: The last 3 years. Kidney Int. 2009;76:149–168. doi: 10.1038/ki.2009.128. [DOI] [PMC free article] [PubMed] [Google Scholar]
- 4.Harris PC, Torres VE. Polycystic kidney disease. Annu Rev Med. 2009;60:321–337. doi: 10.1146/annurev.med.60.101707.125712. [DOI] [PMC free article] [PubMed] [Google Scholar]
- 5.Edelstein CL. Mammalian target of rapamycin and caspase inhibitors in polycystic kidney disease. Clin J Am Soc Nephrol. 2008;3:1219–1226. doi: 10.2215/CJN.05611207. [DOI] [PubMed] [Google Scholar]
- 6.Shillingford JM, Murcia NS, Larson CH, et al. The mTOR pathway is regulated by polycystin-1, and its inhibition reverses renal cystogenesis in polycystic kidney disease. Proc Natl Acad Sci USA. 2006;103:5466–5471. doi: 10.1073/pnas.0509694103. [DOI] [PMC free article] [PubMed] [Google Scholar]
- 7.Tao Y, Kim J, Schrier RW, Edelstein CL. Rapamycin markedly slows disease progression in a rat model of polycystic kidney disease. J Am Soc Nephrol. 2005;16:46–51. doi: 10.1681/ASN.2004080660. [DOI] [PubMed] [Google Scholar]
- 8.Qian Q, Du H, King BF, et al. Sirolimus reduces polycystic liver volume in ADPKD patients. J Am Soc Nephrol. 2008;19:631–638. doi: 10.1681/ASN.2007050626. [DOI] [PMC free article] [PubMed] [Google Scholar]
- 9.Grantham JJ, Torres VE, Chapman AB, et al. Volume progression in polycystic kidney disease. N Engl J Med. 2006;354:2122–2130. doi: 10.1056/NEJMoa054341. [DOI] [PubMed] [Google Scholar]
- 10.Chapman AB, Guay-Woodford LM, Grantham JJ, et al. Renal structure in early autosomal-dominant polycystic kidney disease (ADPKD): The consortium for radiologic imaging studies of polycystic kidney disease (CRISP) cohort. Kidney Int. 2003;64:1035– 1045. doi: 10.1046/j.1523-1755.2003.00185.x. [DOI] [PubMed] [Google Scholar]
- 11.Bae KT, Commean PK, Lee J. Volumetric measurement of renal cysts and parenchyma using MRI: Phantoms and patients with polycystic kidney disease. J Comput Assist Tomogr. 2000;24:614–619. doi: 10.1097/00004728-200007000-00019. [DOI] [PubMed] [Google Scholar]
- 12.Stevens LA, Levey AS. Measured GFR as a confirmatory test for estimated GFR. J Am Soc Nephrol. 2009;20:2305–2313. doi: 10.1681/ASN.2009020171. [DOI] [PubMed] [Google Scholar]
- 13.Boulay A, Zumstein-Mecker S, Stephan C, et al. Antitumor efficacy of intermittent treatment schedules with the rapamycin derivative RAD001 correlates with prolonged inactivation of ribosomal protein S6 kinase 1 in peripheral blood mononuclear cells. Cancer Res. 2004;64:252–261. doi: 10.1158/0008-5472.can-3554-2. [DOI] [PubMed] [Google Scholar]
- 14.Hartmann B, Schmid G, Graeb C, et al. Biochemical monitoring of mTOR inhibitor-based immunosuppression following kidney transplantation: A novel approach for tailored immunosuppressive therapy. Kidney Int. 2005;68:2593–2598. doi: 10.1111/j.1523-1755.2005.00731.x. [DOI] [PubMed] [Google Scholar]
- 15.Wullschleger S, Loewith R, Hall MN. TOR signaling in growth and metabolism. Cell. 2006;124:471–484. doi: 10.1016/j.cell.2006.01.016. [DOI] [PubMed] [Google Scholar]
- 16.Spees EK, Orlowski JP, Fitting KM, Temple DM, Reynolds CP. Successful use of cadaver kidneys from diabetic donors for transplantation. Transplant Proc. 1990;22:378–379. [PubMed] [Google Scholar]
- 17.Mancini G, Comparini L, Salvadori M. Transplant of a polycystic kidney because of organ shortage. Transplant Proc. 1990;22:376. [PubMed] [Google Scholar]
- 18.Siegal B. The polycystic kidney donor. Transplantation. 1992;54:1131. [PubMed] [Google Scholar]
- 19.Shan YS, Lee PC, Sy ED, Hung CJ, Lin YJ. Polycystic kidney patient as a cadaveric donor: Is it appropriate? Nephrol Dial Transplant. 2001;16:410–411. doi: 10.1093/ndt/16.2.410. [DOI] [PubMed] [Google Scholar]
- 20.Powell CR, Tata S, Govani MV, Chien GW, Orvieto MA, Shalhav AL. Transplantation of a cadaveric polycystic kidney in a patient with autosomal dominant polycystic kidney disease: Long-term outcome. Transplant Proc. 2004;36:1288–1292. doi: 10.1016/j.transproceed.2004.05.003. [DOI] [PubMed] [Google Scholar]
- 21.Howard RJ, Reed AI, Van Deer Warf WJ, Silkiness JA, Patton PR, Scorned JC. Development of polycystic disease in a kidney 10 years after transplantation. Transplantation. 1999;68:1620. doi: 10.1097/00007890-199911270-00034. [DOI] [PubMed] [Google Scholar]
- 22.Rossetti S, Kubly VJ, Consugar MB, et al. Incompletely penetrant PKD1 alleles suggest a role for gene dosage in cyst initiation in polycystic kidney disease. Kidney Int. 2009;75:848–855. doi: 10.1038/ki.2008.686. [DOI] [PMC free article] [PubMed] [Google Scholar]
- 23.Piontek K, Menezes LF, Garcia-Gonzalez MA, Huso DL, Germino GG. A critical developmental switch defines the kinetics of kidney cyst formation after loss of PKD1. Nat Med. 2007;13:1490– 1495. doi: 10.1038/nm1675. [DOI] [PMC free article] [PubMed] [Google Scholar]
- 24.Verdeguer F, Le Corre S, Fischer E, et al. A mitotic transcriptional switch in polycystic kidney disease. Nat Med. 2010;16:106–110. doi: 10.1038/nm.2068. [DOI] [PMC free article] [PubMed] [Google Scholar]
- 25.Wahl PR, Serra AL, Le Hir M, Molle KD, Hall MN, Wuthrich RP. Inhibition of mTOR with sirolimus slows disease progression in Han: SPRD rats with autosomal dominant polycystic kidney disease (ADPKD) Nephrol Dial Transplant. 2006;21:598–604. doi: 10.1093/ndt/gfi181. [DOI] [PubMed] [Google Scholar]
- 26.Ekberg H, Tedesco-Silva H, Demirbas A, et al. Reduced exposure to calcineurin inhibitors in renal transplantation. N Engl J Med. 2007;357:2562–2575. doi: 10.1056/NEJMoa067411. [DOI] [PubMed] [Google Scholar]
- 27.Russ G, Segoloni G, Oberbauer R, et al. Superior outcomes in renal transplantation after early cyclosporine withdrawal and sirolimus maintenance therapy, regardless of baseline renal function. Transplantation. 2005;80:1204–1211. doi: 10.1097/01.tp.0000178393.78084.9b. [DOI] [PubMed] [Google Scholar]
- 28.Letavernier E, Bruneval P, Mandet C, et al. High sirolimus levels may induce focal segmental glomerulosclerosis de novo. Clin J Am Soc Nephrol. 2007;2:326–333. doi: 10.2215/CJN.03751106. [DOI] [PubMed] [Google Scholar]
- 29.Wang T, Li BY, Danielson PD, et al. The immunophilin FKBP12 functions as a common inhibitor of the TGF beta family type I receptors. Cell. 1996;86:435–444. doi: 10.1016/s0092-8674(00)80116-6. [DOI] [PubMed] [Google Scholar]