Short abstract
The current study was performed to evaluate the accuracy of computational assessment of the influence of the orientation of the patellar tendon on the patellofemoral pressure distribution. Computational models were created to represent eight knees previously tested at 40 deg, 60 deg, and 80 deg of flexion to evaluate the influence of hamstrings loading on the patellofemoral pressure distribution. Hamstrings loading increased the lateral and posterior orientation of the patellar tendon, with the change for each test determined from experimentally measured variations in tibiofemoral alignment. The patellar tendon and the cartilage on the femur and patella were represented with springs. After loading the quadriceps, the total potential energy was minimized to determine the force within the patellar tendon. The forces applied by the quadriceps and patellar tendon produced patellar translation and rotation. The deformation of each cartilage spring was determined from overlap of the cartilage surfaces on the femur and patella and related to force using linear elastic theory. The patella was iteratively adjusted until the extension moment, tilt moment, compression, and lateral force acting on the patella were in equilibrium. For the maximum pressure applied to lateral cartilage and the ratio of the lateral compression to the total compression, paired t-tests were performed at each flexion angle to determine if the output varied significantly (p < 0.05) between the two loading conditions. For both the computational and experimental data, loading the hamstrings significantly increased the lateral force ratio and the maximum lateral pressure at multiple flexion angles. For the computational data, loading the hamstrings increased the average lateral force ratio and maximum lateral pressure by approximately 0.04 and 0.3 MPa, respectively, compared to experimental increases of 0.06 and 0.4 MPa, respectively. The computational modeling technique accurately characterized variations in the patellofemoral pressure distribution caused by altering the orientation of the patellar tendon.
Keywords: patellofemoral joint, computational model, pressure, cartilage, patellar tendon
Introduction
Patellofemoral pain is commonly attributed to overloading of the lateral patellofemoral cartilage. The forces applied to the patella by the quadriceps muscles and the patellar tendons have a lateral orientation. Anatomical conditions, such as a lateralized tibial tuberosity [1] or a weak vastus medialis obliquus [2], can elevate the lateral force and moment acting on patella, increasing the pressure applied to lateral cartilage. Overloading cartilage can lead to degradation, and eventually arthrosis [3]. Pain can develop due to overloading the subchondral bone, activating subchondral nociceptive fibers [4].
Both finite element analysis [5–9] and discrete element analysis (DEA) [10–14] modeling techniques are commonly used to evaluate how factors related to anatomy, muscle loading, and surgical realignment influence the patellofemoral pressure distribution. DEA models treat the patellofemoral cartilage as a layer of compressive springs separating rigid bones, with the soft tissue restraints treated as tensile springs. The simplified representation of soft tissues reduces the time required for model development and analysis, making DEA techniques valuable for studies applying parametric variations to multiple knees, and potentially a tool for preoperative planning. The simplified representation of soft tissues also emphasizes the need for evaluation of the accuracy of the DEA models.
Pressure measurements from DEA have been compared to in vitro experimental measurements previously [14,15]. For these studies, forces applied by the quadriceps muscles were varied to determine the influence on parameters such as the maximum pressure and proportion of the contact force applied to the lateral facet of the patella. The orientation of the patellar tendon, which influences the patellofemoral pressure distribution [16–18], has not been addressed in previous accuracy assessments. Because the patellar tendon is represented with springs instead of forces directly applied to the patella, an additional assessment focused on the orientation of the patellar tendon is needed. The previous models also combined the cartilage on the femur and patella into a single layer of springs within the contact area, which ignored the shape of the cartilage surfaces and limited the ability to accurately represent the contact pressure distribution. A modeling technique has been developed to improve characterization of the patellofemoral pressure distribution through DEA. The current accuracy assessment focuses on the influence of the orientation of the patellar tendon on the pressure distribution.
Methods
Computational models were created to represent eight cadaveric knees that were previously tested in vitro. The in vitro study addressed the influence of hamstrings loading on the patellofemoral pressure distribution [19]. Hamstrings loading increased tibial external rotation and posterior translation [20], shifting the tibial tuberosity laterally and posteriorly. The knees were tested in isometric knee extension at 40 deg, 60 deg, and 80 deg of flexion, with the femur fixed horizontally. An elevated lateral force acting on the patella was simulated by osteotomizing the tibial tuberosity and shifting the tuberosity laterally by approximately 5 mm. Loading cables run over pulleys applied forces through the vastus medialis obliquus (27 N), the vastus lateralis (127 N), and the combination of the vastus intermedius/vastus medialis longus/rectus femoris (432 N), representing a quadriceps force distribution with a weak vastus medialis obliquus characteristic of patients with patellofemoral pain [21]. The hamstrings forces were applied through the semimembranosus (100 N) and the biceps femoris (100 N) tendons in a direction parallel to the long axis of the femur. The only change to patellar loading due to loading the hamstrings was the altered orientation of the patellar tendon.
The patellofemoral pressure distribution and patellofemoral and tibiofemoral kinematics were measured for each test. The pressure distribution was measured using thin (0.1 mm thick) film sensors (I-Scan 5051, Tekscan, Boston, MA) inserted into the joint after opening the lateral retinacular structures [19]. Each sensor was sandwiched between two sheets of neoprene rubber for calibration on a material testing machine. The position of the patellar ridge was palpated on the sensor for each experimental test. Knee kinematics were quantified using a pulsed dc magnetic tracking system (trakSTAR, Ascension Technology, Burlington, VT). Sensors were fixed to the femur, patella, and tibia. A separate sensor was used to digitize landmarks, creating anatomical reference axes that were tracked based on the motion of the sensors fixed to the bones. The most medial and lateral points on the femoral epicondyles and two points along the long axis of the femur were digitized, along with the most medial, lateral, and distal points on the patella, and the most medial and lateral points on the tibial epicondyles and a central point at the distal cut of the tibia. Tibiofemoral [20] and patellofemoral [19] translations and rotations were quantified based on the floating axis convention [22].
Each knee was MRI scanned (MAGNETOM Symphony 1.5 T, Siemens) prior to testing to provide images for reconstruction of a computational model. The scan was performed with an extremity coil (CP Extremity Coil, Siemens) in the sagittal plane using a three-dimensional T2-weighted scan with fat saturation (repetition time = 38 ms, echo time = 5 ms, flip angle = 25 deg, field of view = 16 cm, slice thickness = 1.0 mm). Triangulated surface meshes representing the femur, tibia, and patella and the cartilage on the femur and patella were reconstructed from the images. Cartilage thickness was determined by projecting normals from the articular surface to intersection points at the bone-cartilage interface. Using measurements from the tested knees and anatomical landmarks on the patella, three points along a line of attachment for each muscle group were identified on the reconstructed patella. The attachment points of the patellar tendon on the distal patella and the tibial tuberosity were designated similarly.
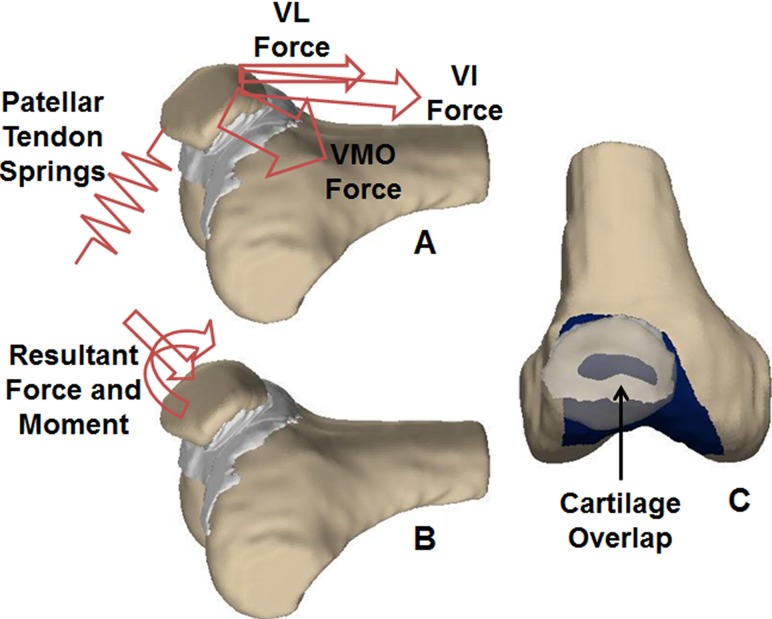
Each reconstructed knee was positioned within a graphical representation of the experimental test frame (Fig. 1). Tibiofemoral alignment was recreated for each experimental test. The anatomical landmarks used to create reference axes for each knee were identified on the computational models, allowing the orientation of the tibia with respect to the femur to be reproduced from the experimentally determined tibiofemoral translations and rotations [22]. The tibiofemoral orientation determined the position of the tibial tuberosity. Prior to application of the quadriceps forces, the patella was aligned with a mating surface within the trochlear groove [14]. The patella was flexed based on the experimentally determined flexion, and translated along the trochlear groove until a tangent to the point of contact on the patellar ridge was aligned with a parallel surface in the groove [14]. The point of contact was halfway along the length of the articular surface at 60 deg. At 40 deg and 80 deg, the point of contact was shifted by one-eighth of the length of the articular surface distally and proximally, respectively, to incorporate proximal translation of the contact area on the patella with knee flexion [14]. The patella was further translated in the medial-lateral direction and tilted for alignment to the trochlear groove. The origin of each quadriceps loading cable was replicated in the computational coordinate system to apply forces from the attachment points to the origin, and wrapping points for each muscle were computationally identified on the surface of the distal femur [14].
Fig. 1.
(A) Initially, the forces representing the vastus lateralis (VL), the combination of the vastus intermedius/vastus medialis longus/rectus femoris (VI), and vastus medialis obliquus (VMO) are applied to the patella. The reaction forces in the springs representing the patellar tendon are calculated. (B) The resultant force and moment from the quadriceps and patellar tendon are applied to the patella. (C) The patella (transparent) translates and rotates in response to the applied force and moment producing overlap between the cartilage on the patella and femur (dark). The reaction force and moment acting on the patella from the cartilage is quantified from the overlap of the cartilage surfaces.
The bones were considered to be rigid, while the cartilage and the patellar tendon were represented with compressive and tensile springs, respectively. The cartilage on the patella and along the trochlear groove was represented by a layer of approximately 10,000 springs on each surface, with an elastic modulus of 4 MPa and a Poisson's ratio of 0.45 [15,23]. The patellar tendon was represented by five springs with a total stiffness of 2000 N/mm [5,14], with the distal attachment at the tibial tuberosity fixed in space. Linear elastic theory for a homogeneous and isotropic material was used to relate the deformation of a spring representing cartilage to the applied force according to the equation,
| (1) |
where E is the elastic modulus, A is the area covered by the spring, ν is the Poisson's ratio, h is the combined thickness of the cartilage on the femur and patella, and d is the compression of the spring.
The response to quadriceps loading was determined in a two-step process, with the first step quantifying the force within the patellar tendon and the second step quantifying the force within each spring representing cartilage (Fig. 1(A)). A previous version of DEA was run to determine the forces in the springs representing the patellar tendon [14,15]. The method produces equilibrium while minimizing the total potential energy within the system of springs, with the assumption of minimal displacement of the rigid bodies [24]. The resultant force and moment applied by the quadriceps and the patellar tendon were then applied to the patella in the position determined by the initial alignment (Fig. 1(B)). The patella translated and rotated in the direction of the applied forces and moments, producing overlap between the articular surfaces of the cartilage on the femur and patella (Fig. 1(C)). Within the area of overlap, the force vector for each spring on the patella was in the direction of the line to the nearest point on the femoral cartilage, with the length of the line determining the deformation [25,26]. The cross product of the vector from the center of the patella to the spring and the force vector determined the moment each spring applied to the patella. The reaction force and moment applied by the cartilage were compared to the force and moment applied by the quadriceps and patellar tendon. Patellar flexion/extension, medial/lateral tilt, medial/lateral translation, and anterior/posterior translation were iteratively adjusted until the corresponding forces and moments were balanced. The rotation moment about an anterior axis and superior force were assumed to be primarily balanced by shear forces in the area of contact, which are not included in the analysis. The pressure distribution was determined by dividing the force within each spring by the area covered by the spring. Unlike the previous version of DEA, the second step of the analysis incorporated the shape of the cartilage surfaces into the pressure distribution. The analysis also allowed characterization of the final translational and rotational alignment of the patella with respect to the femur based on the digitized landmarks using the floating axis convention [19].
Multiple output parameters were used to characterize the patellofemoral pressure distribution and compare the results to the experimental measurements. The position of the patellar ridge was identified on the model to separate the medial and lateral facets of the patella. The maximum pressure applied to each facet was quantified, along with the total area of contact. The ratio of the contact force applied to the lateral facet to the combined contact force for both facets was also quantified. The lateral distance from the center of force on the patella to the patellar ridge was quantified, with the center of force determined by summing the product of the force and the position for each spring of the model or sensing element of the pressure sensor and dividing by the total force. A two level repeated measures ANOVA was performed at each flexion angle to compare the computational to experimental data and determine if the output varied between the two loading conditions. When the influence of the loading condition was significant (p < 0.05), follow-up paired t-tests focused on the loading condition were individually performed for the experimental and computational data. Variations in patellar flexion, lateral tilt and lateral shift between the loading conditions were also quantified for the computational and experimental data, with paired t-tests performed to determine if the changes were significant at each flexion angle.
Results
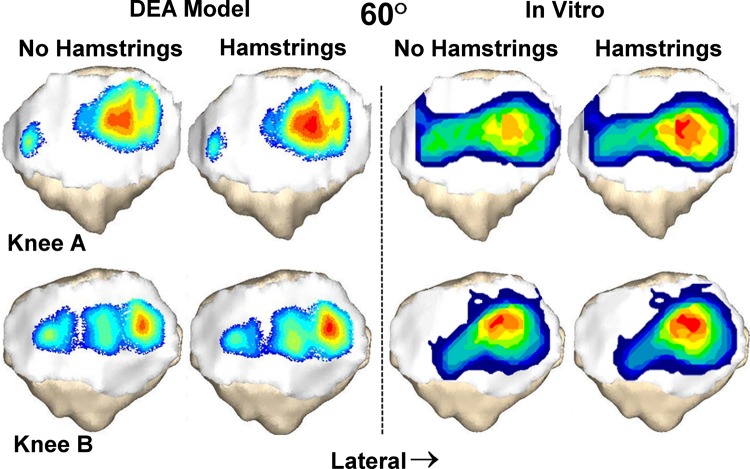
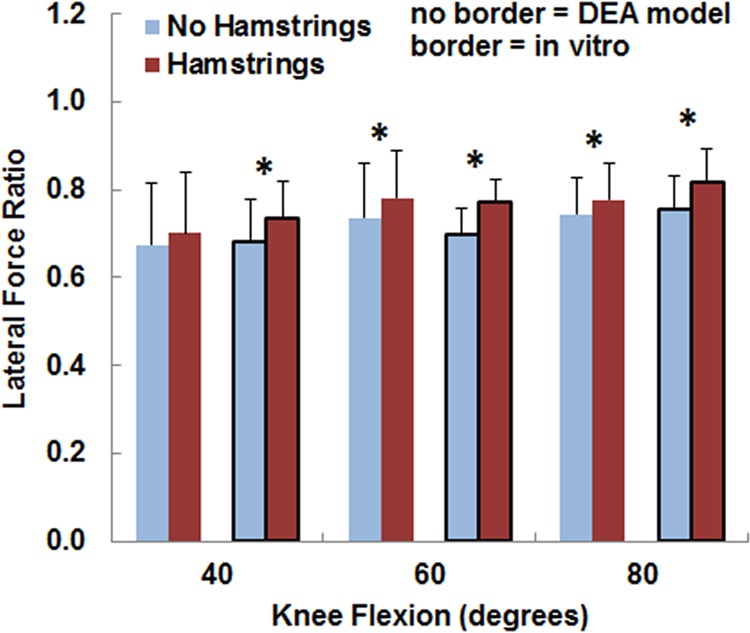
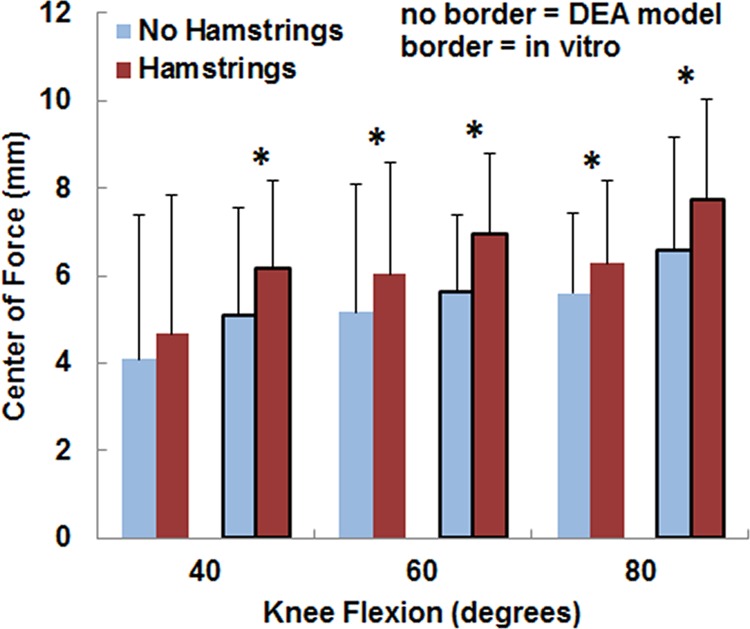
For both the computational and experimental data, pressure tended to be concentrated on the lateral facet of the patella, with the lateral concentration larger for the loading condition including the hamstrings (Fig. 2). The average lateral force ratio varied from 0.67 to 0.82 over all flexion angles and loading conditions (Fig. 3). The lateral force ratio was significantly (p < 0.01) larger with the hamstrings loaded than unloaded for all conditions except for the computational data at 40 deg. For the computational data, loading the hamstrings increased the average lateral force ratio by 0.03–0.04 at the individual flexion angles, compared to 0.05–0.07 for the experimental data. The computational lateral force ratio was not significantly different from the experimental data at any flexion angle (Table 1). The lateral distance from the patellar ridge to the center of force was significantly larger (p < 0.004) with the hamstrings loaded than unloaded for all conditions except for the computational data at 40 deg (Fig. 4). For the computational data, loading the hamstrings increased the average lateral position of the center of force by 0.6–0.9 mm at the individual flexion angles, compared to 1.1–1.3 mm for the experimental data. The computational center of force was not significantly different from the experimental data at any flexion angle (Table 1).
Fig. 2.
Contact pressure patterns from the DEA model and the in vitro experimental measurements superimposed over the patella for two knees at 60 deg of flexion. Pressure shifts laterally when loading the hamstrings increases the lateral and posterior orientation of the patellar tendon.
Fig. 3.
The average (±standard deviation) lateral force ratio from the DEA models (no border) and the in vitro experimental data (border). Significant increases at a flexion angle due to increasing the lateral and posterior orientation of the patellar tendon by loading the hamstrings are marked with an asterisk (*).
Table 1.
p-values for comparisons between computational and experimental data
| 40 deg | 60 deg | 80 deg | |
|---|---|---|---|
| Lateral force ratio | 0.8 | 0.6 | 0.5 |
| Center of force | 0.5 | 0.4 | 0.2 |
| Maximum lateral pressure | 0.002 | 0.01 | 0.2 |
| Maximum medial pressure | 0.002 | 0.053 | 0.1 |
| Contact area | 0.001 | 0.001 | 0.007 |
Fig. 4.
The average (±standard deviation) lateral distance from the center of force to the patellar ridge from the DEA models (no border) and the in vitro experimental data (border). Significant increases at a flexion angle due to increasing the lateral and posterior orientation of the patellar tendon by loading the hamstrings are marked with an asterisk (*).
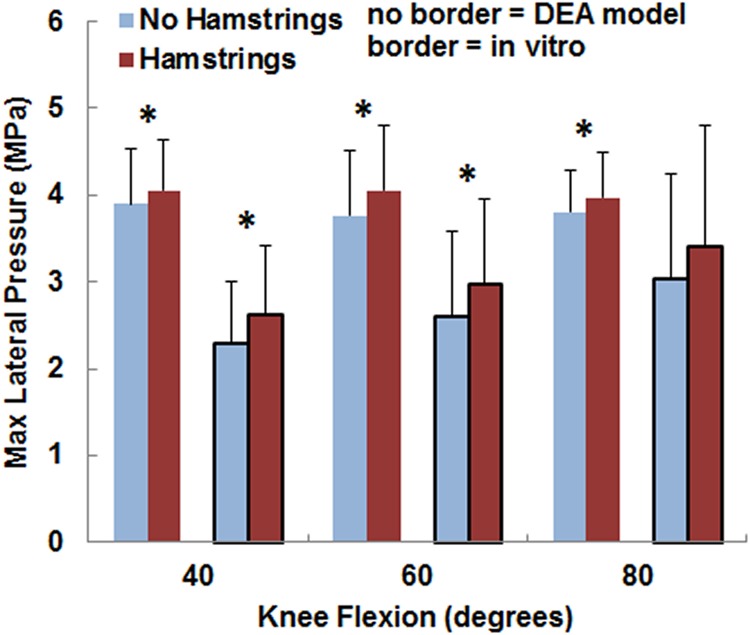
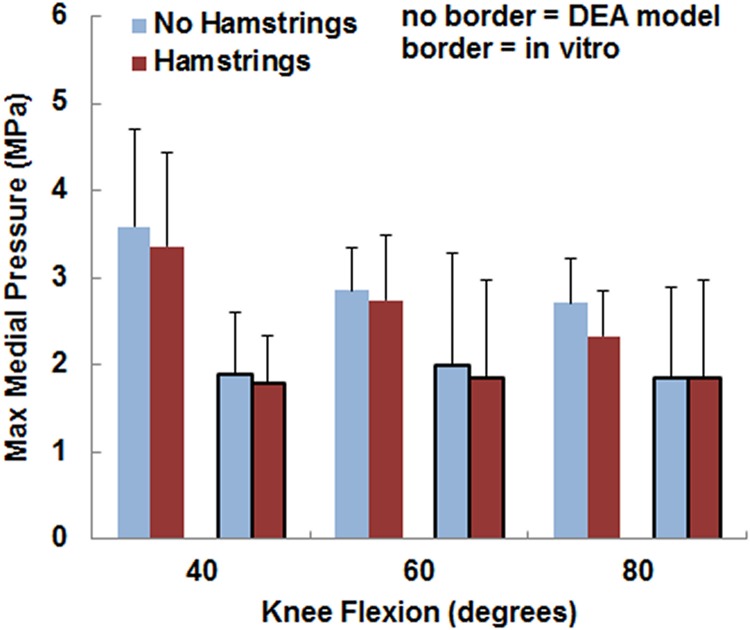
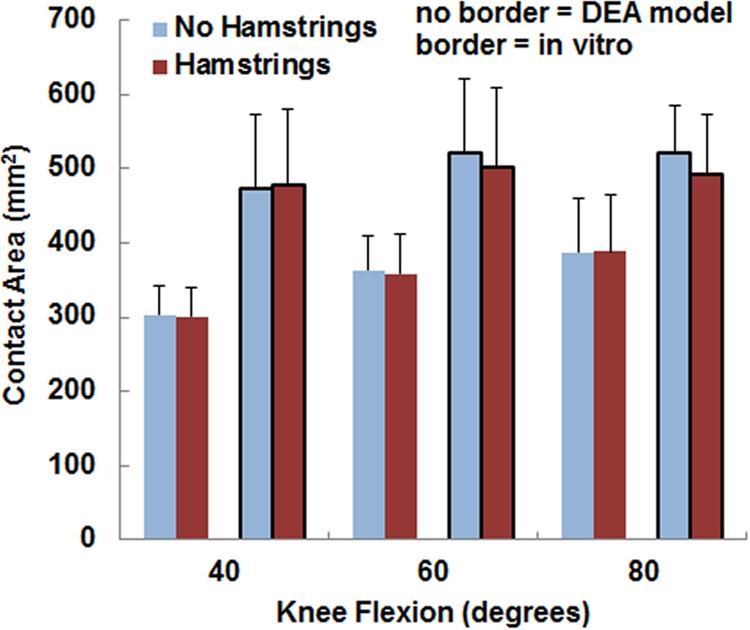
The variations in the pressure values with the loading condition were similar for the computational and experimental data, although the pressure magnitudes tended to be larger and the contact area smaller for the computational data. The maximum lateral pressure was significantly (p < 0.05) larger with the hamstrings loaded than unloaded for all conditions except for the experimental data at 80 deg (Fig. 5). For the computational data, loading the hamstrings increased the average maximum lateral pressure by 0.2–0.3 MPa at the individual flexion angles, compared to 0.3–0.5 MPa for the experimental data. The computational maximum lateral pressure was significantly larger than the experimental data at 40 deg and 60 deg (Table 1). The maximum medial pressure (Fig. 6) tended to be smaller with the hamstrings loaded for both the computational and experimental data, but no significant differences were identified (p > 0.2) at any flexion angle. The computational maximum medial pressure was significantly larger than the experimental data at 40 deg (Table 1). Hamstrings loading did not have a significant influence on contact area (Fig. 7) for the computational or experimental data (p > 0.17), but the computational contact area was significantly smaller than the experimental contact area at all flexion angles (Table 1).
Fig. 5.
The average (±standard deviation) maximum lateral pressure from the DEA models (no border) and the in vitro experimental data (border). Significant increases at a flexion angle due to increasing the lateral and posterior orientation of the patellar tendon by loading the hamstrings are marked with an asterisk (*).
Fig. 6.
The average (±standard deviation) maximum medial pressure from the DEA models (no border) and the in vitro experimental data (border). No significant differences were identified due to loading the hamstrings.
Fig. 7.
The average (±standard deviation) contact area from the DEA models (no border) and the in vitro experimental data (border). No significant differences were identified due to loading the hamstrings.
For the computational and experimental data, patellar flexion, lateral shift, and lateral tilt tended to be larger for the loading condition including the hamstrings. Loading the hamstrings increased the average patellar flexion by 1.0 deg–2.6 deg for the two methods, with the change significant (p < 0.01) for every comparison (Table 2). Loading the hamstrings increased the average the lateral tilt by 0.1 deg–0.5 deg for the two methods. The changes were significant for the computational data (p < 0.01) but not for the experimental data (p = 0.05 at 40 deg, p > 0.1 at 60 deg, 80 deg). Loading the hamstrings increased the average lateral shift by 0.2 deg–0.5 deg for the two methods, with the change significant at 60 deg and 80 deg for both the computational and experimental data (p < 0.04).
Table 2.
Kinematics variations (±standard deviations) due to hamstrings loading
|
40 deg |
60 deg |
80 deg |
||||
|---|---|---|---|---|---|---|
| Comp. | Expt. | Comp. | Expt. | Comp. | Expt. | |
| Flexion (deg) | 2.3 ± 1.1 | 1.0 ± 0.8 | 2.6 ± 0.8 | 1.5 ± 0.5 | 1.4 ± 0.9 | 1.4 ± 0.3 |
| Lateral tilt (deg) | 0.5 ± 0.3 | 0.4 ± 0.5 | 0.5 ± 0.4 | 0.4 ± 0.7 | 0.3 ± 0.2 | 0.1 ± 0.2 |
| Lateral shift (mm) | 0.5 ± 0.6 | 0.5 ± 1.2 | 0.5 ± 0.3 | 0.2 ± 0.2 | 0.2 ± 0.1 | 0.2 ± 0.2 |
Note: Comp. = computational data; Expt. = experimental data. Bold values indicate significant (p < 0.05) difference due to hamstrings loading.
Discussion
The strength of the computational model is the ability to evaluate variations in the distribution of pressure and pressure magnitude due to altered loading conditions. The trends in the lateral force ratio, the position of the center of force, and the maximum lateral pressure measured in vitro were largely reproduced with the computational models. Previous studies have shown that DEA models can accurately characterize variations in the distribution of patellofemoral force and pressure due to variations in quadriceps loading [14,15]. The orientation of the patellar tendon is a primary component of clinical evaluation of patellofemoral disorders [1], since the pressure applied to cartilage increases with the lateral orientation [17,18]. Medialization of the patellar tendon attachment at the tibial tuberosity is also a common approach for surgical patellar realignment. The current implementation of DEA uses a two-step process to address variations in the orientation of the patellar tendon, with the initial step determining the force within the patellar tendon that is used as input for the second step. Validation studies have been performed for other models used to characterize the patellofemoral pressure distribution, but these studies used experimental measures of patellofemoral kinematics and contact area or comparison to other computational models for validation [5,7,23,27–30] instead of the experimental pressure measurements used for the current model. The experimental trends for patellofemoral kinematics were also largely reproduced computationally, indicating that the DEA model can evaluate variations in patellofemoral kinematics due to altered loading conditions.
The current study focused on the relationship between hamstrings loading and the patellofemoral pressure distribution due to the direct influence on the orientation of the patellar tendon. For the in vitro study, experimental errors in the tibiofemoral and patellofemoral kinematics and the patellofemoral pressure distribution were minimized by adding hamstrings loading to knees already loaded through the quadriceps, with no other changes made to the experimental setup [19]. Hamstrings loads primarily increased the external rotation and posterior translation of the tibia, moving the patellar tendon attachment on the tibia laterally and posteriorly. In the computational model, the only change applied between the two loading conditions was the altered orientation of the patellar tendon.
The computationally determined maximum pressure tended to be larger than the experimental measurements, primarily at low flexion angles. The elevated maximum pressure is likely related to the lower computational contact area, particularly at low flexion angles when the distal patella engages the proximal trochlear groove [21]. Underrepresentation of the contact area leads to additional compression to balance the forces and moments applied to the patella. The elastic modulus of cartilage could have been decreased to increase the contact area and decrease the maximum pressure. Although the modulus of 4 MPa was at the low end of the range from 4 to 12 MPa commonly used to represent patellofemoral cartilage [7,9,10,29], reducing the modulus due to the cadaveric specimens obtained from elderly donors [19] may have been justified. Future studies will focus on representing knees from younger patients with patellofemoral disorders, using a modulus similar to the one used for the current study. Other computational approximations can influence the accuracy of the output, such as representation of cartilage and the patellar tendon with linear springs and estimation of muscle attachment points. Experimental error could also contribute to differences in pressure values between the computational and experimental data. Contributors to experimental error include the sensor influencing contact mechanics [31], wrapping the sensor around the patella [32], sensitivity of the sensor to shear loads [17], and representing the cartilage surrounding the sensor with neoprene rubber during calibration [32].
The current model represents further progress in the development of a computational model of the patellofemoral joint. The DEA technique allows rapid creation of a model from surfaces created from imaging data and easy manipulation of loading conditions and properties of soft tissues. The patellofemoral pressure distribution is quantified quickly, so studies can include several knees tested at multiple flexion angles. The modeling technique allows ASME, parametric variations in loading conditions and cartilage conditions that require a great deal more time and expense to evaluate in vitro, and models can be developed from patients to represent the patellofemoral pathology that contributes to overloading lateral cartilage. Based on the current results, DEA can characterize how varying the orientation of the patellar tendon influences specific parameters related to the patellofemoral force and pressure distributions.
Acknowledgment
The study was supported by Award No. R03AR054910 from the National Institute of Arthritis and Musculoskeletal and Skin Diseases of the National Institutes of Health. Assistance provided by the Department of Radiology at Akron General Medical Center is greatly appreciated.
Contributor Information
John J. Elias, e-mail: john.elias@akrongeneral.org
Archana Saranathan, e-mail: archana.saranathan@akrongeneral.org, Calhoun Research Laboratory, Akron General Medical Center, 400 Wabash Avenue, Akron, OH 44307.
References
- [1]. Balcarek, P. , Jung, K. , Frosch, K. H. , and Stürmer, K. M. , 2011, “Value of the Tibial Tuberosity-Trochlear Troove Distance in Patellar Instability in the Young Athlete,” Am. J. Sports Med., 39(8), pp. 1756–1761. 10.1177/0363546511404883 [DOI] [PubMed] [Google Scholar]
- [2]. Makhsous, M. , Lin, F. , Koh, J. , Nuber, G. , and Zhang, L. , 2004, “In Vivo and Noninvasive Load Sharing Among the Vasti in Patellar Malalignment,” Med. Sci. Sports Exer., 36(10), pp. 1768–1775. 10.1249/01.MSS.0000142302.54730.7F [DOI] [PubMed] [Google Scholar]
- [3]. Fulkerson, J. P. , 2004, “Patellar Tilt Compression and the Excessive Lateral Pressure Syndrome,” Disorders of the Patellofemoral Joint, Fulkerson J. P., ed., Lippincott, Williams and Wilkins, Phil, PA., pp. 160–184. [Google Scholar]
- [4]. Fulkerson, J. P. , 2002, “Diagnosis and Treatment of Patients With Patellofemoral Pain,” Am. J. Sports Med., 30(3), pp. 447–456. [DOI] [PubMed] [Google Scholar]
- [5]. Besier, T. F. , Gold, G. E. , Delp, S. L. , Fredericson, M. , and Beaupré, G. S. , 2008, “The Influence of Femoral Internal and External Rotation on Cartilage Stresses Within the Patellofemoral Joint,” J. Orthop. Res., 26(12), pp. 1627–1635. 10.1002/jor.20663 [DOI] [PubMed] [Google Scholar]
- [6]. Benvenuti, J. F. , Rakotomanana, L. , Leyvraz, P. F. , Pioletti, D. P. , Heegaard, J. H. , and Genton, M. G. , 1997, “Displacements of the Tibial Tuberosity. Effects of the Surgical Parameters,” Clin. Orthop. Relat. Res., 343, pp. 224–234. 10.1097/00003086-199710000-00033 [DOI] [PubMed] [Google Scholar]
- [7]. Farrokhi, S. , Keyak, J. H. , and Powers, C. M. , 2011, “Individuals With Patellofemoral Pain Exhibit Greater Patellofemoral Joint Stress: A Finite Element Analysis Study,” Osteoarthritis Cartilage, 19(3), pp. 287–294. 10.1016/j.joca.2010.12.001 [DOI] [PMC free article] [PubMed] [Google Scholar]
- [8]. Fitzpatrick, C. K. , Baldwin, M. A. , Laz, P. J. , Fitzpatrick, D. P. , Lerner, A. L. , and Rullkoetter, P. J. , 2011, “Development of a Statistical Shape Model of the Patellofemoral Joint for Investigating Relationships Between Shape and Function,” J. Biomech., 44(13), pp. 2446–2452. 10.1016/j.jbiomech.2011.06.025 [DOI] [PubMed] [Google Scholar]
- [9]. Shirazi-Adl, A. , and Mesfar, W. , 2007, “Effect of Tibial Tubercle Elevation on Biomechanics of the Entire Knee Joint Under Muscle Loads,” Clin. Biomech., 22(3), pp. 344–351. 10.1016/j.clinbiomech.2006.11.003 [DOI] [PubMed] [Google Scholar]
- [10]. Cohen, Z. A. , Henry, J. H. , McCarthy, D. M. , Mow, V . C. , and Ateshian, G. A. , 2003, “Computer Simulations of Patellofemoral Joint Surgery: Patient-Specific Models for Tuberosity Transfer,” Am. J. Sports Med., 31(1), pp. 87–98. [DOI] [PubMed] [Google Scholar]
- [11]. Cohen, Z. A. , Roglic, H. , Grelsamer, R. P. , Henry, J. H. , Levine, W. N. , Mow, V . C. , and Ateshian, G. A. , 2001, “Patellofemoral Stresses During Open and Closed Kinetic Chain Exercises. An Analysis Using Computer Simulation,” Am. J. Sports Med., 29(4), pp. 480–487. [DOI] [PubMed] [Google Scholar]
- [12]. Elias, J. J. , Cech, J. A. , Weinstein, D. M. , and Cosgarea, A. J. , 2004, “Reducing the Lateral Force Acting on the Patella Does Not Consistently Decrease Patellofemoral Pressures,” Am. J. Sports Med., 32(5), pp. 1202–1208. 10.1177/0363546503262167 [DOI] [PubMed] [Google Scholar]
- [13]. Elias, J. J. , and Cosgarea, A. J. , 2006, “Technical Errors During Medial Patellofemoral Ligament Reconstruction Could Overload Medial Patellofemoral Cartilage: A Computational Analysis,” Am. J. Sports Med., 34(9), pp. 1478–1485. 10.1177/0363546506287486 [DOI] [PubMed] [Google Scholar]
- [14]. Elias, J. J. , Kilambi, S. , and Cosgarea, A. J. , 2010, “Computational Assessment of the Influence of Vastus Medialis Obliquus Function on Patellofemoral Pressures: Model Evaluation,” J. Biomech., 43(4), pp. 612–617. 10.1016/j.jbiomech.2009.10.039 [DOI] [PMC free article] [PubMed] [Google Scholar]
- [15]. Elias, J. J. , Wilson, D. R. , Adamson, R. , and Cosgarea, A. J. , 2004, “Evaluation of a Computational Model used to Predict the Patellofemoral Contact Pressure Distribution,” J. Biomech., 37(3), pp. 295–302. 10.1016/S0021-9290(03)00306-3 [DOI] [PubMed] [Google Scholar]
- [16]. Beck, P. R. , Thomas, A. L. , Farr, J. , Lewis, P. B. , and Cole, B. J. , 2005, “Trochlear Contact Pressures After Anteromedialization of the Tibial Tubercle,” Am. J. Sports Med., 33(11), pp. 1710–1715. 10.1177/0363546505278300 [DOI] [PubMed] [Google Scholar]
- [17]. Ramappa, A. J. , Apreleva, M. , Harrold, F. R. , Fitzgibbons, P. G. , Wilson, D. R. , and Gill, T. J. , 2006, “The Effects of Medialization and Anteromedialization of the Tibial Tubercle on Patellofemoral Mechanics and Kinematics,” Am. J. Sports Med., 34(5), pp. 749–756. 10.1177/0363546505283460 [DOI] [PubMed] [Google Scholar]
- [18]. Saranathan, A. , Kirkpatrick, M. S. , Mani, S. , Smith, L. G. , Cosgarea, A. J. , Tan, J. S. , and Elias, J. J. , 2012, “The Effect of Tibial Tuberosity Realignment Procedures on the Patellofemoral Pressure Distribution,” Knee Surg. Sports Traumatol. Arthrosc., 20(10), pp. 2054–2061. 10.1007/s00167-011-1802-8 [DOI] [PMC free article] [PubMed] [Google Scholar]
- [19]. Elias, J. J. , Kirkpatrick, M. S. , Saranathan, A. , Mani, S. , Smith, L. G. , and Tanaka, M. J. , 2011, “Hamstrings Loading Contributes to Lateral Patellofemoral Malalignment and Elevated Cartilage Pressures: An In Vitro Study,” Clin. Biomech., 26(8), pp. 841–846. 10.1016/j.clinbiomech.2011.03.016 [DOI] [PMC free article] [PubMed] [Google Scholar]
- [20]. Mani, S. , Kirkpatrick, M. S. , Saranathan, A. , Smith, L. G. , Cosgarea, A. J. , and Elias, J. J. , 2011, “Tibial Tuberosity Osteotomy for Patellofemoral Realignment Alters Tibiofemoral Kinematics,” Am. J. Sports Med., 39(5), pp. 1024–1031. 10.1177/0363546510390188 [DOI] [PMC free article] [PubMed] [Google Scholar]
- [21]. Elias, J. J. , Kilambi, S. , Goerke, D. R. , and Cosgarea, A. J. , 2009, “Improving Vastus Medialis Obliquus Function Reduces Pressure Applied to Lateral Patellofemoral Cartilage,” J. Orthop. Res., 27(5), pp. 578–583. 10.1002/jor.20791 [DOI] [PMC free article] [PubMed] [Google Scholar]
- [22]. Grood, E. S. , and Suntay, W. J. , 1983, “A Joint Coordinate System for the Clinical Description of Three-Dimensional Motions: Application to the Knee,” ASME, J. Biomech. Eng., 105(2), pp. 136–144. 10.1115/1.3138397 [DOI] [PubMed] [Google Scholar]
- [23]. Kwak, S. D. , Blankevoort, L. , and Ateshian, G. A. , 2000, “A Mathematical Formulation for 3D Quasi-Static Multibody Models of Diarthrodial Joints,” Comput. Methods Biomech. Biomed. Eng., 3(1), pp. 41–64. 10.1080/10255840008915253 [DOI] [PubMed] [Google Scholar]
- [24]. Genda, E. , Iwasaki, N. , Li, G. , MacWilliams, B. A. , Barrance, P. J. , and Chao, E. Y. , 2001, “Normal Hip Joint Contact Pressure Distribution in Single-Leg Standing–Effect of Gender and Anatomic Parameters,” J. Biomech., 34(7), pp. 895–905. 10.1016/S0021-9290(01)00041-0 [DOI] [PubMed] [Google Scholar]
- [25]. Hosseini, A. , Van de Velde, S. K. , Kozanek, M. , Gill, T. J. , Grodzinsky, A. J. , Rubash, H. E. , and Li, G. , 2010, “In-Vivo Time-Dependent Articular Cartilage Contact Behavior of the Tibiofemoral Joint,” Osteoarthritis Cartilage, 18(7), pp. 909–916. 10.1016/j.joca.2010.04.011 [DOI] [PMC free article] [PubMed] [Google Scholar]
- [26]. Van de Velde, S. K. , Bingham, J. T. , Gill, T. J. , and Li, G. , 2009, “Analysis of Tibiofemoral Cartilage Deformation in the Posterior Cruciate Ligament-Deficient Knee,” J. Bone Joint Surg. Am., 91(1), pp. 167–175. 10.2106/JBJS.H.00177 [DOI] [PMC free article] [PubMed] [Google Scholar]
- [27]. Besier, T. F. , Gold, G. E. , Beaupré, G. S. , and Delp, S. L. , 2005, “A Modeling Framework to Estimate Patellofemoral Joint Cartilage Stress In Vivo,” Med. Sci. Sports Exer., 37(11) pp. 1924–1930. [DOI] [PubMed] [Google Scholar]
- [28]. Baldwin, M. A. , Clary, C. , Maletsky, L. P. , and Rullkoetter, P. J. , 2009, “Verification of Predicted Specimen-Specific Natural and Implanted Patellofemoral Kinematics during Simulated Deep Knee Bend,” J. Biomech., 42(14), pp. 2341–2348. 10.1016/j.jbiomech.2009.06.028 [DOI] [PubMed] [Google Scholar]
- [29]. Fitzpatrick, C. K. , Baldwin, M. A. , and Rullkoetter, P. J. , 2010, “Computationally Efficient Finite Element Evaluation of Natural Patellofemoral Mechanics,” ASME, J. Biomech. Eng., 132(12), pp. 1210–1213. 10.1115/1.4002854 [DOI] [PubMed] [Google Scholar]
- [30]. Heegaard, J. , Leyvraz, P. F. , Curnier, A. , Rakotomanana, L. , and Huiskes, R. , 1995, “The Biomechanics of the Human Patella During Passive Knee Flexion,” J. Biomech., 28(11), pp. 1265–1279. 10.1016/0021-9290(95)00059-Q [DOI] [PubMed] [Google Scholar]
- [31]. Wu, J. Z. , Herzog, W. , and Epstein, M. , 1998, “Effects of Inserting a Pressensor Film into Articular Joints on the Actual Contact Mechanics,” ASME, J. Biomech. Eng., 120(5), pp. 655–659. 10.1115/1.2834758 [DOI] [PubMed] [Google Scholar]
- [32]. Wilson, D. R. , Apreleva, M. V. , Eichler, M. J. , and Harrold, F. R. , 2003, “Accuracy and Repeatability of a Pressure Measurement System in the Patellofemoral Joint,” J. Biomech., 36(12), pp. 1909–1915. 10.1016/S0021-9290(03)00105-2 [DOI] [PubMed] [Google Scholar]


