Abstract
Purpose
To assess the agreement between color fundus photographs (CFP) and fundus autofluorescence (FAF) images when measuring geographic atrophy (GA) area and reproducibility of measurements between graders. Frequency and disagreement types were also determined.
Methods
Eyes with GA secondary to age-related macular degeneration had CFP and FAF imaging on the same day. Seventy-two eyes from 72 patients were included in the analysis. Three graders calculated GA area using digital imaging software. Main outcome measures included agreement between graders for GA area on both FAF and CFP and agreement between both imaging modalities.
Results
The intraclass correlation for the 3 graders for FAF images was 0.99 (95% confidence interval, 0.98–0.99). For CFP, it was 0.96 (95% confidence interval, 0.94–0.97). The intraclass correlation between imaging modalities for Graders 1, 2, and 3 were 0.93, 0.85, and 0.87, respectively. Sensitivities to detect involvement of fovea (CFP, 86–97%; FAF, 72–93%) and specificities to detect sparing of fovea (CFP, 74–76%; FAF, 59–88%) overlapped between imaging modalities.
Conclusion
Both CFP and FAF imaging are reliable for measuring GA area. Interobserver agreement was slightly higher for FAF images. Although the high agreement between modalities suggests that either would be appropriate for measuring GA area, using both may be the best approach for following GA progression.
Keywords: age-related macular degeneration, color fundus photographs, fundus autofluorescence, geographic atrophy
Interest in fundus autofluorescence (FAF) imaging in the setting of geographic atrophy (GA) secondary to nonneovascular age-related macular degeneration (AMD) has recently increased. Attempts have been made to describe FAF phenotypes1–3 and to correlate these phenotypes with prognosis for disease progression.3–6 Several studies have also investigated the natural progression of GA and have primarily used either color fundus photographs (CFP)7–10 or FAF images.5,6,11,12
The Age-Related Eye Disease Study Research Group9,10 and the natural history studies of GA performed by Sunness et al7,8 used different techniques of measuring GA with color fundus photos. Both these groups used film instead of digital images and required special procedures to calculate GA area. Although these techniques were shown to be relatively reliable, they were arguably labor intensive and involved using either standardized grids over photographic slides9 or projections of film onto paper, repeated manual tracings, and corrections for multiple magnifications.7,8 More recently, the Age-Related Eye Disease Study Research Group reported growth rates of GA using digitized standard CFP.10 Furthermore, these methods required adjustments based on the Macular Photocoagulation Study standard disk size (1 disk area [DA] defined as 2.54 mm2)7 or other standard disk sizes (e.g., 2.66 mm2),10 and the resulting measurements were approximations. Other researchers have recently described the use of digital FAF images for measuring GA and predicting progression.5,6,11,12
The recent emergence of clinical trials to evaluate new therapies for nonneovascular AMD has increased the need for reliable, accurate, and simple means of monitoring GA size and progression. Whether CFP or FAF is superior for measuring GA area is not known. In this study, we compared digital CFP and FAF in the setting of GA secondary to nonneovascular AMD. We sought to determine whether CFP or FAF has less grader variability in the measurement of total GA area at a given time point.
Methods
This study was approved by the Duke University Medical Center Institutional Review Board, was Health Insurance Portability and Accountability Act (HIPPA) compliant, and adhered to the tenets of the Declaration of Helsinki and all federal and state laws.
Data Source
The Duke Eye Center HRA2 (Heidelberg Retina Angiograph 2; Heidelberg Engineering, Heidelberg, Germany) database entries between January 1, 2005, and December 14, 2006, were reviewed. Medical records were reviewed, and patients with GA in at least one eye secondary to AMD and without history of choroidal neovascularization or other macular disease were included. Patients with myopia >6 diopters (spherical equivalent) were excluded. All patients included in the analysis had CFP and FAF acquired on the same day. Ninety-four patients (144 eyes) meeting this criteria were identified. Eyes with macular GA extending outside the arcades on either CFP or FAF (6 patients, 10 eyes) were excluded. Before measuring GA area, image quality was assessed by one of the authors (S.B.) and was determined based on the visibility of vascular detail and documented as poor, fair, or good for the remaining 134 eyes. Eyes with poor CFP (5 eyes) or poor FAF (22 eyes) and eyes with poor CFP and poor FAF (7 eyes) were then excluded as nongradable, leaving 100 eyes of 72 patients. Finally, if both eyes met the inclusion criteria, the left eye was arbitrarily chosen for grading (72 eyes, 72 patients). Demographic data such as age, gender, smoking status (past/current vs. none) and use of antioxidant supplementation were recorded. Data were entered as missing if not noted in the chart.
Image Acquisition
All CFP images of the macula were acquired with a Zeiss 450 (Carl Zeiss Meditec, Dublin, CA) camera and saved in digital format with the Visupac (Carl Zeiss Meditec) system using standard, nonstereophotographic, technique. The HRA2 was used to acquire the FAF imaging. With the HRA2, excitation occurs at 488 nm with an optically pumped solid-state laser, and emission is detected above 500 nm with a barrier filter. Multiple 30° × 30° FAF images that encompassed the macular area were obtained, registered, and averaged to generate a single nonstereophotographic FAF image with amplified signal and reduced noise.
Grading Technique
Three graders (S.B., D.E.L., A.A.K.) calculated total GA area on the digital images using the Zeiss and Heidelberg imaging analysis software systems. Each grader used the computer mouse to manually trace all areas of GA. With CFP, GA was recognized as sharply demarcated areas of partial or complete depigmentation of retinal pigment epithelium typically associated with improved visualization of the choroidal vasculature.9 Areas corresponding to drusen were not included. On FAF, GA was recognized as well-demarcated black areas corresponding to devitalized or absent retinal pigment epithelium. Peripapillary atrophy within the arcades was included in tracing only if it was confluent with macular GA. Areas of intact autofluorescence within GA were also traced but with a different color to signify sparing of retinal tissue. The Heidelberg and Visupac imaging analysis software systems were used to calculate the area of each encircled region. This technique automates conversion of pixels to square millimeter based on the magnification factors of the respective imaging devices. Total GA for each image was calculated by summing all the areas of GA and subtracting demarcated areas of retinal sparing. Areas of atrophy measured to be <0.02 mm2 (which would correspond to a circle with a diameter of 160 µm) were excluded from the analysis. Graders were masked to each other and all clinical information for each eye. No other imaging modalities (eg, fluorescein angiography, infrared) were available for viewing when grading was performed. Also, when grading a CFP image, graders were masked to the corresponding FAF image and vice versa.
Evaluation of Grading Disagreements
Reasons for measurement differences between graders for both CFP and FAF were determined by manually comparing all images. A minimum difference of 2 mm2 between any 1 of 3 graders was chosen to define a meaningful difference between CFP and FAF images. Types of grading differences were then categorized, and frequencies of each disagreement type were computed. Visual acuity was used to determine foveal involvement (≤20/80) or foveal sparing (≥20/40). Sensitivities of graded images to detect foveal involvement and specificities of graded images to detect foveal sparing were determined separately for CFP and FAF.
Data Analysis
All descriptive, frequency, and agreement statistics were performed using SAS (version 8.2; SAS Institute, Inc, Cary, NC). Interobserver and intraobserver agreements were determined using calculations from all 3 graders and were assessed by intraclass correlations and by concordance correlation coefficients.13 For comparisons between measurements on CFP and FAF for each grader, Bland–Altman plots were computed.
Results
Patient Characteristics
Seventy-two eyes from 72 patients met the inclusion and exclusion criteria. Average age was 80.4 years (range, 56–96 years). Other baseline demographic and descriptive data are given in Table 1.
Table 1.
Baseline Demographic and Descriptive Data
| Variable | Frequency | Percent |
|---|---|---|
| Female | 46 | 64 |
| Eye (OS) | 51 | 71 |
| Smoker (past or current) | 29/69 | 42 |
| AREDS supplementation | 48/66 | 73 |
| Pseudophakic or aphakic | 55/71 | 77 |
| Good FAF image quality | 46 | 64 |
| Fair FAF image quality | 26 | 36 |
| Good CFP image quality | 55 | 76 |
| Fair CFP image quality | 17 | 24 |
Percentages are based on 72 patients.
OS, left eye; AREDS, Age-Related Eye Disease Study.
Interobserver reliability between Graders 1, 2, and 3 was assessed in 2 different ways. First, intraclass correlation (ICC) coefficients and concordance correlation coefficients were calculated for FAF and CFP (Table 2). For both parameters, a value of 1.00 is perfect correlation, whereas a value of 0 is no correlation. The agreement for Graders 1, 2, and 3 for CFP was 0.96 (95% confidence interval [CI], 0.94–0.97; ICC). The agreement for Graders 1, 2, and 3 for FAF was 0.99 (95% CI, 0.98–0.99; ICC). Concordance correlation coefficients were similar: 0.94 for CFP and 0.98 for FAF. However, agreement was significantly higher for FAF than CFP (95% CI for the difference in concordance correlations: −0.157 to −0.006, P < 0.05).
Table 2.
Correlation Coefficients for FAF and CFP
| ICCs | ||||
| Measure | Graders | ICC | Lower Confidence Limit |
Upper Confidence Limit |
| CFP | 1, 2, 3 | 0.96 | 0.94 | 0.97 |
| FAF | 1, 2, 3 | 0.99 | 0.98 | 0.99 |
| Concordance Correlation Coefficients | ||||
| Measure | Graders | Concordance Correlation |
Lower 95% Confidence Limit |
Upper 95% Confidence Limit |
| CFP | 1, 2, 3 | 0.94 | 0.83 | 0.97 |
| FAF | 1, 2, 3 | 0.98 | 0.96 | 0.99 |
| Difference | 1, 2, 3 | −0.04 | −0.157 | −0.006 |
The 95% CIs for the coefficients and for the difference in coefficients were obtained using a bootstrap estimation procedure. Since the interval for the difference does not contain the value zero, difference between concordance correlations is significant at α = 0.05.
The second measure of interobserver reliability involved calculation of the coefficient of variation (standard deviation/mean × 100) for each imaging modality (Table 3). The differences in GA area measurements between graders were calculated for FAF and CFP; medians, means, standard deviations, and coefficient of variation are listed in Table 3. The coefficients of variation for CFP were higher than that for FAF images, which is indicative of less variation between graders for FAF.
Table 3.
Differences in Measurements of GA for FAF and CFP: Median, Mean, SD, and Coefficient of Variation for Each Pair-Wise Grader Comparison
| Median (mm2) | Mean (mm2) | SD (mm2) | Coefficient of Variation | |
|---|---|---|---|---|
| FAF comparison | ||||
| Grader 1 to 2 | 0.6 | 0.96 | 1.07 | 111.45 |
| Grader 1 to 3 | 0.34 | 0.62 | 0.73 | 117.74 |
| Grader 2 to 3 | 0.6 | 0.94 | 1.18 | 125.53 |
| CFP comparison | ||||
| Grader 1 to 2 | 0.5 | 1.31 | 2.46 | 187.79 |
| Grader 1 to 3 | 0.48 | 1.33 | 2.30 | 172.93 |
| Grader 2 to 3 | 0.46 | 1.07 | 1.41 | 131.78 |
Intraobserver reliability between the 2 imaging modalities for all 3 graders was also assessed. Intraclass correlation coefficients were calculated for each grader (Table 4). The agreement between corresponding FAF and CFP images for Graders 1, 2, and 3 were 0.93 (95% CI, 0.90–0.96; ICC), 0.85 (95% CI, 0.77–0.90; ICC), and 0.87 (95% CI, 0.80–0.92; ICC), respectively.
Table 4.
Intraclass Correlation Coefficients for Graders 1, 2, and 3
| Grader | ICCs | Lower Confidence Limit |
Upper Confidence Limit |
|---|---|---|---|
| 1 | 0.93 | 0.90 | 0.96 |
| 2 | 0.85 | 0.77 | 0.90 |
| 3 | 0.87 | 0.80 | 0.92 |
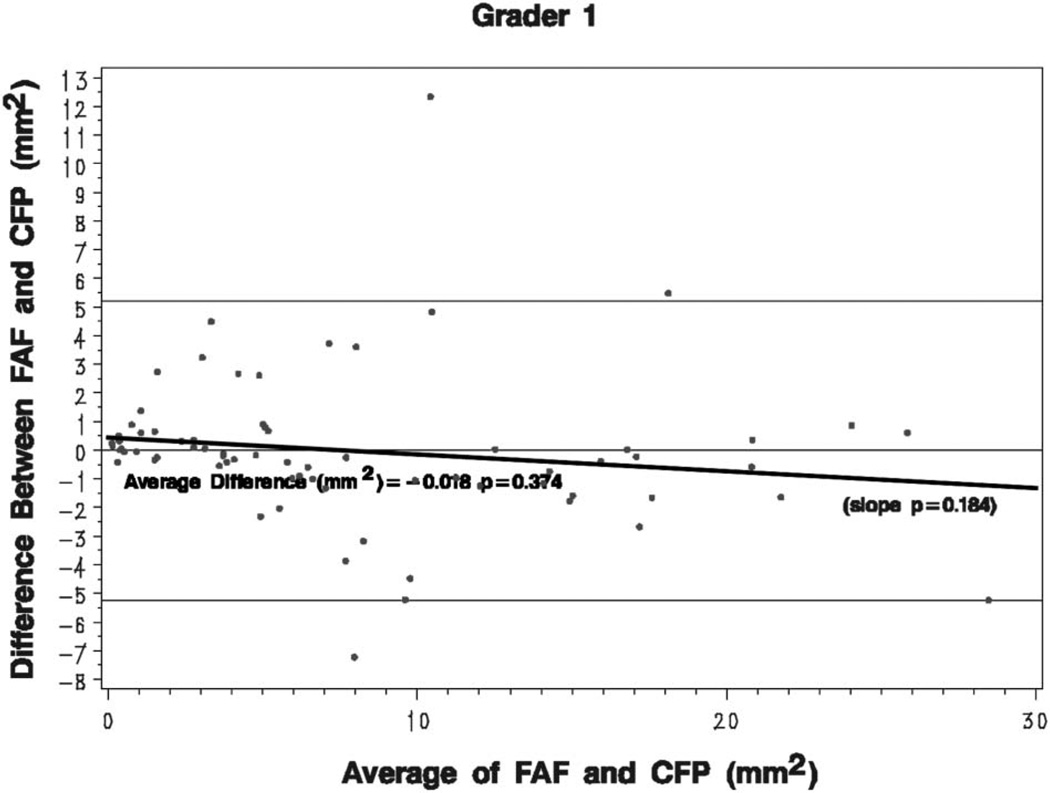
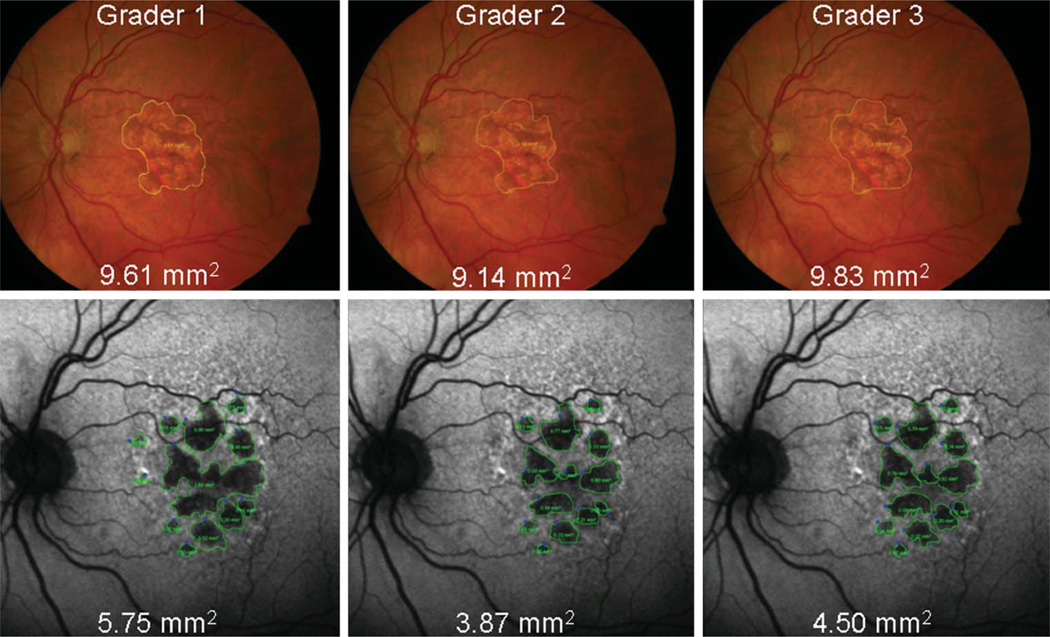
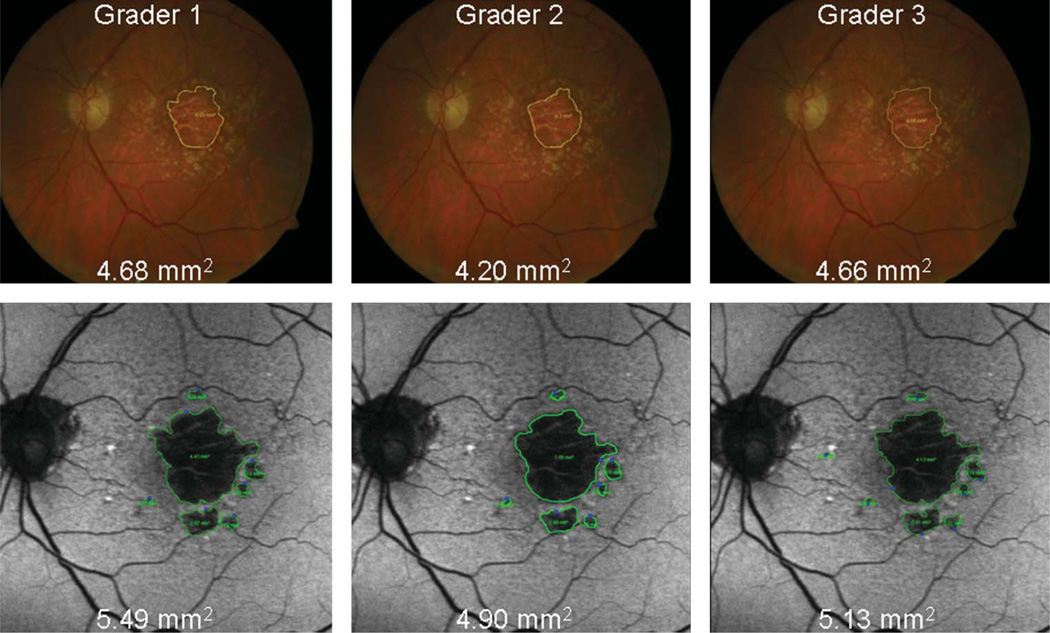
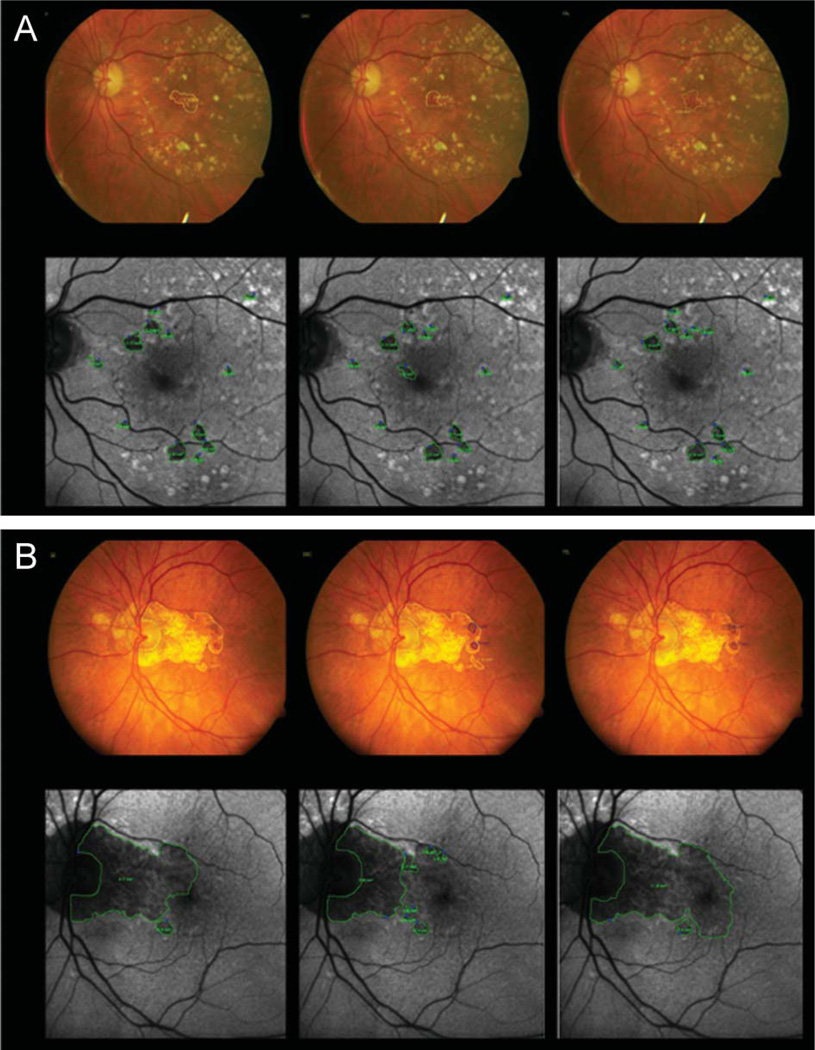
The average differences between measurements of GA area using CFP and FAF images were close to zero for each eye and for each grader, although the differences tended to increase as the size of GA increased. This is demonstrated in Figure 1, which represents Grader 1; Graders 2 and 3 had similar plots. This Bland–Altman plot compares the differences in GA area between the 2 image types (FAF − CFP) with the mean GA area [(FAF + CFP)/2]. For Grader 2, the mean difference of GA size between imaging types (FAF − CFP) reached statistical significance (−0.415 mm2, P = 0.009), whereas for Graders 1 and 3, it did not (−0.018 mm2, P = 0.374 and 0.568 mm2, P = 0.288, respectively). For larger areas of atrophy, the measured GA tended to be larger when measured with CFP than FAF for all 3 graders (e.g., Figure 2). Conversely, for smaller areas of atrophy, the measured GA tended to be larger when measured with FAF images than CFP for all 3 graders (e.g., Figure 3). However, this relationship was not statistically significant for any of the 3 graders (P = 0.184, 0.357, and 0.600 for slope of line for Graders 1, 2, and 3, respectively).
Fig. 1.
Bland–Altman plots: the difference in GA area (FAF images minus color fundus photos) for each eye is plotted against the GA area, averaged from both image types. The mean difference in GA area for each grader is also calculated. A small trend toward increased measurements on CFP with increasing GA area is seen for all 3 graders, although this is not statistically significant. The plot shown is for Grader 1 and those of Graders 2 and 3 are similar.
Fig. 2.
Example of a large mean GA area in which measurements of GA area with CFP (yellow encirclement) are larger than those made with FAF (green encirclement) images.
Fig. 3.
Example of a small mean GA area in which measurements of GA area with FAF (green encirclement) images are larger than those made with CFP (yellow encirclement).
The average number of discrete areas of GA graded on FAF (6.6) was significantly more than the average number graded on CFP (1.9, P < 0.0001, Wilcoxon signed rank test). Of note, smoking status (past/current vs. none) did not affect the number of discrete areas of GA noted on FAF (P = 0.71, analysis of variance). Smoking status also did not affect average size of GA (square millimeter) when adjusting for age, whether measured with FAF (P = 0.438) or CFP (P = 0.155, analysis of covariance).
Evaluation of Disagreement in Area Measurement Between CFP and FAF
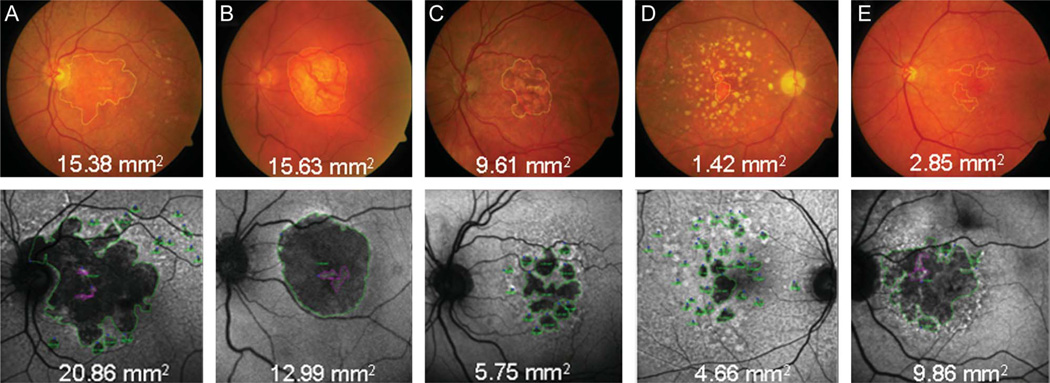
Thirty-eight of 72 eyes (53%) had at least 1 grader with 2 mm2 difference between CFP and FAF images. Five broad categories of disagreement were identified with grading. These are listed in Table 5, along with the effect of these disparities on measurements. Numbers and percentages (of 38 eyes with at least 2 mm2 difference between CFP and FAF) for each disagreement type are listed in Table 5 and demonstrated in Figure 4. Fourteen eyes had multiple disagreement types (two or more) that resulted in measurement disparities.
Table 5.
Grading Disagreement Types
| Disagreement Types | Number of Eyes (of 38 Eyes) |
Percent (of 38 Eyes) |
Result of Disagreement on CFP Relative to FAF Measurement of GA |
|---|---|---|---|
| Extension of GA into PPA | 5 | 13% | Either overcalling or undercalling |
| Areas of GA Sparing | 10 | 26% | Either overcalling or undercalling |
| Depigmentation | 20 | 53% | Overcalling on CFP |
| Regressed Drusen and Small Areas of GA | 7 | 18% | Undercalling on CFP |
| Poor Contrast | 12 | 32% | Undercalling on CFP |
CFP = color fundus photo; FAF = fundus autofluorescence; GA = geographic atrophy; PPA = peripapillary atrophy.
Fig. 4.
Examples of five broad categories of grading disagreement. Corresponding FAF images are below each CFP. Area of GA is encircled in yellow on CFP and green on FAF. Areas of spared retina (i.e., no GA) are encircled in magenta on FAF. A. Extension of GA into peripapillary atrophy; graders were instructed to grade peripapillary atrophy confluent with macular atrophy within the arcades. B. An island of GA sparing was noted on FAF. C. Depigmentation. D. Regressed drusen and small areas of GA. E. Poor contrast on CFP also led to disparities in measurements.
Disagreement in Identifying Foveal Involvement
Identification of foveal involvement was a common source of disagreement between graders for both imaging modalities (Figure 5), with an overlap in sensitivities and specificities noted. Sensitivity of graders to detect foveal involvement (defined arbitrarily as visual acuity ≤20/80) was 86% to 97% for CFP and 72% to 93% for FAF. Specificity of graders to detect foveal sparing (defined arbitrarily as visual acuity ≥20/40) was 74% to 76% for CFP and 59% to 88% for FAF. There were no statistically significant differences for any grader when classifying foveal involvement (Grader 1, P = 0.32; Grader 2, P = 0.06; Grader 3, P = 0.32; McNemar test) or sparing (Grader 1, P = 0.06; Grader 2, P = 0.18; Grader 3, P = 0.08; McNemar test). For two graders, there was a trend toward CFP being more accurate than FAF in classifying foveal sparing.
Fig. 5.
Identification of foveal involvement and sparing was a common source of disagreement between graders for both imaging modalities. Visual acuity (VA) was used as the standard for foveal sparing (determined by VA ≥ 20/40). Area of GA is encircled in yellow on CFP and green on FAF. Areas of spared retina (i.e., no GA) are encircled in dark blue on CFP. A. In this example, VA was 20/32. All graders identified the fovea as at least half spared on FAF and on CFP. B. Disagreements in identifying foveal involvement (determined by VA ≤20/80). In this example, VA was 20/100 to 2. Only one grader identified the fovea as at least half involved on FAF, whereas all graders correctly identified the fovea as at least half involved on CFP. On FAF, the left image demonstrates partial foveal involvement, the center image demonstrates no foveal involvement (i.e., complete foveal sparing), and the right image demonstrates complete foveal involvement.
Discussion
This is one of the first studies of digital imaging of GA; previously, most studies used film. Sunness et al7,8 used manual tracings projected from film in their natural history studies. Despite this labor-intensive technique, they reported high reproducibility defined as <0.5 DA difference in total GA area (or <1.27 mm2).7 Six of 43 eyes (14%) in their study had measurement differences >0.5 DA. The median difference in GA area in their study was 0.17 DA (0.43 mm2). In our study, the median differences in GA area between graders ranged from 0.34 mm2 to 0.60 mm2 for FAF and 0.46 mm2 to 0.50 mm2 for CFP (Table 3). Although a formal, direct comparison of our results with previous studies is not possible, these median differences appear similar. Interestingly, in our study, the coefficient of variation was higher for CFP compared with FAF.
The Age-Related Eye Disease Study Research Group also used film CFP to measure GA area.9 Although standardized grids were used to approximate sizes of lesions, the contemporaneous reproducibility was reported as 90.9% agreement for presence and extent of GA, measured incrementally in 6 steps from “definitely present but <0.241 DA”, to ≥2 DA (κ = 0.63). Temporal reproducibility was similarly reported. However, “depigmentation” was also reported separately from GA and, given its imprecise definition,9 may refer to lesions at times considered to be GA. Not surprisingly, the corresponding contemporaneous reproducibility for depigmentation (68.2% agreement, κ = 0.63) was less than the agreement for the presence of GA.
Three previous studies investigating GA progression with FAF images used similar techniques as did our study when measuring GA on digital FAF images,6,11,12 whereas a fourth study used a semiautomated process5 to perform their GA area measurements. None, however, calculated interobserver or intraobserver agreement of their measurements. Therefore, a direct comparison with those studies is not possible.
To our knowledge, no published studies have evaluated the reliability of FAF for measuring GA size. This study demonstrates that FAF has a high interobserver agreement. Fundus autofluorescence may be regarded as a reliable imaging modality for evaluating GA size and, consequently, for monitoring progression. The high intraobserver agreement between CFP and FAF is reassuring in that both imaging modalities provide similar measurements of GA size.
The majority of differences between measurements for the 2 imaging modalities were close to zero for each eye for each grader (Figure 1); however, as average GA size increased, CFP tended to measure more GA area than FAF. Conversely, as average GA size decreased, FAF tended to measure more GA area than CFP. Although this was not statistically significant, this discrepancy can be explained by properties intrinsic to both imaging types. There is markedly improved contrast when measuring GA on FAF, which provides increased sensitivity for detecting small areas of atrophy in early stages of disease. This is evidenced by the larger number of foci of GA identified by graders on FAF compared with CFP. This improved contrast of small GA on FAF may result in undercalling of GA on CFP as compared with FAF. Interpretation of smaller areas of decreased FAF should be performed with caution, however. Sunness et al14 have demonstrated relative hypo-autofluorescence in areas of retinal pigment epithelium attenuation without frank atrophy or loss of visual function (as measured with microperimetry), leading to possible overcalling of GA on FAF. Additionally, it is more difficult to identify areas of regressed drusen on CFP; this may also result in under-calling of GA on CFP. Alternatively, graders may overestimate GA using CFP in the setting of nonatrophic depigmentation, which has previously been described as a stage preceding atrophy.15 Measurement adjustments based on refractive errors are not relevant because comparisons are being made for the same eye at the same time point.
As noted with studies by Sunness, identification of foveal center may be difficult with color film photos. Similarly, with FAF, discerning GA involvement of the foveal center may be difficult. The normal fovea has moderately decreased autofluorescence on FAF imaging due to its increased content of pigments, such as lutein and zeaxanthin. Consequently, in eyes with atrophic changes contiguous with the fovea, the grader could potentially overestimate GA area by including normal fovea or underestimate atrophy by excluding involved fovea. Schmitz-Valckenberg et al16 described foveal structural changes with spectral-domain optical coherence tomography in setting of non–fovea-involving GA. Future studies may involve spectral-domain optical coherence tomography with image registration to confirm foveal sparing or involvement instead of visual acuity when assessing extent of GA. Also, if available, it may be helpful to assess shape/boundaries of macular pigment in the fellow eye if foveal involvement is unilateral.
In our study, a larger number of eyes were excluded because of poor FAF image quality than CFP image quality, and a larger number of FAF images (36%) included in the study were graded as fair image quality in comparison with CFP images (24%). Cataracts can affect the image quality, and this would be expected to affect FAF more than CFP because the excitation wavelength is in the blue range of the visible spectrum. Degraded image quality of FAF may also result from dry eyes and photographer error in acquisition. Additionally, use of fluorescein dye to measure intraocular pressure during the clinical examination may also degrade the image. For this reason, we recommend measuring intraocular pressure without fluorescein in patients who will undergo FAF imaging. Improved FAF image quality may be obtained by averaging multiple FAF images to obtain a final image with even less noise. In any future prospective study of GA, averaging of FAF images should be standardized. The lack of a normative standardized database has been suggested as another factor limiting the utility of FAF.17 However, the lack of a normative database for FAF did not prevent our graders from making highly reproducible measurements that had high agreement with CFP.
Compared with film, digital photographs are far less labor intensive to grade and provide for comparable reliability. Benefits of CFP include better visualization of other AMD risk factors, such as drusen and hyperpigmentation. Fundus autofluorescence imaging offers improved contrast of GA, which makes this imaging more appealing for automation of GA-related measurements. Automation of measurements with image processing will probably be required for large-scale clinical trials. Another benefit of FAF imaging over CFP is that FAF may provide information regarding risk of progression.6,11,12
Because foveal involvement or sparing is a potential source of interobserver disagreement for both CFP and FAF, GA enlargement should remain the primary clinical endpoint and not foveal involvement. Although the high intraobserver agreement between CFP and FAF suggests that either imaging modality would be appropriate for the measurement of GA area, the use of both CFP and FAF would maximize the benefits of both techniques. In our study, we show that FAF imaging provides more reproducible measurements of GA and is better able to detect small areas of GA.
Acknowledgments
Supported by NEI 1K23 EY018895-01 and NIH P30-EY005722 Core Grant for Vision Research.
Footnotes
Presented in part at American Academy of Ophthalmology Annual Meeting 2008, Atlanta, Georgia; and World Ophthalmology Congress 2008, Hong Kong, China.
None of the authors have any financial/conflicting interests to disclose.
References
- 1.Bindewald A, Bird AC, Dandekar SS, et al. Classification of fundus autofluorescence patterns in early age-related macular disease. Invest Ophthalmol Vis Sci. 2005;46:3309–3314. doi: 10.1167/iovs.04-0430. [DOI] [PubMed] [Google Scholar]
- 2.Bindewald A, Schmitz-Valckenberg S, Jorzik JJ, et al. Classification of abnormal fundus autofluorescence patterns in the junctional zone of geographic atrophy in patients with age-related macular degeneration. Br J Ophthalmol. 2005;89:874–878. doi: 10.1136/bjo.2004.057794. [DOI] [PMC free article] [PubMed] [Google Scholar]
- 3.Lois N, Owens SL, Coco R, et al. Fundus autofluorescence in patients with age-related macular degeneration and high risk of visual loss. Am J Ophthalmol. 2002;133:341–349. doi: 10.1016/s0002-9394(01)01404-0. [DOI] [PubMed] [Google Scholar]
- 4.Einbock W, Moessner A, Schnurrbusch UE, et al. Changes in fundus autofluorescence in patients with age-related maculopathy. Correlation to visual function: a prospective study. Graefes Arch Clin Exp Ophthalmol. 2005;243:300–305. doi: 10.1007/s00417-004-1027-3. [DOI] [PubMed] [Google Scholar]
- 5.Hwang JC, Chan JWK, Chang S, Smith RT. Predictive value of fundus autofluorescence for development of geographic atrophy in age-related macular degeneration. Invest Ophthalmol Vis Sci. 2006;47:2655–2661. doi: 10.1167/iovs.05-1027. [DOI] [PMC free article] [PubMed] [Google Scholar]
- 6.Holz FG, Bindewald-Wittich A, Fleckenstein M, et al. Progression of geographic atrophy and impact of fundus autofluorescence patterns in age-related macular degeneration. Am J Ophthalmol. 2007;143:463–472. doi: 10.1016/j.ajo.2006.11.041. [DOI] [PubMed] [Google Scholar]
- 7.Sunness JS, Bressler NM, Tian Y, et al. Measuring geographic atrophy in advanced age-related macular degeneration. Invest Ophthalmol Vis Sci. 1999;40:1761–1769. [PubMed] [Google Scholar]
- 8.Sunness JS, Margalit E, Srikumaran D, et al. The long-term natural history of geographic atrophy from age-related macular degeneration: enlargement of atrophy and implications for interventional clinical trials. Ophthalmology. 2007;114:271–277. doi: 10.1016/j.ophtha.2006.09.016. [DOI] [PMC free article] [PubMed] [Google Scholar]
- 9.Age-Related Eye Disease Study (AREDS) Research Group. The Age-Related Eye Disease Study system for classifying age-related macular degeneration from stereoscopic color fundus photographs: the Age-Related Eye Disease Study Report Number 6. Am J Ophthalmol. 2001;132:668–681. doi: 10.1016/s0002-9394(01)01218-1. [DOI] [PubMed] [Google Scholar]
- 10.Lindblad AS, Lloyd PC, Clemons TE, et al. Change in area of geographic atrophy in the Age-Related Eye Disease Study: AREDS report number 26. Arch Ophthalmol. 2009;127:1168–1174. doi: 10.1001/archophthalmol.2009.198. [DOI] [PMC free article] [PubMed] [Google Scholar]
- 11.Holz FG, Bellman C, Staudt S, et al. Fundus autofluorescence and development of geographic atrophy in age-related macular degeneration. Invest Ophthalmol Vis Sci. 2001;42:1051–1056. [PubMed] [Google Scholar]
- 12.Schmitz-Valckenberg S, Bindewald-Wittich A, Dolar-Szczasny J, et al. Correlation between the area of increased autofluorescence surrounding geographic atrophy and disease progression in patients with AMD. Invest Ophthalmol Vis Sci. 2006;47:2648–2654. doi: 10.1167/iovs.05-0892. [DOI] [PubMed] [Google Scholar]
- 13.Barnhart HX, Haber M, Song JL. Overall concordance correlation coefficient for evaluating agreement among multiple observers. Biometrics. 2002;58:1020–1027. doi: 10.1111/j.0006-341x.2002.01020.x. [DOI] [PubMed] [Google Scholar]
- 14.Sunness JM, Ziegler MD, Applegate CA. Issues in quantifying atrophic macular disease using retinal autofluorescence. Retina. 2006;26:666–672. doi: 10.1097/01.iae.0000236472.56195.e9. [DOI] [PubMed] [Google Scholar]
- 15.Klein ML, Ferris FL, III, Armstrong J, et al. Retinal precursors and the development of geographic atrophy in age-related macular degeneration. Ophthalmology. 2008;115:1026–1031. doi: 10.1016/j.ophtha.2007.08.030. [DOI] [PubMed] [Google Scholar]
- 16.Schmitz-Valckenberg S, Fleckenstein M, Helb HM, et al. In-vivo imaging of foveal sparing in geographic atrophy secondary to age-related macular degeneration. Invest Ophthalmol Vis Sci. 2009;50:3915–3921. doi: 10.1167/iovs.08-2484. [DOI] [PubMed] [Google Scholar]
- 17.Hopkins J, Walsh A, Chakravarthy U. Fundus autofluorescence in age-related macular degeneration: an epiphenomenon. Invest Ophthalmol Vis Sci. 2006;47:2269–2271. doi: 10.1167/iovs.05-1482. [DOI] [PubMed] [Google Scholar]


