Abstract
Reports from a United States cohort of chronic hemodialysis patients suggested that weight loss, a decline in pre-dialysis systolic blood pressure, and decreased serum albumin may precede death. However, no comparative studies have been reported in such patients from other countries. Here we analyzed dynamic changes in these parameters in hemodialysis patients and included 3593 individuals from 5 Asian countries; 35,146 from 18 European countries; 8649 from Argentina; and 4742 from the United States. In surviving prevalent patients, these variables appeared to have notably different dynamics than in patients who died. While in all populations the interdialytic weight gain, systolic blood pressure, and serum albumin levels were stable in surviving patients, these indicators declined starting more than a year ahead in those who died with the dynamics similar irrespective of gender and geographic region. In European patients, C-reactive protein levels were available on a routine basis and indicated that levels of this acute-phase protein were low and stable in surviving patients but rose sharply before death. Thus, relevant fundamental biological processes start many months before death in the majority of chronic hemodialysis patients. Longitudinal monitoring of these dynamics may help to identify patients at risk and aid the development of an alert system to initiate timely interventions to improve outcomes.
Keywords: epidemiology and outcomes, inflammation, outcomes, nutrition, systolic blood pressure
Clinical experience shows that chronic hemodialysis (HD) patients expected to die within weeks share certain characteristics, such as poor nutrition and weight loss, increased inflammation, and worsening of cardiovascular status. However, more subtle changes in other clinical and laboratory parameters might occur before significant clinical deterioration becomes apparent. Various risk factors have emerged that have significant value in predicting the greatly increased mortality of dialysis patients. However, most of the studies have focused on single point in time measurements, whereas the longitudinal trend of surrogate outcome parameters and the dynamic evolution before death have not been widely studied.1 Insight into temporal trends of surrogate outcome indicators are relevant both from a pathophysiological point of view and for the future development of predictive models, which might aid the clinician in timely identifying patients at risk for adverse outcomes.
Recent reports from Renal Research Institute (RRI) suggested that in chronic HD patients from the United States, a decline in systolic blood pressure (SBP),2, 3 body weight, and serum albumin levels4 were associated with an increased mortality risk. It is noteworthy that these dynamic changes were already apparent months before death and qualitatively independent of age, gender, and race. These observations led to the hypothesis that fundamental biological processes may be operative in the majority of chronic HD patients weeks and even months before death, notwithstanding race and gender. However, the observed patterns of clinical and laboratory parameters before death may be associated with specific dialysis practices or environmental factors. As RRI clinics follow similar dialysis procedures, the relatively homogeneous dialysis practice pattern renders the testing of this hypothesis difficult. Therefore, MONDO (MONitoring Dialysis Outcomes), a multinational consortium of HD databases encompassing patient-level data, was founded to further study this aspect. MONDO allows us to combine HD dialysis databases containing patient-level data from Asia, North and South America, and Europe. Because of its outreach, MONDO encompasses patients of different national, racial, and ethnic backgrounds. Currently, the MONDO database contains longitudinal patient-level measurements of key variables from >145,000 patients in 25 countries over a time period of up to 11 years. The MONDO database allowed us to test the hypothesis that the temporal evolution of certain clinical and laboratory indicators over several months before death is comparable among the majority of chronic HD patients, independent of gender and region of the world. We chose to study the temporal evolution of indicators of the nutritional, cardiovascular, and inflammatory domains, namely interdialytic weight gain (IDWG), SBP, serum albumin, and C-reactive protein (CRP).
RESULTS
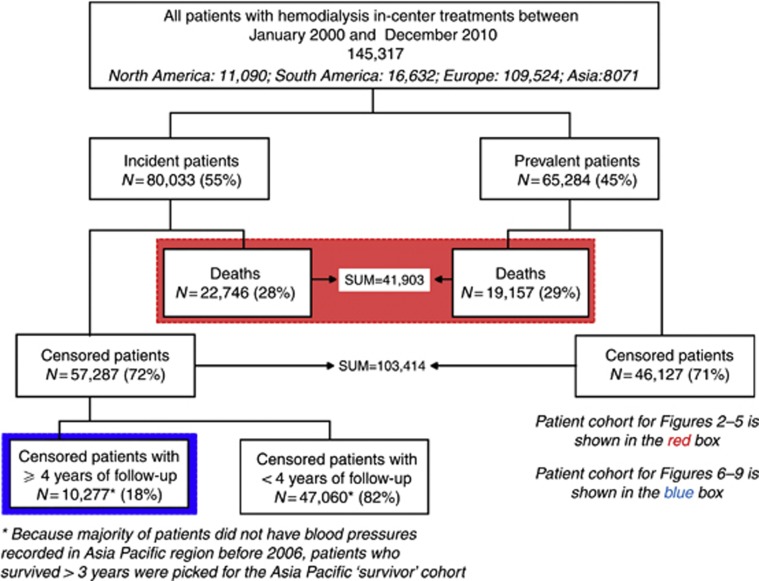
A total of 145,317 HD patients from 25 countries received at least one in-center HD treatment between January 2000 and December 2010. Of this number, 41,903 patients died (Europe: 30,539 deaths (18 countries); Asia: 1809 deaths (5 countries); South America: 6298 deaths; North America: 3257 deaths). In all, 10,277 incident patients survived ⩾4 years on HD (Europe: 4607; Asia: 1784; South America: 2351; North America: 1485). Figure 1 presents the flowchart of the study design. Baseline characteristics of patients who died and incident patients who survived for ⩾4 years are presented in Table 1.
Figure 1.
Patient flowchart.
Table 1. Characteristics of the study populations.
| Continent | Number of patients | Age (years) | Male % | Diabetic % | With CVD (other than hypertension) % | With hypertension % | With hepatitis % | With residual renal function at dialysis initiation % | With catheters at dialysis initiation % | Postdialysis weight (kg) | Equilibrated Kt/V | Treatment time (min) | Predialysis SBP (mm Hg) | Interdialytic weight gain (as % of postweight) | Albumin (g/dl) |
|---|---|---|---|---|---|---|---|---|---|---|---|---|---|---|---|
| Patients who died (N=41,903) | |||||||||||||||
| North America | 3257 | 69.9 (69.4–70.4) | 55.6 | 56.8 | 43.0 | 49.0 | 2.0 | 22.0 | 70.0 | 69.8 (69.1–70.5) | 1.34 (1.33–1.36) | 202 (200–203) | 134.6 (133.4–135.7) | 3.35 (3.26–3.44) | 3.31 (3.29–3.33) |
| South America | 6298 | 68 (67.7–68.3) | 58.2 | 34.3 | NA | NA | NA | NA | NA | 65.9 (65.5–66.4) | NA | NA | 124.5 (123.9–125) | 3.16 (3.07–3.24) | 3.51 (3.5–3.53) |
| Europe | 30,539 | 72.0 (71.3–72.6) | 58.8 | 34.8 | 50.0 | 34.0 | 5.0 | NA | 39.6 | 64.2 (62.1–67.0) | 1.34 (1.32–1.37) | 223 (209–240) | 122.1 (121.6–123) | 2.74 (2.69–2.88) | 3.50 (3.46–3.56) |
| Asia | 1809 | 67.9 (67.2–68.5) | 53.4 | 47.0 | NA | NA | 5.0 | NA | 13.0 | 53.4 (52.9–54) | 1.42 (1.39–1.44) | 236 (235–237) | 135.8 (134.2–137.4) | 4.22 (4.06–4.38) | 3.44 (3.41–3.47) |
| Incident patients who survived >4 years (N=10,227) | |||||||||||||||
| North America | 1485 | 56 (55.3–56.8) | 56.8 | 52.9 | 48.0 | 72.0 | 5.0 | 34.0 | 62.0 | 77.9 (76.8–79.1) | 1.43 (1.42–1.45) | 208 (206–210) | 147.6 (146.1–149) | 3.36 (3.26–3.45) | 3.9 (3.87–3.92) |
| South America | 2351 | 52 (51.3–52.7) | 57.4 | 31.8 | NA | NA | NA | NA | NA | 69.6 (68.9–70.2) | NA | NA | 128 (127.2–128.8) | 3.03 (2.95–3.12) | 3.92 (3.91–3.94) |
| Europe | 4607 | 61.4 (60.9–61.8) | 62.1 | 48.4 | 42.0 | 43.0 | 6.0 | NA | 36.8 | 69.5 (67–71) | 1.46 (1.40–1.52) | 236 (230–239) | 133.4 (132.4–134.3) | 2.71 (2.67–2.87) | 3.76 (3.70–3.88) |
| Asia | 1784 | 54 (53.3–54.6) | 52.9 | 36.1 | NA | NA | 1.0 | NA | 3.0 | 57 (56.5–57.5) | 1.48 (1.47–1.5) | 242 (241–242) | 138.4 (137.3–139.5) | 4.11 (4.01–4.2) | 3.91 (3.89–3.93) |
Abbreviations: CVD, cardiovascular disease; NA, not reliably available; SBP, systolic blood pressure.
All continuous variables are presented as mean (95% confidence interval (CI)).
Countries in the Fresenius Medical Care (FMC) Asia-Pacific region include Taiwan, Hong Kong, South Korea, Singapore, and Australia. Countries in the FMC Europe network include Bosnia, Czech Republic, France, Hungary, Ireland, Italy, Poland, Portugal, Romania, Russia, Sweden, Slovakia, Slovenia, Spain, Serbia, Turkey, and the United Kingdom.
Incident and prevalent patients are represented disproportionately in the different databases, owing largely to the way they developed during the period of 2000–2010. This significantly affects the number of patients a database could contribute to the ‘incident survivors' and ‘patients who died' cohorts. Therefore, patient counts above cannot be used to calculate mortality rates.
Nearly all patients from Europe and South and North America were prescribed to dialyze thrice weekly. More than 85% of patients were dialyzed three times weekly in Singapore and Taiwan, whereas >70% were dialyzed twice weekly in Hong Kong. Dialyzer reuse is a standard practice in South America, and in most clinics in Singapore and Hong Kong. All other countries use single-use dialyzers on >90% of the treatments.
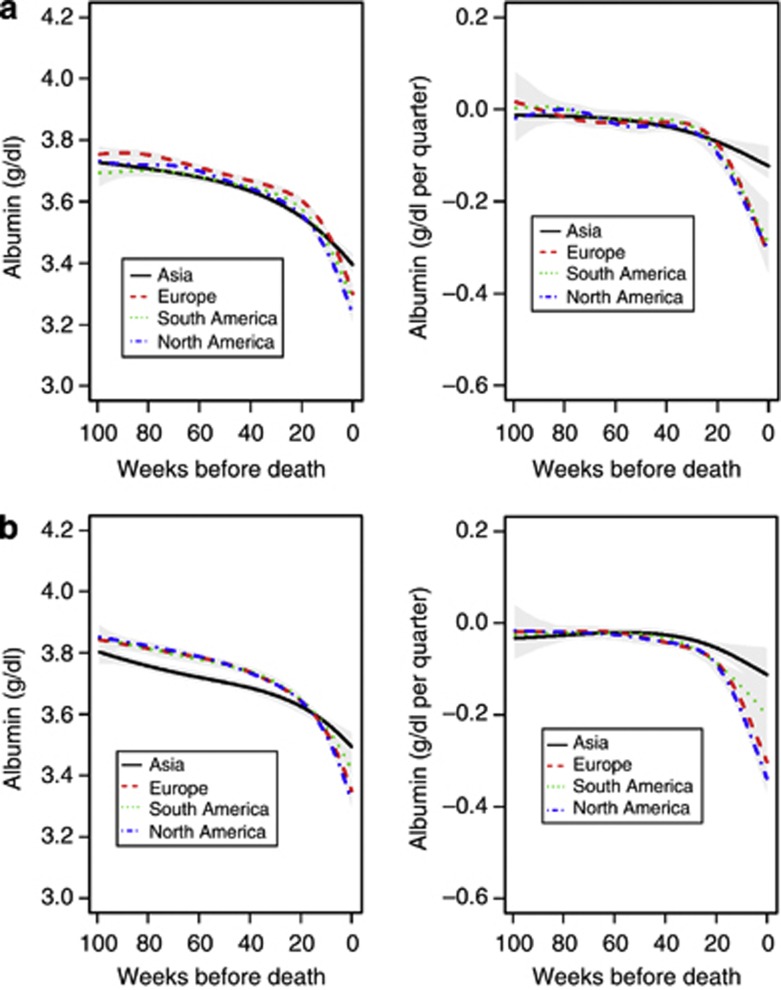
In all regions studied, serum albumin levels dropped between 0.33 (Asia) and 0.52 (North America) g/dl in the 2 years preceding death in female patients (Figure 2a, left). The rate of serum albumin decline accelerated before death and was comparable in Europe and South and North America, and less pronounced in Asia (Figure 2a, right). The results were materially identical in male patients (Figure 2b) and comparable irrespective of diabetes status (data not shown).
Figure 2.
Mean serum albumin and 95% confidence interval. (a) Mean serum albumin and 95% confidence interval in female patients in the 104 weeks before death. The left panels show estimates of the partially conditional means with 95% confidence intervals, and the right panels show estimates of rate of change trajectories with 95% confidence intervals. (b) Mean serum albumin and 95% confidence interval in male patients in the 104 weeks before death.
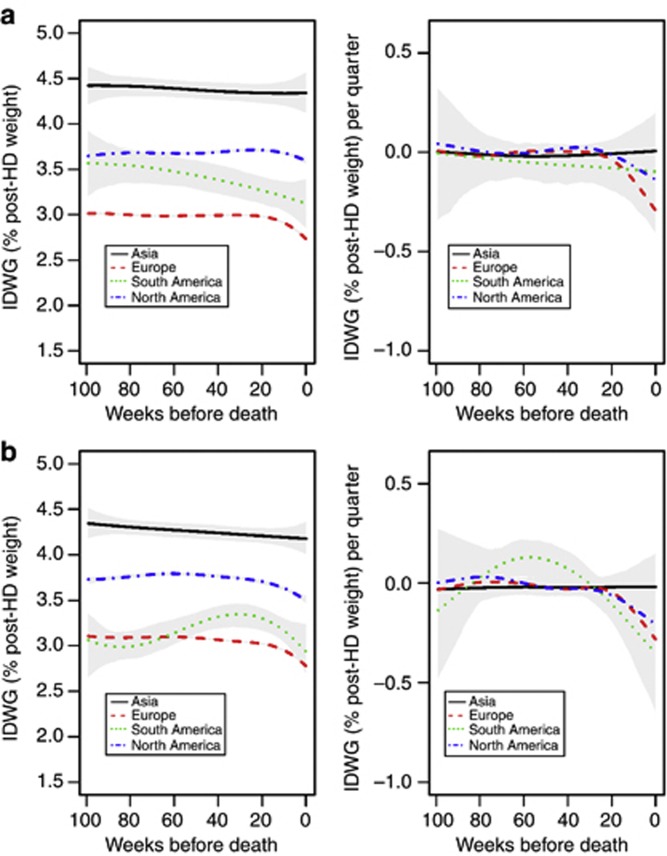
In Europe and North and South America, IDWG declined significantly before death, whereas the IDWG changes in Asia were either flat or nonsignificant with wide confidence intervals (Figures 3a and b).
Figure 3.
Mean interdialytic weight gain (IDWG; expressed as percent of post-hemodialysis (post-HD) weight) and 95% confidence interval. (a) Mean interdialytic weight gain (IDWG; expressed as percent of post-hemodialysis (post-HD) weight) and 95% confidence interval in female patients in the 104 weeks before death. The left panels show estimates of the partially conditional means with 95% confidence intervals, and the right panels show estimates of rate of change. (b) Mean IDWG (expressed as percent of post-HD weight) and 95% confidence interval in male patients in the 104 weeks before death.
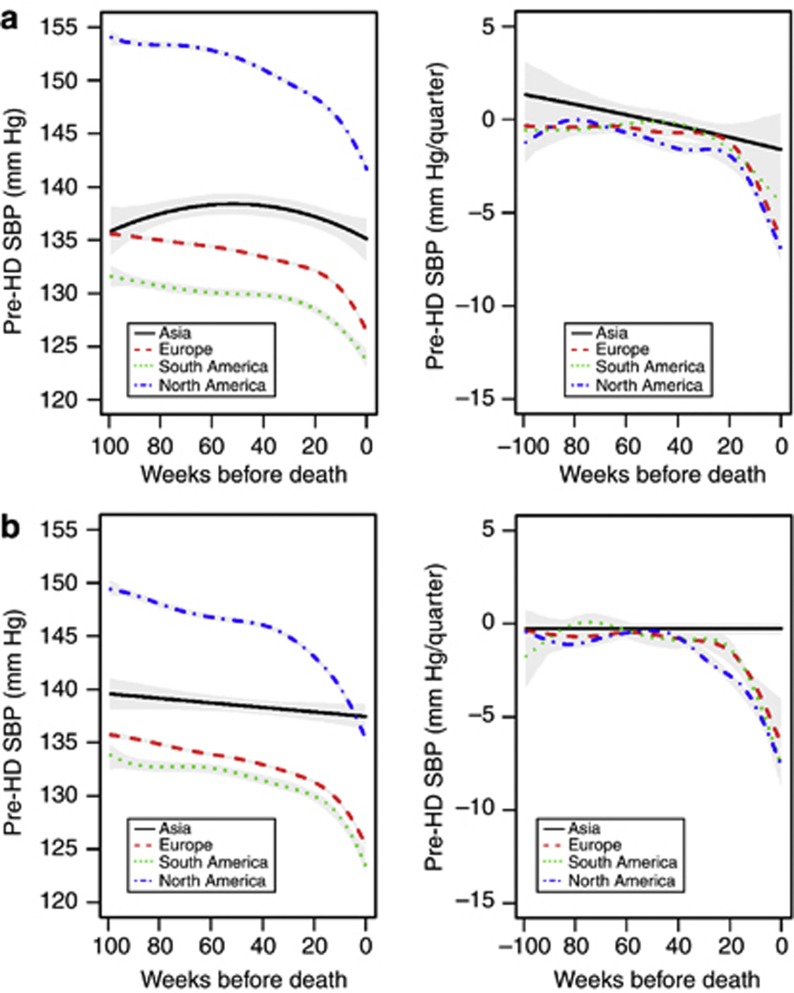
In female patients from Europe and North and South America, SBP levels dropped between 7.8 (South America) and 12.4 (North America) mm Hg in the 2 years preceding death (Figure 4a, left); SBP decline was less pronounced in patients from Asia. The rate of SBP decline accelerated before death and was similar in patients from Europe and North and South America, but less pronounced in Asia (Figure 4a, right). The results were materially identical in male patients, although the decline in Asian patients was not significant (Figure 4b).
Figure 4.
Mean pre-hemodialysis (pre-HD) systolic blood pressure (SBP) and 95% confidence intervals. (a) Mean pre-hemodialysis (pre-HD) systolic blood pressure (SBP) and 95% confidence intervals in female patients in the 104 weeks before death. The left panels show estimates of the partially conditional means with 95% confidence intervals, and the right panels show estimates of rate of change trajectories with 95% confidence intervals. (b) Mean pre-HD SBP and 95% confidence intervals in male patients in the 104 weeks before death.
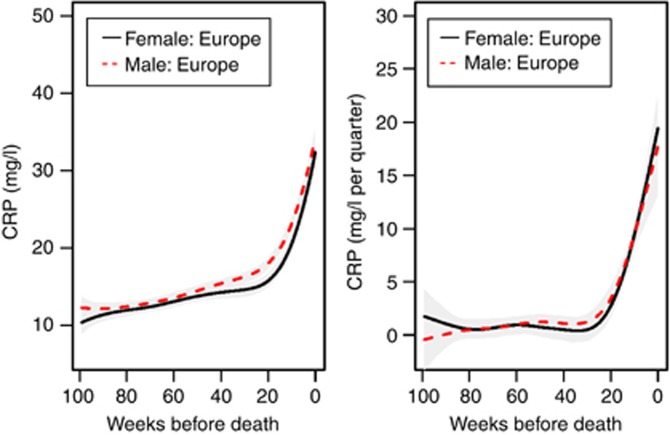
CRP levels increased by 20 mg/l in the 2 years before death (Figure 5, left). The rate of CRP increase accelerated before death and was similar in both genders (Figure 5, right).
Figure 5.
Mean C-reactive protein (CRP) and 95% confidence intervals in the 104 weeks before death. The left panel shows estimates of the partially conditional means with 95% confidence intervals, and the right panel shows estimates of rate of change trajectories with 95% confidence intervals.
An analysis of the causes of deaths (cardiovascular disease, infections, neoplasms, and other) indicated that the majority of patients in each region died of cardiovascular disease, with the highest proportion in North America (61%) versus lowest in Asia (27%). Neoplasms caused the lowest percentage of deaths in each region. Irrespective of the cause of death, the dynamics of albumin, IDWG, SBP, and CRP were qualitatively comparable before death (Supplementary Figures S1 to S4 online). In a separate analysis of patients who died of sudden death, we noted an increase in CRP and a decline in albumin before death in those patients (data not shown).
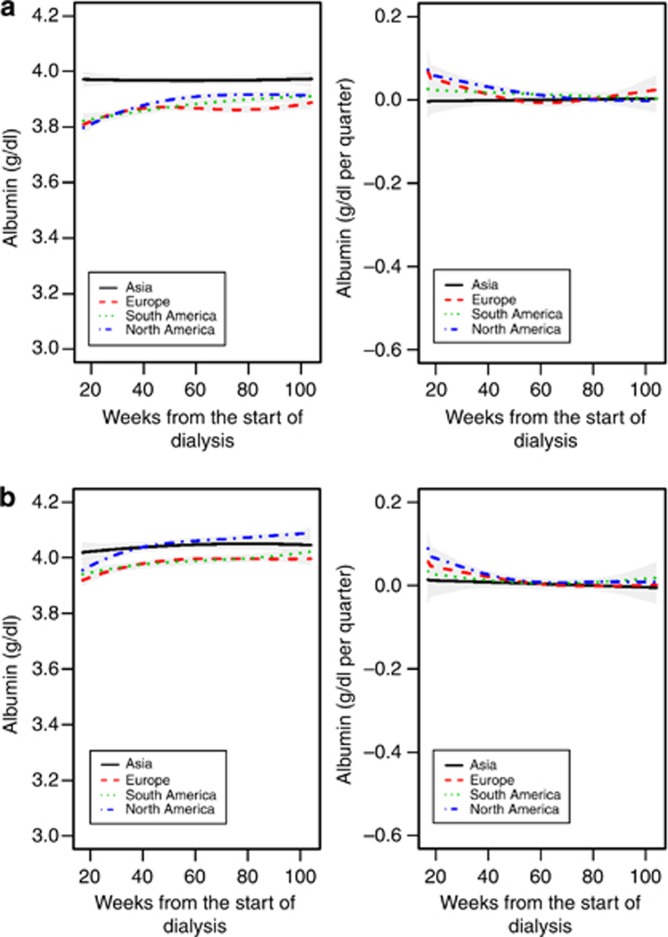
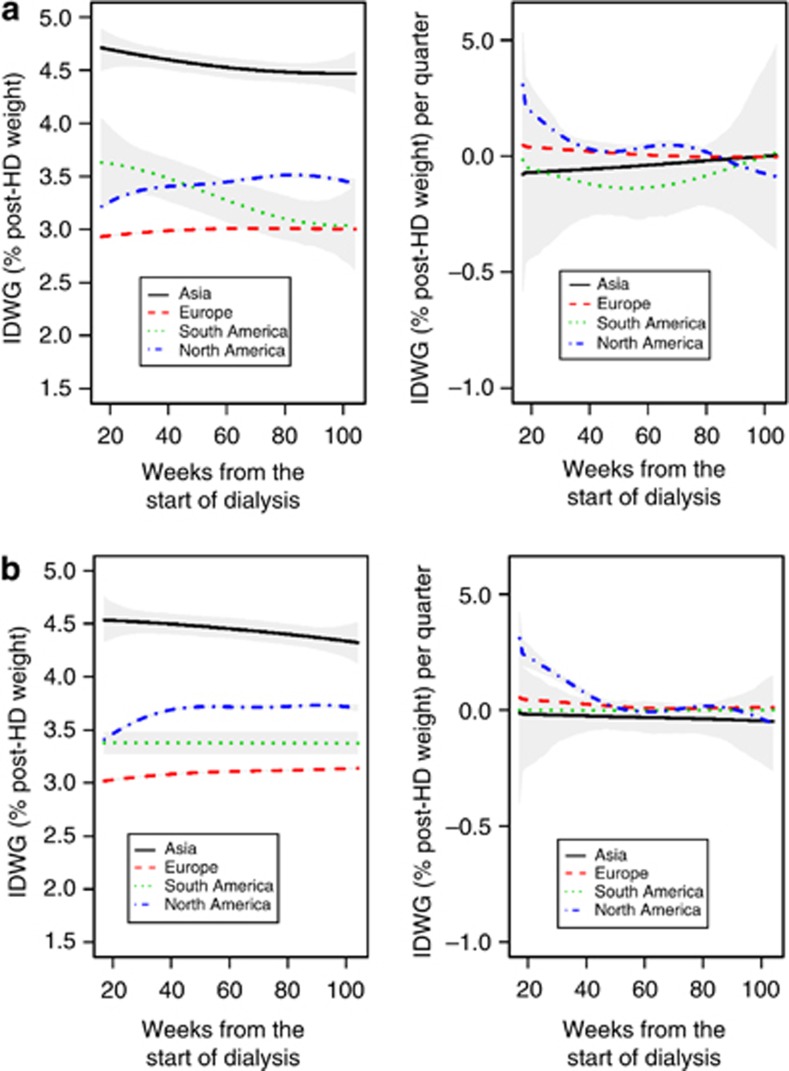
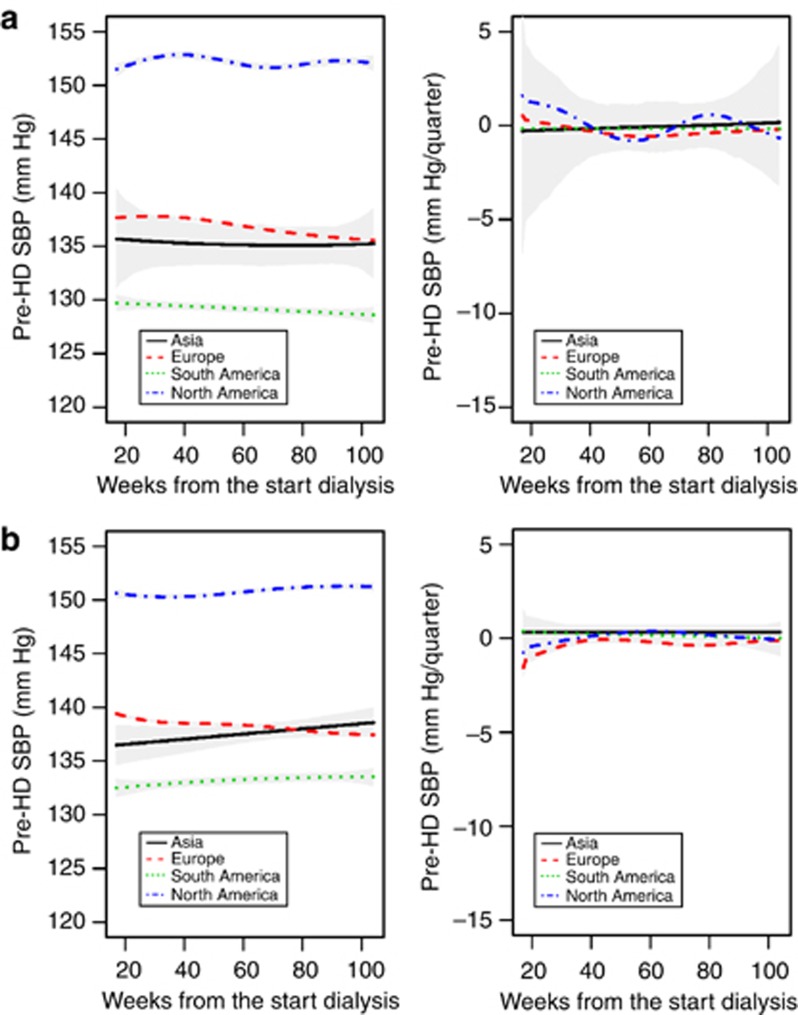
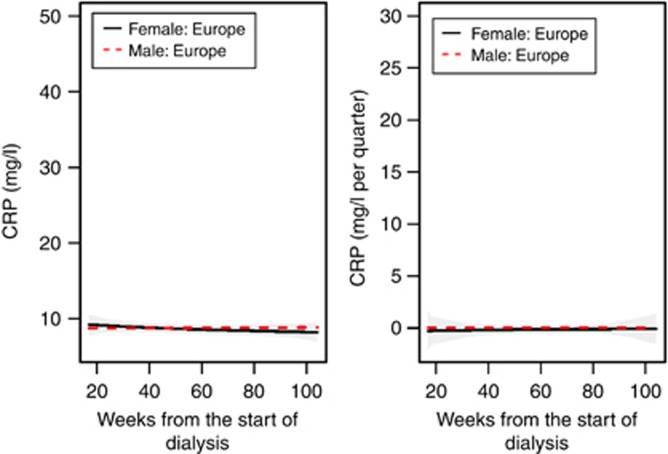
Because backward processes (that is, slopes before death) and forward processes (that is, slopes in surviving patients looking forward) cannot be compared directly, we conducted two analyses to elucidate parameter dynamics in survivors and nonsurvivors. In the first analysis, we selected incident patients who did not die during the study period and who survived ⩾4 years on dialysis. We graphed albumin, IDWG, SBP, and CRP in the first 2 years on dialysis in those patients to determine if any changes also exist in survivors (Figures 6). In the surviving patients, albumin, IDWG, SBP, and CRP did not appear to change in the first 2 years on HD. In fact, other than the initial minor increase in albumin, SBP, CRP, and IDWG remained stable throughout the observation period (Figures 6, left). The first derivatives of the trajectories also indicated no material change (Figures 6, right). In the second analysis (Supplementary Information online), we compared patients who survived with patients with the same vintage who died. Supplementary Figures S5a, S6a, and S7a online show incident patients who survived the first 2 years on dialysis (left panels) versus patients who survived the first 120 days but died between day 121 and end of 2 years on dialysis (right panels); Supplementary Figure S8a online delineates CRP in survivors and nonsurvivors in the same chart. Supplementary Figures S5b, S6b, and S7b online show patients who survived the first 4 years on dialysis (left) versus patients who survived the first 2 years on dialysis but died between year 2 and 4 years (right); Supplementary Figure S8b online delineates CRP in both survivors (>4 years) and nonsurvivors. These results demonstrate notable differences in the patterns in the survivors versus patients who died during the same time period, with surviving patients generally showing no change, whereas nonsurvivors followed a declining (CRP rising) trajectory. In patients who died, the confidence intervals widen as the number of weeks from start on dialysis increases, because fewer patients are alive as time progresses.
Figure 6.
Mean serum albumin and 95% confidence interval. (a) Mean serum albumin and 95% confidence interval in the 104 weeks from the start of dialysis in female patients who survived >4 years. The left panels show estimates of the partially conditional means and the right panels show estimates of rate of change trajectories with 95% confidence intervals. (b) Mean serum albumin and 95% confidence interval in the 104 weeks from the start of dialysis in male patients who survived >4 years.
DISCUSSION
Our study involved >52,000 chronic HD patients from 25 countries and four continents, nearly 42,000 patients who had died, and ∼10,000 who had survived >4 years of dialysis. The main finding is evidence of comparable temporal evolutions of four key clinical and laboratory parameters before death. Regardless of geographical location, IDWG, SBP, and serum albumin started to decline more than a year before death, with the decline in IDWG and SBP being less apparent in Asia. In the Fresenius Medical Care (FMC) Europe network, routine CRP measurements were available, which showed a steep increase before death.
To the best of our knowledge, this is the first study showing the dynamic changes of key clinical and laboratory parameters before death in highly diverse international cohorts of chronic HD patients. In a previous smaller study in 2462 maintenance HD patients from Renal Research Institute (New York, NY), comparable trends for post-HD weight and serum albumin were shown.4 However, given the large variability of background mortality and treatment patterns throughout the world,5, 6, 7, 8 this study analyzed whether these trends were also apparent from a global perspective. Notably, most parameters assessed here started to deteriorate more than 1 year before death. Interestingly, a recent study indicated that functional status of HD patients remained stable until 1 month before death.9 This temporal difference suggests that subtle changes in physiological and laboratory parameters may herald clinical deterioration in dialysis patients, possibly at a stage that is amenable to intervention.
The decline in serum albumin was apparent at an earlier stage in this study as compared with the previous RRI study. However, this may be because of differences in statistical methodology between both studies. Whereas the previous study was based on linear mixed models, using linear spline functions with a knot point 12 weeks before death, this study looked at all observations 104 weeks before death in a continuous manner.10 The stable albumin levels in incident surviving patients observed by us can be compared with results from the Hemodialysis (HEMO) trial, where during the first 3 years of follow-up mean serum albumin levels declined by 0.21 g/dl.11 However, in contrast to our study, the HEMO trial enrolled prevalent patients with a vintage of 3.7±4.4 years, rendering a direct comparison with our results difficult.
The pathophysiological mechanisms underlying these dynamics cannot be directly deduced from the present observational data. The four parameters were chosen because they may reflect changes in three key domains, namely cardiovascular function, nutrition, and inflammation, and because most of these indicators (except CRP) are readily available and are used in daily clinical practice.
The decline in SBP may reflect deterioration in cardiovascular function,3 such as reduced cardiac output over time. The reduction in IDWG may reflect poorer appetite and diminished food intake.12 In this respect, it may be more sensitive than post-HD weight, which usually represents the prescribed target weight. Importantly, body composition may change significantly in the absence of body weight changes. For instance, despite a decline in lean body mass, body weight may remain stable because of a concurrent increase in extracellular volume if post-HD target weight is not adjusted accordingly. The decline in IDWG and SBP before death is likely a reflection of ‘reverse epidemiology,'13 and cannot be used as an argument against the importance of blood pressure control and meticulous attention to sodium and fluid volume restriction in dialysis patients. Indeed, several studies have shown a relationship between high IDWG (as well as fluid overload) and hypertension and mortality.14, 15, 16
Serum albumin, a composite marker of nutrition and inflammation, and CRP are strong predictors of outcome.17, 18, 19 The increase in CRP and the decline in the other three studied parameters occurred largely independently of age, gender, race, or region of the world (data on age and race not shown). Notable exceptions were the absence of declines in SBP in male, and in IDWG in both male and female Asian patients. The fact that SBP declined before death in all populations except in male HD patients from Asia is remarkable, and one may speculate that fluid overload is more prevalent in Asian patients close to death; unfortunately, this observation cannot be explained by the present data. It remains to be established whether environmental, treatment-related, genetic, and/or cardiac factors are involved in this phenomenon;15, 20, 21, 22 the relatively small number of patients (787 males) may also be a factor. Different clinical practices related to target weight determination and monitoring may vary among the patients studied, resulting in different blood pressure dynamics, particularly for malnourished patients whose target weight is not adjusted timely to their body weight.
Pre- and post-dialysis weights are only recorded once a month in the FMC Asia-Pacific network, and hence detailed information on IDWG may be missed. Studies in Southeast Asian populations living in the United States may provide important additional insights. The substantially higher SBP seen in both surviving and nonsurviving US patients compared with the other regions is impressive and deserves further investigation. We hypothesize that differences in fluid and anemia management and antihypertensive therapy may contribute to this observation.23
Analysis of trajectories of all factors measured before death by cause of death revealed no notable differences between patients dying from cardiovascular disease, infections, or neoplasms. Neoplasms appear to be associated with the most striking dynamic trends in the four parameters studied. Declines in albumin and increases in CRP were also observed in patients who died of sudden death, consistent with prior findings.24
This international study may contribute to the understanding of the pathophysiological phenomena occurring before death in this highly vulnerable group of patients. The main message for the clinical practitioner is that the temporal evolutions of albumin, SBP, IDWG, and CPR are as important to follow as their absolute levels. This insight should also serve as a wake-up call for dialysis providers, as they may have to put information systems in place that allow the physicians to not only follow absolute levels of variables but also their dynamics. Although a decline in albumin levels or rises in CRP usually alerts health-care providers, a consistent and unintended decline of SBP by more than 2–5 mm Hg per quarter or IDWG drop by >0.2% per quarter may go unnoticed. On an operational level, the identification of temporal patterns can be supported by patient reports that depict both absolute levels and trends of variables. Moreover, the results of our study offer guidance for the development of predictive models. We speculate that it might be possible to construct multivariate algorithms by combining IDWG, SBP, and serum albumin levels that may be more predictive of the death risk than each individual parameter. Such models may appreciate even subtle intraindividual dynamics, such as mild drops of SBP over the course of months and a decline of serum albumin even within the normal range, which are likely to escape notice in a busy clinical setting. Paradoxically, some of these changes of key indicators may be welcomed as the result of successful interventions. Of course, lower IDWG may also be the outcome of successful fluid counseling and also of salt restriction, and SBP decline may indicate better blood pressure control. However, as our data show, these changes may also be ominous signs, and to differentiate these possibilities requires a keen clinical assessment of the patient.
Whether or not ‘alert systems' can trigger more timely and cost-effective interventions and improve clinical outcomes has to be addressed in future prospective trials. These alert systems can be based on various statistical methodologies and use a severity index to highlight patients at higher risk of death requiring an intervention. However, there is little doubt that understanding changes preceding death by many months is indispensable for the development of predictive models.
A potential limitation of the study is that a majority of the patients studied are treated in FMC clinics. On the other hand, in Europe, patients from a different dialysis provider, KfH Germany, comprised a large component but provided similar results (not shown separately). Another limitation is the overrepresentation of patients from Europe and South America. We tried to address this issue by analyzing the data from each region separately. The current analysis is limited to four parameters only, which reflect cardiovascular, nutritional, and inflammatory domains. Future studies will extend these analyses to other indicators, including measures of cardiac function and body composition.
In conclusion, the temporal evolution of key clinical and laboratory indicators before death was found to be comparable in large international cohorts of chronic HD patients from four continents, with some exceptions in Asia. These findings raise the possibility that similar biological processes are operative in the months before death irrespective of gender, race, and region of the world. These findings may contribute to improved understanding of the factors leading to poor outcome in dialysis patients and aid the development of risk prediction models that may facilitate timely interventions and hopefully improve outcomes.
MATERIALS AND METHODS
Participants and study design
In this retrospective cohort study, we identified all chronic HD patients from 25 countries in 5 continents treated in clinics of FMC from Europe (17 countries), FMC Latin America (Argentina only), FMC Asia-Pacific (South East Asia and Australia, 5 countries), Renal Research Institute (USA), and the Kuratorium für Dialyse und Nierentransplantation e.V. (KfH, Germany) between 1 January 2000 and 31 December 2010 (‘study period'). The data from these provider databases were aggregated into continents: FMC Europe and KfH Germany data are titled ‘Europe' FMC Latin America data are titled ‘South America' FMC Asia-Pacific data are titled ‘Asia' and data from RRI are represented as ‘North America.'
Patients with at least one HD in-center treatment during the study period were stratified into incident (patients with first treatment recorded within 90 days of first ever dialysis) and prevalent. We conducted two separate analyses: the first looked at incident and prevalent patients who died during the study period (N=41,903), and the second looked at incident patients who did not die during the study period and survived >4 years on dialysis (‘censored' patients) (N=10,277). These two cohorts were chosen to assure that the two analyzed patient cohorts (survivors and nonsurvivors) did not overlap. Figure 1 presents the flowchart of the study design. Additional results are presented in Supplementary Information online, where we separate the dynamics before death by cause of death and compare the patients who survived with those who died with the same vintage. For the figures, only the continents with >250 patients were included (thus excluding Australia). Furthermore, all figures include only continents with >50 weeks of available observations with >10 patients in each week.
Data flow and analysis
In most databases, clinical data were transferred manually from the respective data sheets into a master database. Multiple levels of internal quality control measures were in place to guarantee data consistency and validity. In most European clinics and all of the RRI clinics, laboratory data were directly imported electronically from the clinical laboratories. KfH (Germany) data were analyzed locally by statisticians working with this particular network; all other data were analyzed centrally at the Department of Statistics and Applied Probability, University of California, Santa Barbara (Santa Barbara, CA). The same validated program codes were used by all statisticians.
Clinical parameters
Pre- and post HD body weight was measured using scales calibrated according to the respective national standards. IDWG in percent of post-HD body weight was calculated as the difference between pre-HD weight and the preceding post-HD weight divided by the preceding post-HD weight. In the European and North American data, SBP and IDWG are available for each dialysis session; in Asia and South America these data were available monthly. Of note, for Asia and South America, this meant that postdialysis weight from the previous month was used in calculation of IDWG. SBP was assessed by automated devices in all patients in North America, Asia, and Europe. Manual measurement of SBP was the standard procedure in South America. In all databases, SBP was measured with patients at rest in a supine or sitting position.
Laboratory analysis
In most European clinics and all of the RRI clinics, laboratory data were directly imported electronically from the clinical laboratories. The MONDO database compiles information on laboratory assays used. Serum albumin was measured by nephelometry in KfH (Germany) clinics and by the bromocresol green (BCG) method in all European clinics (except for Portugal), most Asian clinics, South America, and the United States. Both methods are calibrated to the international standard ERM DA 470k/IFCC. The bromocresol purple (BCP) method was used in Portugal and some HD clinics in Asia. To ensure comparability between the two methods, BCP measurements were transformed to BCG values using a published formula (concentrations in g/dl):25 AlbuminBCG=AlbuminBCP+0.55. Serum albumin levels were measured at regular intervals, ranging from monthly to quarterly. CRP was measured routinely only in FMC Europe clinics.
Statistical analysis
For descriptive purposes, means and s.d. of continuous variables and percentages for categorical variables are presented. For the analysis of the variables of interest (IDWG, SBP, CRP, and albumin), we considered the backward processes that start at death and go backward in time.10 Y(u) is denoted as the backward process for a patient u weeks (or months) before death, and T as the survival time of this patient from the initiation of dialysis. We were interested in estimating the partially conditional mean E(Y(u) | T>u) for a period of 2 years before death.26 The partially conditional mean E(Y(u) | T>u) represents the expectation of the backward process u weeks before death conditional on the patient having survived longer than u weeks. For weekly measurements, the 2-year period was divided into 104 weeks. For the fixed 1⩽u⩽104 weeks, we estimated E(Y(u) | T>u) by the average measurements among patients who survived longer than u weeks. The weekly (or monthly) estimates of partially conditional means were rough. To further investigate the trend of the partially conditional means and their trajectories before death, we fitted the estimated weekly partially conditional means using quintic splines and estimated the trajectories of the first derivatives (‘velocity'), which represent the rate of change of the variable. The R package ASSIST (R Foundation for Statistical Computing, Vienna, Austria) was used to fit the quintic spline where the smoothing parameter was selected by the generalized maximum likelihood method. Bootstrap confidence intervals were constructed as described by Wang.27
Similar spline functions were fitted in the forward analysis looking at all incident patients who survived for >4 years: data for IDWG, albumin, CRP, and SBP were analyzed over a period of 2 years (104 weeks) from the start of dialysis. This cohort was chosen to avoid overlap with the backward process. Similar methodology was applied to figures shown in Supplementary Information online. All computations were made with R statistics software system, version 2.11.1 (R Foundation for Statistical Computing).28
Figure 7.
Mean interdialytic weight gain (IDWG; expressed as percent of post-hemodialysis (post-HD weight)) and 95% confidence interval. (a) Mean interdialytic weight gain (IDWG; expressed as percent of post-hemodialysis (post-HD weight)) and 95% confidence interval in the 104 weeks from the start of dialysis in female patients who survived >4 years. The left panels show estimates of the partially conditional means and the right panels show estimates of rate of change trajectories with 95% confidence intervals. (b) Mean IDWG (%) and 95% confidence interval in the 104 weeks from start of dialysis in male patients who survived >4 years.
Figure 8.
Mean pre-hemodialysis (pre-HD) systolic blood pressure (SBP) and 95% confidence interval. (a) Mean pre-hemodialysis (pre-HD) systolic blood pressure (SBP) and 95% confidence interval in the 104 weeks from the start of dialysis in female patients who survived >4 years. The left panels show estimates of the partially conditional means and the right panels show estimates of rate of change. (b) Mean pre-HD SBP and 95% confidence interval in the 104 weeks from the start of dialysis in male patients who survived >4 years.
Figure 9.
Mean C-reactive protein (CRP) and 95% confidence interval in the 104 weeks from the start of dialysis in patients who survived>4 years. The left panel shows estimates of the partially conditional means and the right panel shows estimates of rate of change.
Acknowledgments
We thank all the kidney centers in the different countries contributing to this analysis. We also thank Erika Schuh, Paola Carioni, Peter Kaufmann, Marzio Alunni, and Claudia Amato of the FMC Europe NephroCare Team for putting together the data from patients treated in FMC European countries.
PK and NWL hold stock in Fresenius Medical Care. The remaining authors declared no competing interests.
Footnotes
SUPPLEMENTARY MATERIAL
Supplementary Information: Supplementary information contains additional figures that separate dynamics of albumin, pre-dialysis systolic blood pressure (SBP), interdialytic weight gain (IDWG), and C-reactive protein (CRP) by causes of death (Supplementary Figures S1 to S4). We also present the dynamics of patients who survived versus those who died over the same vintage (Supplementary Figures S5 to S8).
Supplementary material is linked to the online version of the paper at http://www.nature.com/ki
Supplementary Material
References
- Himmelfarb J, Kliger AS. End-stage renal disease measures of quality. Annu Rev Med. 2007;58:387–399. doi: 10.1146/annurev.med.58.061705.151442. [DOI] [PubMed] [Google Scholar]
- Raimann JG, Usvyat LA, Thijssen S, et al. Blood pressure stability in hemodialysis patients confers a survival advantage: results from a large retrospective cohort study. Kidney Int. 2011;81:548–558. doi: 10.1038/ki.2011.426. [DOI] [PubMed] [Google Scholar]
- Li Z, Lacson E, Lowrie EG, et al. The epidemiology of systolic blood pressure and death risk in hemodialysis patients. Am J Kidney Dis. 2006;48:606–615. doi: 10.1053/j.ajkd.2006.07.005. [DOI] [PubMed] [Google Scholar]
- Kotanko P, Thijssen S, Usvyat L, et al. Temporal evolution of clinical parameters before death in dialysis patients: a new concept. Blood Purif. 2009;27:38–47. doi: 10.1159/000167007. [DOI] [PubMed] [Google Scholar]
- Yoshino M, Kuhlmann MK, Kotanko P, et al. International differences in dialysis mortality reflect background general population atherosclerotic cardiovascular mortality. J Am Soc Nephrol. 2006;17:3510–3519. doi: 10.1681/ASN.2006020156. [DOI] [PubMed] [Google Scholar]
- Pisoni RL, Greenwood RN. Selected lessons learned from the Dialysis Outcomes and Practice Patterns Study (DOPPS) Contrib Nephrol. 2005;149:58–68. doi: 10.1159/000085458. [DOI] [PubMed] [Google Scholar]
- Pifer TB, McCullough KP, Port FK, et al. Mortality risk in hemodialysis patients and changes in nutritional indicators: DOPPS. Kidney Int. 2002;62:2238–2245. doi: 10.1046/j.1523-1755.2002.00658.x. [DOI] [PubMed] [Google Scholar]
- Goodkin DA, Bragg-Gresham JL, Koenig KG, et al. Association of comorbid conditions and mortality in hemodialysis patients in Europe, Japan, and the United States: the Dialysis Outcomes and Practice Patterns Study (DOPPS) J Am Soc Nephrol. 2003;14:3270–3277. doi: 10.1097/01.asn.0000100127.54107.57. [DOI] [PubMed] [Google Scholar]
- Murtagh FE, Addington-Hall JM, Higginson IJ. End-stage renal disease: a new trajectory of functional decline in the last year of life. J Am Geriatr Soc. 2011;59:304–308. doi: 10.1111/j.1532-5415.2010.03248.x. [DOI] [PubMed] [Google Scholar]
- Gary Chan KC, Wang MC. Backward estimation of stochastic processes with failure events as time origins. Ann Appl Stat. 2010;4:1602–1620. doi: 10.1214/09-AOAS319. [DOI] [PMC free article] [PubMed] [Google Scholar]
- Rocco MV, Dwyer JT, Larive B, et al. The effect of dialysis dose and membrane flux on nutritional parameters in hemodialysis patients: results of the HEMO Study. Kidney Int. 2004;65:2321–2334. doi: 10.1111/j.1523-1755.2004.00647.x. [DOI] [PubMed] [Google Scholar]
- Lopez-Gomez JM, Villaverde M, Jofre R, et al. Interdialytic weight gain as a marker of blood pressure, nutrition, and survival in hemodialysis patients. Kidney Int Suppl. 2005;93:S63–S68. doi: 10.1111/j.1523-1755.2005.09314.x. [DOI] [PubMed] [Google Scholar]
- Kalantar-Zadeh K. What is so bad about reverse epidemiology anyway. Semin Dial. 2007;20:593–601. doi: 10.1111/j.1525-139X.2007.00360.x. [DOI] [PubMed] [Google Scholar]
- Kalantar-Zadeh K, Regidor DL, Kovesdy CP, et al. Fluid retention is associated with cardiovascular mortality in patients undergoing long-term hemodialysis. Circulation. 2009;119:671–679. doi: 10.1161/CIRCULATIONAHA.108.807362. [DOI] [PMC free article] [PubMed] [Google Scholar]
- Ozdogan O, Kayikcioglu M, Asci G, et al. Left atrial volume predicts mortality in low-risk dialysis population on long-term low-salt diet. Am Heart J. 2010;159:1089–1094. doi: 10.1016/j.ahj.2010.03.020. [DOI] [PubMed] [Google Scholar]
- Wizemann V, Wabel P, Chamney P, et al. The mortality risk of overhydration in haemodialysis patients. Nephrol Dial Transplant. 2009;24:1574–1579. doi: 10.1093/ndt/gfn707. [DOI] [PMC free article] [PubMed] [Google Scholar]
- Kaysen GA, Dubin JA, Muller HG, et al. Relationships among inflammation nutrition and physiologic mechanisms establishing albumin levels in hemodialysis patients. Kidney Int. 2002;61:2240–2249. doi: 10.1046/j.1523-1755.2002.00076.x. [DOI] [PubMed] [Google Scholar]
- Yeun JY, Levine RA, Mantadilok V, et al. C-reactive protein predicts all-cause and cardiovascular mortality in hemodialysis patients. Am J Kidney Dis. 2000;35:469–476. doi: 10.1016/s0272-6386(00)70200-9. [DOI] [PubMed] [Google Scholar]
- Owen WF, Lowrie EG. C-reactive protein as an outcome predictor for maintenance hemodialysis patients. Kidney Int. 1998;54:627–636. doi: 10.1046/j.1523-1755.1998.00032.x. [DOI] [PubMed] [Google Scholar]
- Lyratzopoulos G, McElduff P, Heller RF, et al. Comparative levels and time trends in blood pressure, total cholesterol, body mass index and smoking among Caucasian and South-Asian participants of a UK primary-care based cardiovascular risk factor screening programme. BMC Public Health. 2005;5:125. doi: 10.1186/1471-2458-5-125. [DOI] [PMC free article] [PubMed] [Google Scholar]
- Kelly TN, Hixson JE, Rao DC, et al. Genome-wide linkage and positional candidate gene study of blood pressure response to dietary potassium intervention: the genetic epidemiology network of salt sensitivity study. Circ Cardiovasc Genet. 2010;3:539–547. doi: 10.1161/CIRCGENETICS.110.940635. [DOI] [PMC free article] [PubMed] [Google Scholar]
- Yap IK, Brown IJ, Chan Q, et al. Metabolome-wide association study identifies multiple biomarkers that discriminate north and south Chinese populations at differing risks of cardiovascular disease: INTERMAP study. J Proteome Res. 2010;9:6647–6654. doi: 10.1021/pr100798r. [DOI] [PMC free article] [PubMed] [Google Scholar]
- Guinsburg A, Bayh I, Etter M, et al. Comparison of blood pressure patterns in incident hemodialysis patients: evaluation of dialysis data from 24 countries. Paper presented at: ERA-EDTAParis; 2012 [Google Scholar]
- Parekh RS, Plantinga LC, Kao WH, et al. The association of sudden cardiac death with inflammation and other traditional risk factors. Kidney Int. 2008;74:1335–1342. doi: 10.1038/ki.2008.449. [DOI] [PubMed] [Google Scholar]
- Clase CM, St Pierre MW, Churchill DN. Conversion between bromcresol green- and bromcresol purple-measured albumin in renal disease. Nephrol Dial Transplant. 2001;16:1925–1929. doi: 10.1093/ndt/16.9.1925. [DOI] [PubMed] [Google Scholar]
- Kurland BF, Heagerty PJ. Directly parameterized regression conditioning on being alive: analysis of longitudinal data truncated by deaths. Biostatistics. 2005;6:241–258. doi: 10.1093/biostatistics/kxi006. [DOI] [PubMed] [Google Scholar]
- Wang Y. Smoothing Splines: Methods and Applications. Champman and Hall: New York; 2011. [Google Scholar]
- R Development Core TeamR: A Language and Environment for Statistical Computing. R Foundation for Statistical Computing Vienna, Austria; 2009 [Google Scholar]
Associated Data
This section collects any data citations, data availability statements, or supplementary materials included in this article.


