Abstract
Purpose
We investigate the prevalence and degree of macular thinning on optical coherence tomography (SDOCT) in African American female patients with asymptomatic sickle cell disease.
Design
Prospective comparative case series
Methods
Twenty one sickle cell patients (42 eyes) without other systemic or ocular diseases and 18 healthy control patients (33 eyes) underwent SDOCT. Images were manually segmented to measure inner retinal thickness (IRT) and outer retinal thickness (ORT). Central macula (central 1mm), parafoveal (0.5–1.5mm eccentricity), and perifoveal (1.5–3mm eccentricity) thickness measurements were obtained in sickle cell patients and age/gender/race-matched healthy control subjects.
Results
Central macular total thickness (CMT) in sickle cell patients was 220 +/− 3μm (mean +/−SEM), which was significantly lower (p< 0.05) than controls (228 +/− 3μm). Parafoveal regions had thickness measurements of 314 +/− 5μm (nasal) and 304 +/− 2μm (temporal), which were significantly lower than controls (327 +/− 2μm and 311 +/− 2μm nasally and temporally, respectively) (p< 0.03, p< 0.043). There was also no significant difference in IRT in central macular, para- and perifoveal regions. Central macular ORT was 175 +/− 2μm versus 185 +/− 1μm in controls (p< 0.0002). ORT in temporal para- and perifoveal regions were 142 +/− 2μm and 120 +/−1μm, respectively versus 150 +/− 1μm and 122 +/− 1μm in controls (p< 0.001 and p=0.16, respectively).
Conclusions
Manual segmentation of SDOCT images revealed significant total retinal thinning in the central macula and splaying in asymptomatic sickle cell patients. Retinal thinning was predominately in outer retinal layers in central macula and parafoveal regions.
Introduction
Patients with sickle cell disease (SCD) suffer from manifestations of vascular occlusions in various parts of their body, including the retina. Non-proliferative (background) and proliferative vascular changes occur in sickle cell patients due to intravascular sickling, hemolysis, hemostasis and thrombosis in arterioles and capillaries.1 Sickle cell retinopathy can progress from a non-proliferative form in which the predominant pathology is arteriolar occlusions in the retinal periphery, to formation of arteriovenous anastomoses and to proliferative retinopathy with neovascularization, that can lead to vision-threatening hemorrhages and retinal detachment.2
Although pathology in sickle cell retinopathy is predominantly in the retinal periphery, there are also changes in the macular region. Macular infarctions due to SCD has been documented using fluorescein angiography (FA), electroretinography and histopathology.3–5 Previous case reports of individual sickle cell patients with visually-symptomatic macular infarctions examined with time-domain optical coherence tomography (OCT)6 and ultra-high resolution OCT7 suggest involvement of one of the inner retinal layers, sparing the photoreceptors and retinal pigment epithelium (RPE) layers. Additionally, in FA studies, the foveal avascular zone (FAZ) was shown to be enlarged in SCD patients, with no significant difference in FAZ diameter with respect to stage of retinopathy, type of hemoglobinopathy or visual acuity.8
Moreover, studies establishing normative data in healthy control patients have demonstrated that, in terms of central subfield (CSF) thickness, the central macula is significantly less thick in African Americans and females than in Caucasians and males using the Stratus OCT9 and Spectralis spectral-domain OCT (SDOCT).10 In the current study, the SDOCT and manual segmentation of images was utilizied to compare thickness of retinal layers in patients at various stages of sickle cell retinopathy and age-, gender- and race-matched healthy subjects.
Methods
Patient selection
Twenty one African American female sickle cell patients (42 eyes) without history of ocular disease, aside from refractive error or sickle cell retinopathy, and 18 African American female healthy control subjects (33 eyes) without clinical evidence of maculopathy by ophthalmic examination participated in the study. The ages and diagnoses of patients are listed in Table 1. The average age of sickle cell patients (30 +/− 2 years) was comparable to the control subjects (34 +/− 2 years) (p = 0.20). Initial evaluation included best corrected visual acuity (BCVA) testing, applanation tonometry, slit-lamp biomicroscopy and fundus examination. Exclusion criteria for control subjects included BCVA < 20/20, diagnosis of ocular disease, clinical evidence of maculopathy, hypertension and/or diabetes. Informed consent was obtained and subjects underwent SDOCT imaging using a commercially available instrument (Spectralis, Heidelberg Engineering, Germany). Nineteen to thirty-one horizontal OCT scans were generated. The central foveal OCT scan was then selected for analysis.
Table 1.
Patient demographics depicting age, sex, race, hemoglobin type and stage of sickle cell retinopathy in the right (OD) and left eye (OS)a
| Age | Race/Gender | Hgb Type | OD | OS |
|---|---|---|---|---|
| 18 yo | AAF | SC | Stage 2 | Stage 2 |
| 19 yo | AAF | SThal | Stage 3 | Stage 2 |
| 22 yo | AAF | SS | Stage 2 | Stage 2 |
| 22 yo | AAF | SC | Stage 2 | Stage 2 |
| 23 yo | AAF | SS | Stage 2 | Stage 2 |
| 23 yo | AAF | SS | Stage 2 | Stage 2 |
| 23 yo | AAF | SS | none | none |
| 24 yo | AAF | SS | Stage 1 | none |
| 25 yo | AAF | SC | Stage 1 | none |
| 27 yo | AAF | SS | Stage 2 | Stage 2 |
| 27 yo | AAF | SS | Stage 1 | Stage 1 |
| 28 yo | AAF | SS | Stage 1 | Stage 2 |
| 28 yo | AAF | SS | Stage 2 | Stage 1 |
| 28 yo | AAF | SThal | none | none |
| 32 yo | AAF | SS | Stage 1 | Stage 1 |
| 37 yo | AAF | SC | Stage 2 | Stage 2 |
| 40 yo | AAF | SC | Stage 2 | Stage 2 |
| 40 yo | AAF | SC | Stage 1 | Stage 2 |
| 43 yo | AAF | SS | Stage 2 | Stage 1 |
| 49 yo | AAF | SS | Stage 4 | Stage 2 |
| 51 yo | AAF | SC | Stage 3 | Stage 4 |
Hgb = hemoglobin. AA = African American. F = female. yo = year-old. Sickle Hgb types listed are: SC, SS and SThalassemia (SThal).
Analysis
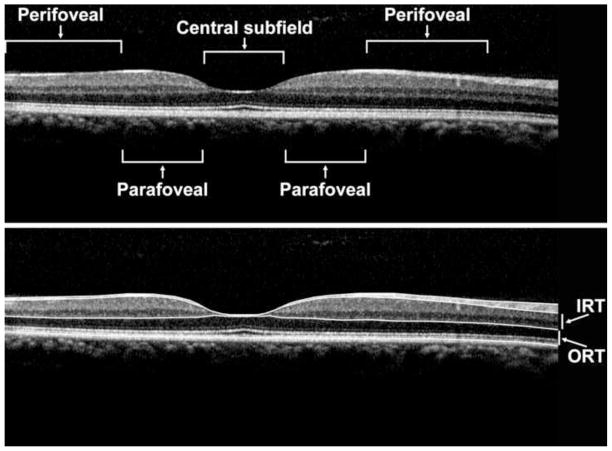
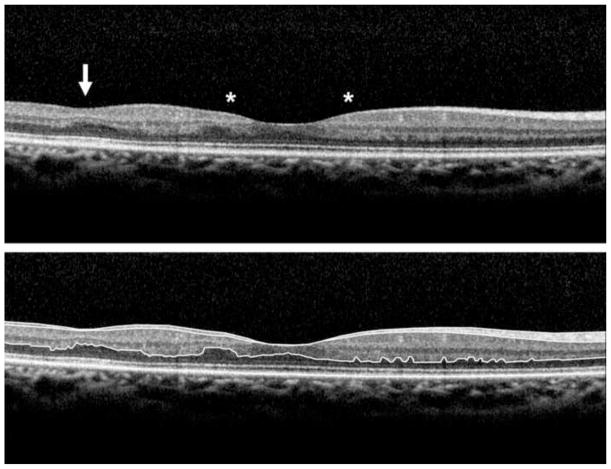
For quantitative analysis of retinal thickness, boundary lines were manually drawn by one observer (QVH) in a blind manner, using image processing software (ImageJ, Bethesda, Maryland) to segment retinal layers. Boundary lines were drawn at the internal limiting membrane (ILM), posterior boundary of the retinal nerve fiber layer (NFL), posterior boundary of outer plexiform layer (OPL) and at the neural RPE interface. Examples of OCT scans displaying boundary lines in a control subject and SCD patient are shown in Figures 1 and 2, respectively. A dedicated software program developed in Matlab (The Mathworks Inc, Natick, Massachusetts, USA) was utilized to provide automated measurements of inner retinal thickness (IRT: posterior NFL to posterior OPL) and outer retinal thickness (ORT: posterior OPL to RPE interface) based on the depth separation between boundary lines. Thickness profiles were generated from measurements obtained at 100-μm intervals laterally along OCT scans and then aligned based on the minimum IRT at the fovea center. Thickness was averaged among the central subfield macula (1 mm diameter, centered on fovea), parafoveal (0.5 to 1.5 mm eccentricity, nasally or temporally) and perifoveal (1.5 mm to 3 mm eccentricity, nasally or temporally) regions. An unpaired t-test was performed to compare measurements in SCD patients and control subjects. Significance was accepted at p-values less than 0.05.
Figure 1.
Spectralis OCT scan of a healthy control patient (Top Panel) displaying manually drawn boundary lines (Bottom Panel), at the inner limiting membrane (ILM), posterior nerve fiber layer (NFL), posterior outer plexiform layer (OPL) and at the retinal pigment epithelium (RPE) interface. The inner retinal thickness (IRT) and outer retinal thickness (ORT) are as labeled. The central subfield (central 1 mm diameter), parafoveal region (0.5 to 1.5 mm eccentricity) and perifoveal region (1.5 mm to 3 mm eccentricity) are labeled (Top Panel).
Figure 2.
Spectralis OCT scan of a sickle cell patient (Top Panel) displaying manually drawn boundary lines (Bottom Panel). Note the presence of foveal splaying (outlined by asterisks) as well as focal thinning in the temporal macula (arrow).
Results
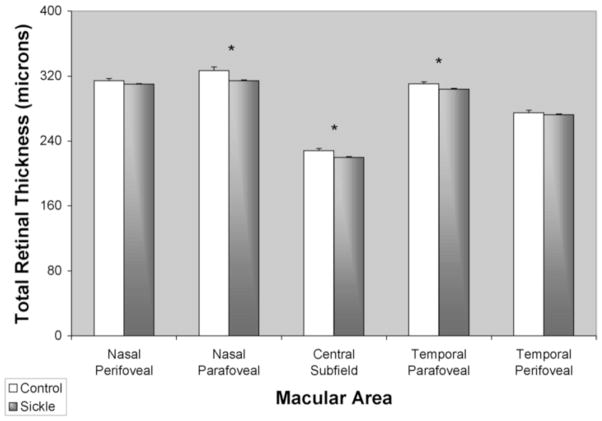
A comparison of mean central total macular thickness (CMT, central 1 mm) in sickle cell patients and control subjects is shown in Figure 3. CMT was 220 +/− 3 μm (mean +/− standard error of the mean (SEM)), significantly lower than controls (228 +/− 3 μm) (p < 0.05). Parafoveal regions (between 0.5 to 1.5 mm eccentricity) had thickness measurements of 314 +/− 5 μm and 304 +/− 2 μm at nasal and temporal regions, respectively, which were significantly lower than controls (327 +/− 2 μm (nasal) and 311 +/− 2 μm (temporal)) (p < 0.03 and p < 0.045, respectively).
Figure 3.
Mean total retinal thickness in healthy control subjects (white bar) and sickle cell patients (gray bar). Thickness was averaged among the central subfield (central 1mm diameter), parafoveal (0.5 to 1.5 mm eccentricity) and perifoveal (1.5 mm to 3 mm eccentricity) regions. Error bars represent standard error of the means. (*) denotes p < 0.05.
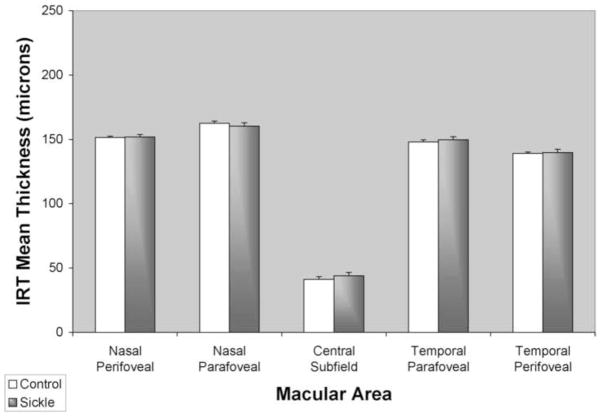
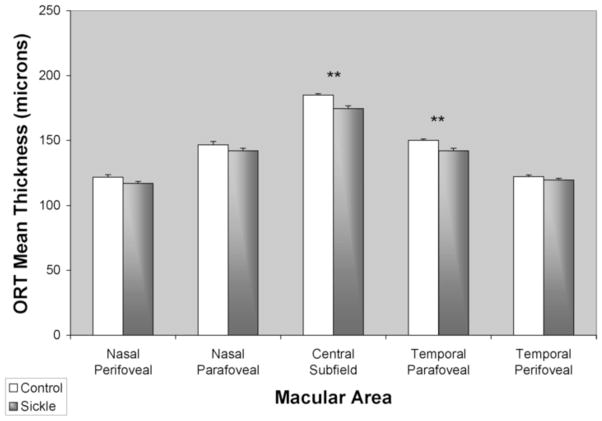
Comparisons of mean IRT and ORT in sickle cell patients and control subjects are shown in Figures 4 and 5, respectively. Central macular IRT was 44 +/− 3 μm in sickle cell patients and did not differ significantly from controls (41 +/− 2 μm) (p = 0.46). There was also no significant difference in IRT in para- and perifoveal regions (p > 0.10). Central macular ORT in sickle cell patients was 175 +/− 2 μm and significantly lower than in controls (185 +/− 1 μm) (p < 0.0002). Temporal para- and perifoveal regions ORT in sickle cell patients were 142 +/− 2 μm and 120 +/−1 μm, respectively, and significantly lower than in controls in the parafoveal region (150 +/− 1 μm, p < 0.001), but not in the perifoveal region (122 +/− 1 μm, p = 0.16).
Figure 4.
Mean inner retinal thickness (IRT) in healthy control subjects (white bar) and sickle cell patients (gray bar). Thickness was averaged among the central subfield (central 1 mm diameter), parafoveal (0.5 to 3 mm eccentricity) and perifoveal (3 mm to 6mm eccentricity) regions. Error bars represent standard error of the means.
Figure 5.
Mean outer retinal thickness (ORT) in healthy control subjects (white bar) and sickle cell patients (gray bar). Thickness was averaged among the central subfield (central 1mm diameter), parafoveal (0.5 to 3 mm eccentricity) and perifoveal (3 mm to 6 mm eccentricity) regions. Error bars represent standard error of the means. (**) denotes p < 0.01.
Discussion
Patients with SCD suffer from manifestations of vascular occlusions in retinal tissue. Sickle cell retinopathy is known to cause retinal pathologies predominantly in the retinal periphery, but can also cause macular infarctions. These changes may cause changes in the thickness of retinal layers in the macula and reduce vision. To our knowledge, segmentation analysis of the alteration in the macular thickness in SCD retinopathy has not been reported. In the current study, thickness of the inner and outer retinal layers were measured in the central macula, para- and perifoveal regions in SCD retinopathy patients by manual segmentation of SDOCT images. Since retinal thickness variations among subjects of different races have been previously reported,10 thickness measurements in SCD patients were compared to age- race- and gender-matched control subjects. Total retinal thinning in the central macula and splaying was demonstrated in asymptomatic sickle cell patients. Thinning of outer retina layers in the central macula and temporal parafoveal regions were also present.
Central macular thinning and foveal splaying
Central macular thinning and foveal splaying (due to thinning specifically in the parafoveal regions) may represent either the residua of, or the precursor to macular infarctions. In the present study, ORT in asymptomatic sickle cell patients was found to be only 10 microns lower than controls, which was statistically significant, but may not be clinically evident. This may favor the notion that these changes are related to subclinical macular infarctions.
Although patients with central macular thinning may remain asymptomatic, the presence of central macular splaying/focal thinning may be indicative of ischemia due to vascular occlusions in the capillaries surrounding the fovea, as has been reported by enlargement of FAZ in SCD patients.8 Due to the disease process, ischemia likely occurs both in the central and peripheral retinal regions. However, detection of peripheral retinal ischemia and neovascularization can be difficult and missed on clinical exam. Additionally, peripheral vascular changes are not readily captured by conventional fluorescein angiography (FA) that is focused within the central 50-degrees. Since measurement of FAZ may be inaccurate due to image quality, alternatively, the presence of foveal thinning may serve as a screening tool to identify patients who would benefit from examination of the retinal periphery, either clinically or with wide field FA. Future studies are needed to relate foveal thinning, enlargement of FAZ, and peripheral retinal vasculopathy in SCD.
Thinning of the outer retina
Histopathologic studies of sickle cell retinopathy have shown selective atrophy of the inner retinal layers after macular infarction.12,13 Although, previous case reports of individual sickle cell patients with visually-symptomatic macular infarction examined with time-domain OCT6 and ultra-high resolution OCT7 suggested involvement of inner retinal layers, to our knowledge, retinal thickness abnormalities in a group of subjects with asymptomatic SCD have not been investigated. The results of the current study demonstrated outer retinal thickness abnormalities underlying total retinal thickness changes. This finding suggests that despite being of larger caliber, the choriocapillaris that supplies oxygen and nutrients to the outer retina appears to be more prone to occlusions than retinal capillaries, supplying the inner retina. Qualitative evaluation of SDOCT images revealed no evidence of photoreceptor loss based on photoreceptor inner/outer segment interface continuity, suggesting subclinical thickness changes. The presence of thinning in the temporal, but not nasal retina may be due to the fact that this is a watershed area between the vascular arcades of the retinal circulation, that would be more susceptible to vascular occlusions. Outer retinal thinning may be a marker that would prompt more aggressive systemic management of sickle cell disease.
In summary, manual segmentation of SDOCT images from African American females subjects with asymptomatic SCD revealed subclinical central macular thinning and foveal splaying as compared to age-, race- and gender-matched healthy controls. There was also significant thinning of the outer retina, most prominent in the central subfield and temporal parafoveal regions. Future studies are needed to establish the utility of assessment of thickness alterations in the central macula on SDOCT images for screening of peripheral retinal pathologies in patients with SCD.
Acknowledgments
Financial support from NIH grants EY14275 (MS) and EY01792 (UIC), Bethesda, Maryland; Department of Veterans Affairs, Washington, DC, a senior scientific investigator award (MS) and an unrestricted departmental grant from Research to Prevent Blindness, Inc., New York, NY, Charles I. Young Ocular Research Fund, Marion H. Schenk, Esq., Research Fund for the Aging Eye and the Gerhard Cless Retina Research Fund (JIL). The funding organizations had no role in the design or conduct of this research.
Biography
 Quan (Donny) Hoang, is a graduate of Northwestern University with majors in chemistry, biology and integrated science. He received his Ph.D. and M.D. in 2006 from the University of Illinois at Chicago. His graduate research focused on the ionic and signal transduction mechanisms of sleep and arousal. He completed ophthalmology residency at the Illinois Eye and Ear Infirmary and is currently a Vitreo-Retinal Surgery fellow at Columbia University/Vitreous-Retina-Macula Consultants of NY in New York, NY.
Footnotes
Contributions of Authors: Design of the study (FYC, JIL, QVH); Conduct of the study (FYC, JIL, QVH), Collection, management and interpretation of data (FYC, JIL, QVH), Analysis of data (MS, QVH) and Preparation, review and approval of manuscript (FYC, JIL, MS, QVH). The University of Illinois at Chicago Institutional Review Board (IRB) approval was obtained. Informed consent was obtained from all subjects before study procedures were carried out for this HIPAA-compliant prospective, unmasked, comparative case series. All research adhered to the tenets of the Declaration of Helsinki.
Disclosure
Financial disclosures include honoraria received for participation in Heidelberg symposium (JIL).
Publisher's Disclaimer: This is a PDF file of an unedited manuscript that has been accepted for publication. As a service to our customers we are providing this early version of the manuscript. The manuscript will undergo copyediting, typesetting, and review of the resulting proof before it is published in its final citable form. Please note that during the production process errors may be discovered which could affect the content, and all legal disclaimers that apply to the journal pertain.
References
- 1.Nagpal KC, Goldberg MF, Rabb MF. Ocular manifestations of sickle hemoglobinopathies. Surv Ophthalmol. 1977;21(5):391–411. doi: 10.1016/0039-6257(77)90042-x. [DOI] [PubMed] [Google Scholar]
- 2.Goldberg MF. Classification and pathogenesis of proliferative sickle retinopathy. Am J Ophthalmol. 1971;71(3):649–65. doi: 10.1016/0002-9394(71)90429-6. [DOI] [PubMed] [Google Scholar]
- 3.Knapp JW. Isolated macular infarction in sickle cell (SS) disease. Am J Ophthalmol. 1972;73(6):857–9. doi: 10.1016/0002-9394(72)90452-7. [DOI] [PubMed] [Google Scholar]
- 4.Acacio I, Goldberg MF. Peripapillary and macular vessel occlusions in sickle cell anemia. Am J Ophthalmol. 1973;75(5):861–6. doi: 10.1016/0002-9394(73)90892-1. [DOI] [PubMed] [Google Scholar]
- 5.Romayanada N, Goldberg MF, Green WR. Histopathology of sickle cell retinopathy. Trans Am Acad Ophthalmol Otolaryngol. 1973;77(5):OP642–76. [PubMed] [Google Scholar]
- 6.Shakoor A, Blair NP, Shahidi M. Imaging retinal depression sign in sickle cell anemia using optical coherence tomography and the retinal thickness analyzer. Arch Ophthalmol. 2005;123(9):1278–9. doi: 10.1001/archopht.123.9.1278. [DOI] [PubMed] [Google Scholar]
- 7.Witkin AJ, Rogers AH, Ko TH, Fujimoto JG, Schuman JS, Duker JS. Optical coherence tomography demonstration of macular infarction in sickle cell retinopathy. Arch Ophthalmol. 2006;124(5):746–7. doi: 10.1001/archopht.124.5.746. [DOI] [PMC free article] [PubMed] [Google Scholar]
- 8.Sanders RJ, Brown GC, Rosenstein RB, Magargal L. Foveal avascular zone diameter and sickle cell disease. Arch Ophthalmol. 1991 Jun;109(6):812–5. doi: 10.1001/archopht.1991.01080060076029. [DOI] [PubMed] [Google Scholar]
- 9.Kelty PJ, Payne JF, Trivedi RH, Kelty J, Bowie EM, Burger BM. Macular thickness assessment in healthy eyes based on ethnicity using Stratus OCT optical coherence tomography. Invest Ophthalmol Vis Sci. 2008;49(6):2668–72. doi: 10.1167/iovs.07-1000. [DOI] [PubMed] [Google Scholar]
- 10.Grover S, Murthy RK, Brar VS, Chalam KV. Normative data for macular thickness by high-definition spectral-domain optical coherence tomography (spectralis) Am J Ophthalmol. 2009;148(2):266–71. doi: 10.1016/j.ajo.2009.03.006. [DOI] [PubMed] [Google Scholar]
- 11.Cusick M, Toma HS, Hwang TS, Brown JC, Miller NR, Adams NA. Binasal visual field defects from simultaneous bilateral retinal infarctions in sickle cell disease. Am J Ophthalmol. 2007;143(5):893–6. doi: 10.1016/j.ajo.2006.12.002. [DOI] [PubMed] [Google Scholar]
- 12.Gass JDM. Stereoscopic Atlas of Macular Diseases: Diagnosis and Treatment. 4. St. Louis, Mo: Mosby-Year Book Inc; 1997. pp. 530–34. [Google Scholar]
- 13.Foos RY. Regional ischemic infarcts of the retina. Albrecht Von Graefes Arch Klin Exp Ophthalmol. 1976;200(3):183–94. doi: 10.1007/BF01028533. [DOI] [PubMed] [Google Scholar]


