

Abstract
Long-acting injectable nanoformulated antiretroviral therapy (nanoART) was developed with the explicit goal of improving medicine compliance and for drug targeting of viral tissue reservoirs. Prior nanoART studies completed in humanized virus-infected mice demonstrated sustained antiretroviral responses. However, the pharmacokinetics (PK) and tissue distribution of nanoART were not characterized. To this end, the PK and tissue distribution of nanoformulated atazanavir (ATV) and ritonavir (RTV) injected subcutaneously or intramuscularly in mice and monkeys were evaluated. Fourteen days after injection, ATV and RTV levels were up to 13-, 41-, and 4,500-fold higher than those resulting from native-drug administration in plasma, tissues, and at the site of injection, respectively. At nanoART doses of 10, 50, 100, and 250 mg/kg of body weight, relationships of more- and less-than-proportional increases in plasma and tissue levels with dose increases were demonstrated with ATV and RTV. Multiple-dose regimens showed serum and tissue concentrations up to 270-fold higher than native-drug concentrations throughout 8 weeks of study. Importantly, nanoART was localized in nonlysosomal compartments in tissue macrophages, creating intracellular depot sites. Reflective data were obtained in representative rhesus macaque studies. We conclude that nanoART demonstrates blood and tissue antiretroviral drug levels that are enhanced compared to those of native drugs. The sustained and enhanced PK profile of nanoART is, at least in part, the result of the sustained release of ATV and RTV from tissue macrophases and at the site of injection.
INTRODUCTION
The development of effective antiretroviral therapy (ART) has transformed human immunodeficiency virus (HIV) disease into a long-term and manageable disorder (1). Infected patients can live well past their fifth, sixth, and seventh decades of life (2). The shortcomings for ART are, notably, associated with viral resistance and rebounds that may occur despite long periods of undetectable virus in blood (3). This can occur despite the presence of therapeutic plasma drug levels, which is attributed to activation of latent virus hidden in anatomical and intracellular reservoirs (4). As ART regimens are commonly ineffective in reaching viral sanctuaries, viral replication occurs continuously at low levels as a result of ineffective antiretroviral penetrance into viral reservoirs, including the lymphoid and central nervous system reservoirs (5), which allows HIV to circumvent eradication (6, 7). Thus, lifelong treatment is needed in order to suppress the virus and to enable the patient to remain clinically asymptomatic (8).
Patients' compliance with medication intake regimens plays yet another crucial role for disease management (9), which becomes even more challenging with complex ART regimens that require long-term adherence for often substantial pill burdens (10). Drug regimen compliance has also been identified as a critical risk factor for viral resistance (11, 12). In attempts to overcome such limitations, long-acting nanoformulated ART (nanoART) was developed to achieve steady-state drug levels with infrequent dosing (13, 14). Moreover, as HIV-infected individuals serve as vehicles for viral transmission, long-acting formulations could also serve to decrease viral spread (15, 16). As ART leads to a spectrum of toxicities and drug-drug interactions causing added disease morbidities, these may be overcome by improved viral suppression and reduced toxicities through nanoART (17).
While previous reports demonstrated that mononuclear phagocytes (MP; monocytes and macrophages) can act as reservoirs and transporters of HIV-1, these cells could also potentially serve to facilitate drug uptake and transport and release of nanoART (18–21). Using MP cell culture systems, it was shown that uptake and release of nanoART into and from monocyte-derived macrophages (MDM) are sustained at levels equal to or beyond the 50% effective concentrations (EC50) with limited cytotoxicity (22). This was achieved after optimizing the shape, size, and charge of the nanoparticles for cell entry and release of two commonly administered protease inhibitors, atazanavir (ATV) and ritonavir (RTV) (23, 24). After passing in vitro screening, ATV and RTV nanoformulations were selected for in vivo pharmacokinetic (PK) studies (13). While the pilot efficacy studies in humanized virus-infected mice demonstrated effective and sustained antiretroviral responses, information on dosing regimens and tissue and cell biodistributions remained incomplete (13, 14, 25). Therefore, we characterized the pharmacokinetics and biodistribution of nanoART in mice and in monkeys after subcutaneous (SC) administration. Results showed clear improvements in the PK profile over native (unformulated) drug at various dosing regimens. Intracellular nanoART reservoirs associated with endosomal MP compartments (23) in tissues paralleled what had previously been demonstrated in in vitro studies (18) and resulted in sustained and enhanced systemic drug levels in vivo. These preclinical studies may further enable the development of nanoART for clinical intervention (26, 27). Such formulations would provide advantages in PK properties and patient compliance over what is now established by conventional native-drug regimens (9).
MATERIALS AND METHODS
Chemicals.
Free base RTV was obtained from Shengda Pharmaceutical Co. (Zhejiang, China). ATV sulfate was purchased from Gyma Laboratories of America Inc. (Westbury, NY). Lopinavir (LPV) was purchased from Toronto Research Chemicals Inc. (North York, Ontario, Canada). High performance liquid chromatography (HPLC)-grade methanol, acetonitrile, ammonium acetate, acetic acid, propylene glycol, and phosphate-buffered saline (PBS) (1×) were obtained from Fisher Scientific (Fair Lawn, NJ). Isoflurane was obtained from Halocarbon Product Corporation (River Edge, NJ). BD insulin syringes (28 gauge, 1/2-in. needle) were obtained from Becton, Dickinson and Company (Franklin Lakes, NJ). Cremophor EL, poloxamer 188 (P188), and CF633 succinimidyl ester (CF633) were obtained from Sigma-Aldrich (St. Louis, MO) and ethyl alcohol from Acros Organics.
Preparation and characterization of nanoART.
NanoART RTV and ATV were prepared with polymer excipients by high-pressure homogenization as described previously (28). These formulations consisted of crystalline drug surrounded by a thin layer of a P188 surfactant (29). Drug loading was analyzed by high performance liquid chromatography (HPLC-UV) (11) and by ultraperformance liquid chromatography tandem mass spectrometry (UPLC-MS/MS) (30). These formulations were screened for cell uptake, retention, and release and antiretroviral activity using human monocyte-derived macrophages as described previously (18, 22, 28).
Mouse studies.
Eight-week-old, healthy male BALB/c mice were purchased from Charles River Laboratories (Wilmington, MA). Sterilized 7012 Teklad diets (Harlan, Madison, WI) were used for mice, and water was provided ad libitum. Mice were housed in the University of Nebraska Medical Center (UNMC) laboratory animal facility according to the American Animal Association and Laboratory Animal Care guidelines. All procedures were approved by the Institutional Animal Care and Use Committee at UNMC as set forth by the National Institutes of Health (NIH).
(i) Acute single- and multiple-dose administration.
Acute single- and multiple-dose PK studies were performed in mice at 10 mg/kg of either nanoART or native (unformulated) ATV and RTV. ATV and RTV nanoART were manufactured separately, and the two formulations were mixed together before administration to animals. The acute-dose study encompassed single-dose (day 0) and three-dose (day 0, 3, and 7) administration. Mice receiving the single dose were sacrificed on day 1 and day 14, whereas mice receiving the three doses were sacrificed on day 7 (before the administration of the third dose on day 7) and on day 14. Each group consisted of five mice. NanoART doses were suspended in phosphate-buffered saline (PBS), and the native-drug doses were suspended in a mixture of ethanol-Cremophor EL-propylene glycol-water (43–5–20–32 [vol/vol]). The injection volume was 125 μl for both nanoART and native drug. Blood samples were collected at 0.5, 1, 2, 4, and 8 h and days 1, 2, 3, 7, 10, and 14. Tissue samples of liver, kidneys, spleen, lungs, brain, and skin from the site of injection (∼100 mg) were collected on days 1, 7, and 14.
In addition, dose-escalation studies were performed at 10, 50, 100, and 250 mg/kg nanoART with designs of dose administration and sample collection equivalent to those described above for the acute multiple-dose study.
(ii) Chronic-dose administration.
The chronic PK studies were performed at 50 mg/kg nanoART or native (unformulated) drugs. Eight groups of mice (n = 6) were dosed with either nanoART or native drugs (eight doses each) on days 0, 3, 7, 14, 21, 28, 35, and 42 (3 doses in the first week followed by weekly dosing for another 5 weeks) over a period of 6 weeks. Blood samples were collected on days 1, 3, 7, 8, 10, 14, 15, 17, 21, 22, 24, 28, 29, 31, 35, 36, 38, 42, 43, 45, 49, 50, 52, and 56. Every week, one group of mice from each arm of the study was sacrificed and tissues (including liver, kidneys, spleen, lung, brain, and skin from the site of injection) were collected. After dosing, mice were returned to their home cages, and cage-side observation was performed on the day of dosing and at least daily for the remainder of the study.
Monkey studies.
Rhesus macaques were purchased from PrimGen (Hines, IL) and tested negative for simian immunodeficiency virus (SIV), simian type D retrovirus (SRV), and Cercopithecine herpesvirus 1 virus. All protocols and procedures were performed with the approval of the Institutional Animal Care and Use Committee at UNMC following NIH guidelines.
Rhesus macaques were used as a nonhuman primate model. Animals were anesthetized with 10 mg/kg ketamine, administered intramuscularly (IM), prior to experimental procedures and bleeding. Blood was drawn from the femoral vein, and plasma was obtained by centrifugation of EDTA-treated blood. Pharmacokinetic studies were performed at 50 mg/kg dose of nanoART in animals weighing 3.5 kg (n = 2). Prior to injection, 10 mg/ml nanoART was suspended in sterile PBS. NanoART was injected as an SC bolus into the nape of the neck. One monkey was given a single dose of 50 mg/kg nanoART (day 0), while a second monkey was given three doses (days 0, 3, and 7) of 50 mg/kg nanoART.
Blood and tissue collection.
For mice, blood samples (100 μl) were collected from the facial vein using a sterile 0.5-mm goldenrod animal lancet (MEDIpoint, Inc., Mineola, NY). Blood drops were collected into serum separator tubes (BD Microtainer Tubes). Serum was separated by centrifugation of blood samples at 1,500 × g for 10 min at 4°C within 1 h of sample collection and stored at −80°C until analysis. Tissue samples were stored at −80°C until analysis by LC-MS/MS. For monkeys, blood samples were collected from the femoral vein using a 21-gauge syringe into an EDTA-treated tube on days 3, 7, 10, 14, and 38 after dose administration. Plasma was separated by centrifugation at room temperature for 20 min at 900 × g and stored at −80°C until analysis by LC-MS/MS.
Sample preparation and analysis.
Serum, plasma, and tissue sample preparation and analysis were performed as previously described (30). Briefly, about 100 mg of the tissue of interest was homogenized in deionized H2O (1:4 [wt/vol]). A 1-ml volume of ice-cold acetonitrile was added to 100 μl serum or tissue homogenate samples prespiked with 10 μl internal standard (IS; 2.0 μg/ml lopinavir, 200 ng/ml final concentration). Samples were vortexed for 3 min, shaken continuously for 15 min, and centrifuged at 16,000 × g for 10 min. The supernatant was aspirated, evaporated under vacuum at room temperature, reconstituted in 100 μl of 50% methanol in H2O, and sonicated for 5 min. After centrifugation at 16,000 × g for 10 min, 10 μl of each sample was used for LC-MS/MS analysis using a Waters Acquity UPLC system (Waters, Milford, MA) coupled to an Applied Biosystems 4000 QTRAP (hybrid quadrupole ion trap) mass spectrometer (Applied Biosystems, Foster City, CA). For drug analysis in isolated liver cells, each cell fraction was suspended in H2O added to reach to a final cell concentration of 10 million/ml. A 100-μl aliquot of each cell suspension prespiked with 10 μl internal standard was extracted as described for serum.
Pharmacokinetic analysis.
Mean serum drug concentrations were calculated per treatment group for different doses. The PK parameters were derived using noncompartmental analysis of averaged serum concentration versus time profiles using the WinNonlin Professional software (version 5.1). Peak serum concentration (Cmax), time to reach Cmax (Tmax), and area under the serum concentration versus time curve (AUC [expressed as ng · h/ml]) were calculated. Mean tissue concentrations were calculated and expressed as ng/g tissue.
NanoART cell localization studies. (i) Labeling nanoformulations.
CF633-labeled P188 was synthesized for the preparation of fluorescence-labeled nanoART. Briefly, P188 was activated with an 8-fold molar ratio of p-toluenesulfonyl chloride in dichloromethane (DCM; Acros Organics-Thermo Fisher Scientific, Waltham, MA) at room temperature and purified by ether precipitation. The tosylated product was converted to azido-P188 by incubation with a 6-fold molar ratio of sodium azide in N,N-dimethylformamide (Sigma-Aldrich) at 100°C for 6 h and purification with DCM-saline solution extraction. Azido-P188 was then reduced to amine-P188 using a 4-fold molar ratio of triphenylphosphine in tetrahydrofuran at room temperature and purified by ether precipitation. Polymers from all steps were further purified using a Sephadex LH-20 column (GE Healthcare, Waukesha, WI) before the next reaction step. Finally, amine-P188 was reacted with the succinimidyl ester of CF633 in dimethyl sulfoxide at room temperature. The crude product was purified with a Sephadex LH-20 column to remove free CF633. A mixture consisting of 30% CF633-labeled P188 and 70% P188 was used to manufacture fluorescence-labeled nanoART using high-pressure homogenization as described previously (28).
(ii) Animals, liver cell isolations, and flow cytometric tests.
Eight-week-old male BALB/cJ mice (Jackson Laboratory, Bar Harbor, ME) were dosed with 250 mg/kg ATV and RTV as CF633-labeled nanoART by SC injection. Twenty-four hours later, liver cells were isolated by in situ collagenase perfusion of mouse liver using a modification of previously published methods (31–33). Isolated cells were dispersed and washed in Krebs-Ringer bicarbonate buffer (Sigma-Aldrich) containing 100 mM HEPES (KRH), 2 mM Ca++, and 2% bovine serum albumin (BSA). Hepatocytes were separated from nonparenchymal cells by centrifugation at 50 × g for 5 min. The resulting cell pellet was resuspended in KRH–2 mM Ca++–2% BSA. The cells were counted, and viability was determined by trypan blue exclusion. Drug content in the cells was determined using LC-MS/MS. The 50 × g supernatant was centrifuged at 600 × g for 5 min, and the resulting cell pellet was resuspended in 1 ml KRH–2 mM Ca++–2% BSA. The cells were counted, and viability was determined by trypan blue exclusion. The cell suspension was centrifuged at 400 × g for 5 min and the pellet resuspended in 100 μl MACS buffer (0.5% BSA and 2 mM EDTA in PBS). Cells were incubated with 10 μl mouse CD11b MicroBeads per 106 cells (Miltenyi Biotec Inc., Auburn, CA) for 15 min at 4°C followed by 10 μl of CD11b-PE (Miltenyi Biotec Inc.) for 15 min at 4°C. Cells were washed with buffer by centrifugation at 300 × g for 10 min and resuspended in 1 ml MACS buffer. CD11b-positive cells were selected using a MACS LS column and autoMACS Separator (Miltenyi Biotec Inc.). Drug content in CD11b-positive (CD11b+) and CD11b-negative cells was determined using LC-MS/MS. Colocalization of CD11b-PE antibody and CF633-labeled nanoART was determined following MACS column CD11b+ selection using a fluorescence-activated cell sorter (FACS) Diva system (BD Immunocytometry Systems, Mountain View, CA). The percentages of CD11b+ and CF633-positive cells were determined from the gate set on viable cells.
(iii) Confocal microscopy.
CD11b+ selected cells were imaged using confocal microscopy to visualize colocalization of CF633-nanoART and CD11b+ staining. Subcellular localization of the CF633-nanoART was determined by incubating CD11b+ selected cells with 75 nM Lysotracker Green DND-26 (Molecular Probes/Life Technologies, Grand Island, NY) for 60 min at 37°C. The cells were pelleted and resuspended in dye-free RPMI 1640 medium. CF633-nanoART/CD11b+ cells and CF633-nanoART/Lysotracker Green cells were visualized using a 63× oil immersion lens on a LSM710 confocal microscope (Carl Zeiss Microimaging Inc., Thornwood, NY) with a 3× zoom setting and analyzed with Zeiss AIM software.
RESULTS
Acute-dose administration in mice.
ATV and RTV profiles of serum concentrations versus time following SC administration of nanoART and native drug from the acute single- and multiple-dose PK studies are shown in Fig. 1. After administration of the first dose of native ATV and RTV at 10 mg/kg, serum concentrations increased gradually up to 4 h (ATV Cmax, 2,222 ng/ml; RTV Cmax, 790 ng/ml) and then declined within 48 h to 4.3 and 4.7 ng/ml for ATV and RTV, respectively. One day after the administration of the second dose on day 3 (i.e., day 4), ATV and RTV concentrations were 2.5-fold higher than those at day 2, and on day 7, before the third dose administration, serum levels were 3-fold lower than those on day 4. Three days after the administration of the third dose on day 7 (i.e., day 10), drug levels were 2-fold and 3-fold higher than those on day 7 for ATV and RTV, respectively. By day 14, serum levels were 6- and 13-fold lower than those after the third dose on day 7 for ATV and RTV, respectively (Fig. 1A and C). In contrast, after the first dose administration of nanoART (ATV and RTV) at 10 mg/kg, the serum concentrations increased gradually within 1 h (ATV Cmax, 561 ng/ml; RTV Cmax, 1,103 ng/ml) and then declined to about 15 ng/ml within 24 h for both ATV and RTV. After that, nanoART drug levels remained nearly constant up to day 14. ATV and RTV concentrations in tissues after nanoART and native-drug administration are shown in Table 1. ATV and RTV tissue levels after nanoART treatment were always higher than those measured after native-drug administration. One day after the first dose administration, ATV and RTV levels were up to 506-fold higher in tissues obtained from mice treated with nanoART than in those from mice treated with equimolar doses of the native drugs. ATV and RTV were undetectable in most tissues by the first week of native-drug treatment, whereas they remained detectable for at least 2 weeks after nanoART treatment. After nanoART multiple-dose administration (days 0, 3, and 7), ATV and RTV levels on days 7 and 14 were 9- to 41-fold higher in the liver and were 4- to 26-fold higher in the kidney compared to the native drugs. Drug concentrations at the site of injection were 46-fold and 2,500-fold higher at day 14 after 3 doses of nanoART than those resulting from the native-drug administration for ATV and RTV, respectively. After single-dose administration, on day 14, nanoART ATV and RTV concentrations in the site of injection were 4,454-fold and 2,900-fold higher than the native-drug concentrations, respectively (Table 1).
Fig 1.

Serum concentration (Conc.) versus time profiles from the acute-dose studies after three ATV doses at days 0, 3, and 7 (A), a single ATV dose at day 0 (B), three RTV doses at days 0, 3, and 7 (C), or a single RTV dose (D). Data show means ± standard errors of the means (SEM) (n = 5); dose = 10 mg/kg.
Table 1.
Tissue concentrations of ATV and RTV after acute single- and multiple-dose nanoART and native-drug administration at 10 mg/kg in mice (n = 5)
| Tissue | Day of tissue collection | Concna |
|||
|---|---|---|---|---|---|
| ATV |
RTV |
||||
| Native drug | NanoART | Native drug | NanoART | ||
| Liver | Day 1 after single dose | 13.2 ± 4.2 ng/g | 1,623.5 ± 1,377 ng/g | 83.4 ± 15.2 ng/g | 115.8 ± 19.2 ng/g |
| Day 7 after two doses | 1.4 ± 0.7 ng/g | 21.7 ± 2.6 ng/g | 1.3 ± 0.1 ng/g | 40.2 ± 3.9 ng/g | |
| Day 14 after three doses | 4.4 ± 1.6 ng/g | 39.7 ± 11.2 ng/g | 1.6 ± 0.4 ng/g | 65.0 ± 8.5 ng/g | |
| Day 14 after single dose | 1.3 ± 0.6 ng/g | 7.4 ± 0.7 ng/g | 1.6 ± 0.5 ng/g | 14.2 ± 1.6 ng/g | |
| Spleen | Day 1 after single dose | 4.3 ± 2.1 ng/g | 2,177.4 ± 1,482 ng/g | 61.4 ± 19.2 ng/g | 109.2 ± 30.5 ng/g |
| Day 7 after two doses | * | 2.7 ± 0.7 ng/g | * | 35.2 ± 6.9 ng/g | |
| Day 14 after three doses | * | 6.7 ± 3.7 ng/g | * | 39.1 ± 4.4 ng/g | |
| Day 14 after single dose | * | 1.3 ± 1.1 ng/g | * | 11.7 ± 1.6 ng/g | |
| Lung | Day 1 after single dose | 2.2 ± 0.6 ng/g | 345.7 ± 140.4 ng/g | 23.9 ± 4.0 ng/g | 20.2 ± 2.1 ng/g |
| Day 7 after two doses | * | 3.2 ± 0.4 ng/g | * | 8.4 ± 1.3 ng/g | |
| Day 14 after three doses | * | 5.2 ± 1.3 ng/g | * | 13.6 ± 2.5 ng/g | |
| Day 14 after single dose | * | 1.3 ± 0.6 ng/g | * | 2.1 ± 0.3 ng/g | |
| Kidney | Day 1 after single dose | 4.5 ± 1.0 ng/g | 101.1 ± 54.6 ng/g | 54.6 ± 9.6 ng/g | 75.6 ± 18.8 ng/g |
| Day 7 after two doses | 1.5 ± 0.2 ng/g | 7.6 ± 2.0 ng/g | 1.4 ± 0.2 ng/g | 37.7 ± 2.9 ng/g | |
| Day 14 after three doses | 1.3 ± 0.7 ng/g | 5.8 ± 0.8 ng/g | 2.0 ± 1.2 ng/g | 52.1 ± 5.5 ng/g | |
| Day 14 after single dose | * | 2.3 ± 0.6 ng/g | * | 13.8 ± 3.2 ng/g | |
| Brain | Day 1 after single dose | * | 2.3 ± 0.5 ng/g | 1.3 ± 0.3 ng/g | 1.4 ± 0.2 ng/g |
| Day 7 after two doses | * | * | * | * | |
| Day 14 after three doses | * | * | * | * | |
| Day 14 after single dose | * | * | * | * | |
| Site of injection | Day 1 after single dose | 87.9 ± 16.6 μg/g | 1,121.6 ± 401 μg/g | 48.0 ± 14.4 μg/g | 984.4 ± 436 μg/g |
| Day 7 after two doses | 427.9 ± 135 μg/g | 2,771.9 ± 429 μg/g | 62.7 ± 26.8 μg/g | 2,654.0 ± 417 μg/g | |
| Day 14 after three doses | 42.3 ± 17.4 μg/g | 1,968.0 ± 149 μg/g | 0.6 ± 0.2 μg/g | 1,514.3 ± 207 μg/g | |
| Day 14 after single dose | 0.2 ± 0.2 μg/g | 1,064.8 ± 134 μg/g | 0.2 ± 0.1 μg/g | 581.3 ± 94.6 μg/g | |
Data represent means ± SEM. *, value is below the lower limit of quantitation (LLOQ).
Profiles of ATV and RTV serum concentrations versus time of nanoART in the dose-escalation study are shown in Fig. 2. At all four dose levels of nanoART, serum concentrations increased gradually up to 8 h and then remained relatively constant from day 1 to day 14. The AUC values of serum ATV were 2.9-, 12.4-, and 62.3-fold higher than the 10 mg/kg dose, after 50, 100, and 250 mg/kg doses, respectively. Similarly, serum RTV AUC values were 3-, 5.3-, and 12.8-fold higher than values for the 10 mg/kg dose after 50, 100, and 250 mg/kg doses, respectively (Table 2). Tissue concentrations of ATV and RTV after 14 days of nanoART administration at 10, 50, 100, and 250 mg/kg doses in mice are shown in Table 3. A trend similar to that in serum was also seen in tissues. ATV tissue concentrations on day 14 were 4- to 8-, 24- to 616-, and 41- to 933-fold higher than that seen with the 10 mg/kg dose after 50, 100, and 250 mg/kg doses, respectively. Similarly, RTV concentrations were 4- to 5-, 9- to 14-, and 17- to 44-fold higher than that seen with the 10 mg/kg dose after 50, 100, and 250 mg/kg doses, respectively (Table 3).
Fig 2.

ATV (A) and RTV (B) serum concentration versus time profiles after 10, 50, 100, and 250 mg/kg nanoART administration on days 0, 3, and 7 in mice (n = 5; data represent means ± SEM).
Table 2.
AUC(0-last) values for ATV and RTV after three doses of nanoART at 10, 50, 100, and 250 mg/kg in mice (n = 5)a
| Dose (mg/kg) | AUC(0-last) (ng · h/ml) |
|
|---|---|---|
| ATV | RTV | |
| 10 | 4,908 | 8,024 |
| 50 | 14,146 | 23,784 |
| 100 | 61,032 | 42,666 |
| 250 | 306,029 | 102,617 |
AUClast, AUC corresponding to the last dose administration.
Table 3.
Tissue concentrations of ATV and RTV on day 14 after nanoART multiple-dose (day 0, 3, and 7) administration at 10, 50, 100 and 250 mg/kg in mice (n = 5)
| Drug and tissue | Concna (ng/g) at indicated dose |
|||
|---|---|---|---|---|
| 10 mg/kg | 50 mg/kg | 100 mg/kg | 250 mg/kg | |
| NanoART-ATV | ||||
| Liver | 39.7 ± 11.2 | 181.6 ± 19.3 | 1166.7 ± 355 | 6834.5 ± 2164 |
| Spleen | 6.7 ± 3.7 | 54.0 ± 24.0 | 4144.8 ± 672 | 6414.9 ± 3631 |
| Lung | 5.2 ± 1.3 | 18.1 ± 4.5 | 900.9 ± 787 | 215.5 ± 43 |
| Kidney | 5.8 ± 0.8 | 23.6 ± 4.1 | 138.7 ± 26.2 | 2867.0 ± 1575 |
| Brain | * | 2.2 ± 1.4 | 4.2 ± 0.9 | 17.2 ± 6.2 |
| NanoART-RTV | ||||
| Liver | 65.0 ± 8.5 | 331.9 ± 51.3 | 595.0 ± 106 | 2855.0 ± 754 |
| Spleen | 39.1 ± 4.4 | 169.0 ± 24.2 | 331.6 ± 32.1 | 651.3 ± 27.4 |
| Lung | 13.6 ± 2.5 | 59.6 ± 10.3 | 189.2 ± 54.6 | 243.2 ± 27.6 |
| Kidney | 52.1 ± 5.5 | 281.1 ± 39.3 | 487.9 ± 35.4 | 1366.0 ± 258.7 |
| Brain | * | 2.9 ± 0.3 | 6.9 ± 1.2 | 12.3 ± 1.3 |
Data represent means ± SEM. *, value is below the LLOQ.
Chronic dose administration in mice.
Profiles of ATV and RTV serum concentration versus time after chronic dose administrations are shown in Fig. 3. This multiple-dose chronic PK study was performed to compare the PK and toxicity profiles of nanoART with those of the native drug under steady-state conditions. Three doses were administered during the first week (days 0, 3, and 7) followed by weekly injections for an additional 5 weeks, i.e., total 6 weeks. Serum and tissue samples were collected for an additional 2 weeks after the last dose in week 6, i.e., total 8 weeks. The serum concentrations of ATV and RTV declined 3- to 14-fold by the end of each dosing interval of the native drugs. In addition, serum levels fell more than 6-fold for ATV and 71-fold for RTV within 2 weeks after the last dose administration in week 6. In contrast, nanoART ATV and RTV serum levels were nearly constant starting at week 2 and throughout the experiment (Fig. 3A and B). PK parameters of nanoART and native drug after the last dose administration on day 42 are shown in Table 4, and the ratios of nanoART/native-drug levels in serum and tissues by the end of the study on day 56 are shown in Table 5. The AUC, mean residence time (MRT), and half-life (t1/2) values were 2-, 1.4-, and 4.6-fold higher for nanoART ATV than for native ATV. Similarly, the AUC, MRT, and t1/2 values were 1.7-, 2.2-, and 2.8-fold higher for nanoART RTV than for native RTV. In contrast, clearance (CL) was 7.9 and 2.6 times faster with the native ATV and RTV, respectively, than with nanoART. The concentrations of ATV and RTV in liver, kidney, spleen, lung, brain, and the site of injection obtained from the same study are shown in Fig. 4 and 5. By the end of the experiment, ATV concentrations in the various tissues were 2- to 13-fold higher than the native-drug concentrations (Fig. 4 and Table 5). Similarly, RTV concentrations in the various tissues were 5- to 270-fold higher than the native-drug concentrations (Fig. 5 and Table 5). NanoART ATV and RTV concentrations in the site of injection were also 8- to 27-fold higher than the native-drug concentrations (Fig. 4 and 5).
Fig 3.

Serum concentration versus time profiles of ATV (A) and RTV (B) after multiple-dose administration of nanoART and native drugs at 50 mg/kg in mice for 6 weeks. Arrows indicate times of dose administration (n = 6; data represent means ± SEM).
Table 4.
Pharmacokinetic parameters of ATV and RTV after the last dose administration (day 42) of the chronic-dose study
| Pharmacokinetic parametera | Value |
|||
|---|---|---|---|---|
| NanoART-ATV | Native ATV | NanoART-RTV | Native-RTV | |
| AUClast (ng · h/ml) | 12,592.8 | 6,164.4 | 13,586.4 | 8,028.0 |
| t1/2 (h) | 1,152.5 | 253.3 | 230.1 | 83.6 |
| Vβ (liter/kg) | 1,106.8 | 1,933.0 | 771.4 | 731.4 |
| CL (liter/h/kg) | 0.67 | 5.29 | 2.32 | 6.06 |
| MRT0-∞ (h) | 171.6 | 120.9 | 142.5 | 63.5 |
Vβ, volume of distribution of the terminal phase.
Table 5.
Ratio of nanoART/native ATV and RTV by the end of the chronic-dose study on day 56 (n = 6)
| Sample | Ratio of nanoART/native drug |
|
|---|---|---|
| ATV | RTV | |
| Serum | 4.2 | 13.5 |
| Liver | 12.9 | 270.8 |
| Kidney | 4.1 | 34.3 |
| Lung | 3.2 | 13.7 |
| Spleen | 5.7 | 38.4 |
| Brain | 2.1 | 5.1 |
| Site of injection | 7.5 | 27.2 |
Fig 4.

Concentration versus time profiles of ATV in liver (A), kidney (B), spleen (C), lung (D), brain (E), and site of injection (F) after multiple-dose administration of nanoART and native drug for 6 weeks. Doses were administered on days 0, 3, 7, 14, 21, 28, 35, and 42 at 50 mg/kg. Samples were collected right before dose administration on days 7, 14, 21, 28, 35, and 42 in mice (n = 6; data represent means ± SEM).
Fig 5.

Concentration versus time profiles of RTV in liver (A), kidney (B), spleen (C), lung (D), brain (E), and site of injection (F) after multiple-dose administration of nanoART and native drug for 6 weeks. Doses were administered on days 0, 3, 7, 14, 21, 28, 35, and 42 at 50 mg/kg. Samples were collected right before dose administration on days 7, 14, 21, 28, 35, and 42 in mice (n = 6; data represent means ± SEM).
PK of nanoART in monkeys.
Profiles of ATV and RTV plasma concentrations versus time of nanoART in monkeys are shown in Fig. 6. One monkey was injected with a single dose on day 0, and another monkey was injected with 3 doses at days 0, 3, and 7. Plasma concentrations of nanoART ATV and RTV were detected up to day 38. In addition, after multiple dosing (3 doses) in monkeys, plasma levels of both ATV and RTV were sustained at levels higher than 100 ng/ml for at least 14 days.
Fig 6.
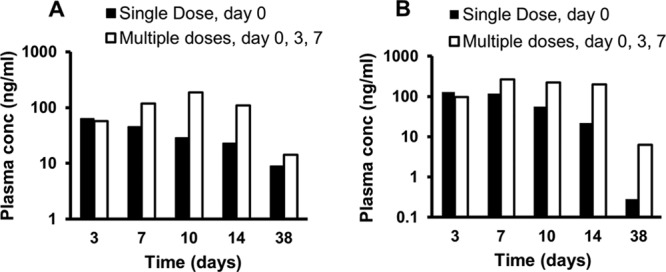
ATV (A) and RTV (B) plasma concentration versus time profiles after 50 mg/kg nanoART administration in rhesus macaques (n = 2).
NanoART in intracellular reservoirs.
A FACS analysis of liver nonparenchymal cells from CF633-P188-ATV/RTV-treated mice incubated with CD11b antibody and collected using MACS cell separation columns is shown in Fig. 7A. Colocalization of nanoART (red) inside CD11b-positive cells (green) in the liver (i.e., Kupffer cells) rather than inside CD11b-negative cells (i.e., hepatocytes and endothelial cells) is shown in Fig. 7B. Figure 7C demonstrates that intracellular concentrations of ATV and RTV after nanoART administration to mice were more than 6-fold higher in CD11b-positive cells than in other types of liver cells, including hepatocytes. Intracellular nanoART (red) was localized outside the lysosomal compartment (green) (Fig. 7D).
Fig 7.

In vivo colocalization of nanoART in CD11b-positive cells of the liver and storage in nonlysosomal compartments. Male BALB/cJ mice were treated SC with 250 mg/kg ATV/RTV (1:1 drug ratio) coated with CF633-modified P188. Liver cells were isolated 24 h later by in situ collagenase digestion. (A) FACS analysis of liver nonparenchymal cells from CF633-P188-ATV/RTV-treated mice incubated with CD11b antibody and collected using MACS cell separation columns. (B) Confocal microscopy of nanoART-loaded nonparenchymal cells following CD11b-positive cell purification showing localization of nanoART (red) in CD11b-positive cells (green) (bar = 20 μm; inset bar = 5 μm). (C) ATV and RTV levels in various liver cell types following cell separation using differential centrifugation and CD11b-positive MACS cell separation (data from a representative experiment are shown). Drug levels were quantitated by LC-MS/MS (bld = below detection limit). (D) Confocal microscopy of nanoART-loaded (red) nonparenchymal cells incubated with Lysotracker Green showing localization of nanoART outside lysosomal (green) compartments (bar = 10 μm).
DISCUSSION
Serum concentrations of ATV and RTV after three doses of nanoART at days 0, 3, and 7 were on average 1.1- to 13-fold higher than those resulting from equimolar doses of native drug throughout the 14-day experiment. By the end of the experiment on day 14, nanoART ATV and RTV levels were 7- to 13-fold higher than those resulting from native-drug administration (P < 0.05) (Fig. 1A and C). The enhanced and sustained serum levels of ATV and RTV after nanoART administration were more prominent after multiple-dose administration at days 0, 3, and 7 (Fig. 1A and C), and that phenomenon did not exist after single-dose administration (Fig. 1B and D). Similar to the multiple-dose effect on serum levels, the enhanced and sustained tissue accumulation of ATV and RTV associated with nanoART was more prominent after multiple-dose administration (3 doses) than after single-dose administration. For example, concentrations in the liver were 9-fold higher for ATV and 41-fold higher for RTV at day 14 after 3 doses of nanoART than those seen after 3 doses of native drugs (Table 1). In contrast, 14 days after a single-dose administration of nanoART, both RTV and ATV concentrations in the liver were only about 7-fold higher than that seen after a single dose of native drugs (Table 1). These data clearly demonstrate that higher serum and tissue levels could be attained and sustained for a longer period of time after multiple administrations of nanoART. The requirement of multiple dosing for nanoART to demonstrate a full effect in enhancing the PK profile of anti-HIV drugs may be related to the activation of monocytes/macrophages in tissues, which contribute to the uptake and slow release of nanoART as discussed below.
NanoART ATV and RTV concentrations at the site of injection were up to 4,454-fold higher than those of native drug (Table 1). Therefore, depots of nanoART are formed at the site of SC injection, which enables sustained drug release over a long period of time. This provides one mechanism to explain the sustained and enhanced blood and tissue PK of nanoART.
The dose escalation study showed that serum levels of both ATV and RTV increased in a nonlinear pattern with the dose. In this experiment, near-steady-state serum concentrations were achieved by day 14 (Fig. 2). The nonlinear PK behavior of ATV and RTV was clearly demonstrated at higher doses in the dose escalation studies. ATV AUC levels increased in a more-than-proportional pattern with increasing doses, whereas RTV AUC levels increased in a less-than-proportional pattern with increasing doses (Table 2). Similarly, ATV serum concentrations on day 14 increased in a more-than-proportional pattern with increasing doses, whereas RTV serum levels increased in a less-than-proportional pattern with increasing doses (Fig. 2). In addition, a similar pattern of nonlinearity was also demonstrated in tissue concentrations (Table 3).
This nonlinear PK behavior of RTV and ATV has been reported on several occasions and is attributed to inhibition or induction of the enzymes and transporters involved in the elimination of these drugs (34, 35). NanoART ATV and RTV showed a nonlinear PK trend similar to that seen with the native drugs, which suggests that nanoART did not interfere with the metabolism and distribution of these drugs. In addition, all four doses resulted in the highest ATV and RTV concentrations in liver and spleen, whereas they were barely detectable in brain (Table 3). This indicates that even though nanoART did improve the PK profile of anti-HIV drugs, it did not improve their limited permeability across the blood-brain barrier. Protease inhibitors are known substrates for P-glycoprotein (PgP), which limits their oral absorption and central nervous system (CNS) penetration. The use of formulations or additives that can inhibit PgP is an established known approach for enhancing the CNS penetration of PgP substrates (36, 37). The current study did not demonstrate any nanoART advantage in enhancing the CNS penetration of ATV and RTV. However, other modified nanoART formulations were shown to have a marked effect on improving the CNS penetration of ART (25).
In the 8-week chronic-dose administration study, concentrations of ATV and RTV declined after each dose administration of the native drugs. In contrast, nanoART ATV and RTV serum levels were nearly constant starting at week 2 and throughout the experiment. Therefore, ATV and RTV serum concentrations at the steady state were maintained at constant and higher levels in weekly dosing compared to those used with the native formulations. Moreover, nanoART ATV and RTV serum levels remained constant for at least 2 weeks after the last dose administration in week 6 (Fig. 3A and B). The PK parameters clearly demonstrate that nanoART resulted into a longer t1/2 and MRT for both ATV and RTV due to 3- to 7-fold decreases in CL (Table 4). With the exception of brain, ATV and RTV levels in tissues after nanoART treatment were up to 270-fold higher than the native-drug levels throughout the 8-week period of the study (Fig. 4 and 5 and Table 5). In addition, similar to the trend in serum, ATV and RTV concentrations in tissues declined exponentially after the last dose administration of native drug in week 6, whereas tissue levels remained constant for at least 2 weeks after the last dose administration of nanoART.
In general, tissue binding, especially for lipophilic drugs, is either equal to or stronger than plasma protein binding. This is evident for protease inhibitors such as ATV due to its high volume of distribution (∼80 liters) compared to body water (38, 39). In addition, our data show that the tissue/serum concentration ratio is as high as 18.1 (Fig. 3, 4, and 5), also indicating high affinity to tissues. These tissue concentrations represent total drug concentrations (bound and unbound). Assuming that tissue binding is at least as strong as plasma protein binding, these tissue concentrations are expected to be mostly in the bound form. However, we have previously shown that total tissue (spleen) concentrations of ATV and RTV are inversely proportional to viral load in humanized mice (13, 14). In addition, it has been shown that total drug concentrations in tissues (ileum and rectum) are inversely proportional to viral load in humans (40). The half-maximum effective concentrations for ATV and RTV were reported in the range of 2.6 to 5.3 nM and 22 to 130 nM, respectively (41, 42), and the tissue concentration resulting from nanoART exceeded these thresholds in mouse liver, kidney, and spleen.
After multiple dosing (3 doses) in monkeys, plasma levels of both ATV and RTV were sustained at levels higher than 100 ng/ml for at least 14 days. At day 38, plasma levels of ATV and RTV resulting from multiple dosing were up to 22-fold higher than those measured after a single-dose administration (Fig. 6A and B, respectively). Similar to the results in mice, the enhanced and sustained plasma accumulation of ATV and RTV associated with nanoART was more prominent after multiple (3 doses) than after single-dose administration. After SC administration, slight inflammation at the injection site was observed on day 2 followed by swelling and development of hard nodules at the injection sites on day 14. Histopathological analysis of biopsy specimens from the injection site showed granuloma formation and crystallization of the nanoART formulation. To overcome these problems, the intramuscular (IM) route was used for nanoART administration. After IM single-dose administration at 50 mg/kg, ATV and RTV plasma concentrations up to day 14 were 2.5- to 5-fold higher than those resulting from SC administration on day 14 (data not shown). In contrast to the SC route, there were no local reactions observed at the site of IM injection. In addition, nanoART administration resulted in normal blood cell counts and serum chemistry profiles.
NanoART clearly resulted in enhanced blood and tissue levels of ATV and RTV in vivo. One obvious mechanism for the sustained PK of nanoART is the sustained release of ATV and RTV from the site of injection. Table 1 and Fig. 4 and 5 demonstrate that ATV and RTV levels at the site of injection after acute- and chronic-dose administration of nanoART were up to 4,454-fold and 2883-fold higher, respectively, than the levels seen with native-drug treatment. Similarly, other tissues and organs clearly contribute to the sustained PK profile associated with nanoART, where tissue levels of ATV and RTV after nanoART treatment were up to 13-fold and 270-fold higher, respectively, than those seen with native-drug treatment.
Cell-mediated drug delivery is a novel concept that employs intracellular recycling and late endosomes as reservoirs for drugs (22, 26, 27). This was demonstrated in vitro through the uptake via clathrin-coated pits and the sustained release of both ATV and RTV from endosome-encased nanoART in macrophages (18). It was also shown that nanoART is efficiently internalized by macrophages, where it is stored in endosomal reservoirs that protect the drug from degradation (23). The internalized particles released the drug slowly, and ART activity against HIV-1ADA was detected for 2 weeks (22). Evidence is now provided that monocytes and macrophages serve as a major cellular reservoir for nanoART in vivo as well as serving as “Trojan horses” for drug delivery (Fig. 7). In mice, the CD11b is expressed in macrophages and granulocytes (43). Localization of nanoART in these cells suggests that nanoART accumulates selectively inside Kupffer cells of liver, which may also be the case with macrophages in other tissues. Prolonged release from deep cellular reservoirs inside tissues may be responsible for the sustained and enhanced pharmacokinetic profile produced by nanoART.
In summary, we have shown that weekly dosing of nanoART maintains therapeutic plasma levels of ATV and RTV at the steady state. The effect of nanoART in improving the PK profile of anti-HIV drugs is due to the sustained release of these drug from intracellular depots in tissues and in the site of injection.
ACKNOWLEDGMENTS
This work was supported by the Carol Swarts Neuroscience Research Laboratory Fund and the National Institutes of Health (grants DA028555-01, P20 DA026146, R01 NS36126, P01 NS31492, 2R01 NS034239, P20 RR15635, P01 MH64570, P01 NS43985, and R01 NS070190).
We acknowledge the assistance of Carol Casey, Department of Internal Medicine, University of Nebraska Medical Center, in developing the methods for isolation of parenchymal and nonparenchymal liver cells. We also acknowledge the University of Nebraska Medical Center Cell Analysis Facility for their assistance in developing the methods for isolation of liver CD11b-positive cells and confocal imaging of dye-labeled cells. We also acknowledge David Muirhead for histopathological analysis.
Footnotes
Published ahead of print 22 April 2013
REFERENCES
- 1. Ellis R, Langford D, Masliah E. 2007. HIV and antiretroviral therapy in the brain: neuronal injury and repair. Nat. Rev. Neurosci. 8:33–44 [DOI] [PubMed] [Google Scholar]
- 2. Work Group for HIV and Aging Consensus Project 2012. Summary report from the Human Immunodeficiency Virus and Aging Consensus Project: treatment strategies for clinicians managing older individuals with the human immunodeficiency virus. J. Am. Geriatr. Soc. 60:974–979 [DOI] [PubMed] [Google Scholar]
- 3. Pasternak AO, de Bruin M, Jurriaans S, Bakker M, Berkhout B, Prins JM, Lukashov VV. 2012. Modest nonadherence to antiretroviral therapy promotes residual HIV-1 replication in the absence of virological rebound in plasma. J. Infect. Dis. 206:1443–1452 [DOI] [PubMed] [Google Scholar]
- 4. Coiras M, Lopez-Huertas MR, Alcami J. 2010. HIV-1 latency and eradication of long-term viral reservoirs. Discov. Med. 9:185–191 [PubMed] [Google Scholar]
- 5. Rao KS, Ghorpade A, Labhasetwar V. 2009. Targeting anti-HIV drugs to the CNS. Expert Opin. Drug Deliv. 6:771–784 [DOI] [PMC free article] [PubMed] [Google Scholar]
- 6. Anabwani G, Navario P. 2005. Nutrition and HIV/AIDS in sub-Saharan Africa: an overview. Nutrition 21:96–99 [DOI] [PubMed] [Google Scholar]
- 7. Piot P, Bartos M, Ghys PD, Walker N, Schwartlander B. 2001. The global impact of HIV/AIDS. Nature 410:968–973 [DOI] [PubMed] [Google Scholar]
- 8. Thaker HK, Snow MH. 2003. HIV viral suppression in the era of antiretroviral therapy. Postgrad. Med. J. 79:36–42 [DOI] [PMC free article] [PubMed] [Google Scholar]
- 9. Rathbun RC, Lockhart SM, Stephens JR. 2006. Current HIV treatment guidelines—an overview. Curr. Pharm. Des. 12:1045–1063 [DOI] [PubMed] [Google Scholar]
- 10. Crowe S, Zhu T, Muller WA. 2003. The contribution of monocyte infection and trafficking to viral persistence, and maintenance of the viral reservoir in HIV infection. J. Leukoc. Biol. 74:635–641 [DOI] [PubMed] [Google Scholar]
- 11. Fogarty L, Roter D, Larson S, Burke J, Gillespie J, Levy R. 2002. Patient adherence to HIV medication regimens: a review of published and abstr reports. Patient Educ. Couns. 46:93–108 [DOI] [PubMed] [Google Scholar]
- 12. Rathbun RC, Farmer KC, Stephens JR, Lockhart SM. 2005. Impact of an adherence clinic on behavioral outcomes and virologic response in treatment of HIV infection: a prospective, randomized, controlled pilot study. Clin. Ther. 27:199–209 [DOI] [PubMed] [Google Scholar]
- 13. Roy U, McMillan J, Alnouti Y, Gautum N, Smith N, Balkundi S, Dash P, Gorantla S, Martinez-Skinner A, Meza J, Kanmogne G, Swindells S, Cohen SM, Mosley RL, Poluektova L, Gendelman HE. 2012. Pharmacodynamic and antiretroviral activities of combination nanoformulated antiretrovirals in HIV-1-infected human peripheral blood lymphocyte-reconstituted mice. J. Infect. Dis. 206:1577–1588 [DOI] [PMC free article] [PubMed] [Google Scholar]
- 14. Dash PK, Gendelman HE, Roy U, Balkundi S, Alnouti Y, Mosley RL, Gelbard HA, McMillan J, Gorantla S, Poluektova LY. 2012. Long-acting nanoformulated antiretroviral therapy elicits potent antiretroviral and neuroprotective responses in HIV-1-infected humanized mice. AIDS 26:2135–2144 [DOI] [PMC free article] [PubMed] [Google Scholar]
- 15. Swindells S, Flexner C, Fletcher CV, Jacobson JM. 2011. The critical need for alternative antiretroviral formulations, and obstacles to their development. J. Infect. Dis. 204:669–674 [DOI] [PMC free article] [PubMed] [Google Scholar]
- 16. Novitsky V, Essex M. 2012. Using HIV viral load to guide treatment-for-prevention interventions. Curr. Opin. HIV AIDS 7:117–124 [DOI] [PubMed] [Google Scholar]
- 17. Sterling TR, Pham PA, Chaisson RE. 2010. HIV infection-related tuberculosis: clinical manifestations and treatment. Clin. Infect. Dis. 50(Suppl 3):S223–S230 [DOI] [PubMed] [Google Scholar]
- 18. Nowacek AS, Miller RL, McMillan J, Kanmogne G, Kanmogne M, Mosley RL, Ma Z, Graham S, Chaubal M, Werling J, Rabinow B, Dou H, Gendelman HE. 2009. NanoART synthesis, characterization, uptake, release and toxicology for human monocyte-macrophage drug delivery. Nanomedicine (Lond) 4:903–917 [DOI] [PMC free article] [PubMed] [Google Scholar]
- 19. Nowacek A, Gendelman HE. 2009. NanoART, neuroAIDS and CNS drug delivery. Nanomedicine (Lond) 4:557–574 [DOI] [PMC free article] [PubMed] [Google Scholar]
- 20. Dou H, Grotepas CB, McMillan JM, Destache CJ, Chaubal M, Werling J, Kipp J, Rabinow B, Gendelman HE. 2009. Macrophage delivery of nanoformulated antiretroviral drug to the brain in a murine model of neuroAIDS. J. Immunol. 183:661–669 [DOI] [PMC free article] [PubMed] [Google Scholar]
- 21. Dou H, Destache CJ, Morehead JR, Mosley RL, Boska MD, Kingsley J, Gorantla S, Poluektova L, Nelson JA, Chaubal M, Werling J, Kipp J, Rabinow BE, Gendelman HE. 2006. Development of a macrophage-based nanoparticle platform for antiretroviral drug delivery. Blood 108:2827–2835 [DOI] [PMC free article] [PubMed] [Google Scholar]
- 22. Nowacek AS, Balkundi S, McMillan J, Roy U, Martinez-Skinner A, Mosley RL, Kanmogne G, Kabanov AV, Bronich T, Gendelman HE. 2011. Analyses of nanoformulated antiretroviral drug charge, size, shape and content for uptake, drug release and antiviral activities in human monocyte-derived macrophages. J. Control Release 150:204–211 [DOI] [PMC free article] [PubMed] [Google Scholar]
- 23. Kadiu I, Nowacek A, McMillan J, Gendelman HE. 2011. Macrophage endocytic trafficking of antiretroviral nanoparticles. Nanomedicine (Lond) 6:975–994 [DOI] [PMC free article] [PubMed] [Google Scholar]
- 24. Nowacek AS, McMillan J, Miller R, Anderson A, Rabinow B, Gendelman HE. 2010. Nanoformulated antiretroviral drug combinations extend drug release and antiretroviral responses in HIV-1-infected macrophages: implications for neuroAIDS therapeutics. J. Neuroimmune Pharmacol. 5:592–601 [DOI] [PMC free article] [PubMed] [Google Scholar]
- 25. Kanmogne GD, Singh S, Roy U, Liu X, McMillan J, Gorantla S, Balkundi S, Smith N, Alnouti Y, Gautam N, Zhou Y, Poluektova L, Kabanov A, Bronich T, Gendelman HE. 2012. Mononuclear phagocyte intercellular crosstalk facilitates transmission of cell-targeted nanoformulated antiretroviral drugs to human brain endothelial cells. Int. J. Nanomedicine 7:2373–2388 [DOI] [PMC free article] [PubMed] [Google Scholar]
- 26. Kabanov AV, Gendelman HE. 2007. Nanomedicine in the diagnosis and therapy of neurodegenerative disorders. Prog. Polym. Sci. 32:1054–1082 [DOI] [PMC free article] [PubMed] [Google Scholar]
- 27. Gendelman HE, Kabanov A, Linder J. 2008. The promise and perils of CNS drug delivery: a video debate. J. Neuroimmune Pharmacol. 3:58. 10.1007/s11481-008-9103-9 [DOI] [PMC free article] [PubMed] [Google Scholar]
- 28. Balkundi S, Nowacek AS, Veerubhotla RS, Chen H, Martinez-Skinner A, Roy U, Mosley RL, Kanmogne G, Liu X, Kabanov AV, Bronich T, McMillan J, Gendelman HE. 2011. Comparative manufacture and cell-based delivery of antiretroviral nanoformulations. Int. J. Nanomedicine 6:3393–3404 [DOI] [PMC free article] [PubMed] [Google Scholar]
- 29. Balkundi S, Nowacek AS, Roy U, Martinez-Skinner A, McMillan J, Gendelman HE. 2010. Methods development for blood borne macrophage carriage of nanoformulated antiretroviral drugs. J. Vis. Exp. 2010:e2460. 10.3791/2460 [DOI] [PMC free article] [PubMed] [Google Scholar]
- 30. Huang J, Gautam N, Bathena SP, Roy U, McMillan J, Gendelman HE, Alnouti Y. 2011. UPLC-MS/MS quantification of nanoformulated ritonavir, indinavir, atazanavir, and efavirenz in mouse serum and tissues. J. Chromatogr. B Analyt. Technol. Biomed. Life Sci. 879:2332–2338 [DOI] [PMC free article] [PubMed] [Google Scholar]
- 31. Casey CA, Kragskow SL, Sorrell MF, Tuma DJ. 1987. Chronic ethanol administration impairs the binding and endocytosis of asialo-orosomucoid in isolated hepatocytes. J. Biol. Chem. 262:2704–2710 [PubMed] [Google Scholar]
- 32. Seki E, De Minicis S, Osterreicher CH, Kluwe J, Osawa Y, Brenner DA, Schwabe RF. 2007. TLR4 enhances TGF-beta signaling and hepatic fibrosis. Nat. Med. 13:1324–1332 [DOI] [PubMed] [Google Scholar]
- 33. Liu W, Hou Y, Chen H, Wei H, Lin W, Li J, Zhang M, He F, Jiang Y. 2011. Sample preparation method for isolation of single-cell types from mouse liver for proteomic studies. Proteomics 11:3556–3564 [DOI] [PubMed] [Google Scholar]
- 34. Foisy MM, Yakiwchuk EM, Hughes CA. 2008. Induction effects of ritonavir: implications for drug interactions. Ann. Pharmacother. 42:1048–1059 [DOI] [PubMed] [Google Scholar]
- 35. Havlir DV, O'Marro SD. 2004. Atazanavir: new option for treatment of HIV infection. Clin. Infect. Dis. 38:1599–1604 [DOI] [PubMed] [Google Scholar]
- 36. Schroeder U, Sommerfeld P, Ulrich S, Sabel BA. 1998. Nanoparticle technology for delivery of drugs across the blood-brain barrier. J. Pharm. Sci. 87:1305–1307 [DOI] [PubMed] [Google Scholar]
- 37. Bansal T, Akhtar N, Jaggi M, Khar RK, Talegaonkar S. 2009. Novel formulation approaches for optimising delivery of anticancer drugs based on P-glycoprotein modulation. Drug Discov. Today 14:1067–1074 [DOI] [PubMed] [Google Scholar]
- 38. Schmidt S, Gonzalez D, Derendorf H. 2010. Significance of protein binding in pharmacokinetics and pharmacodynamics. J. Pharm. Sci. 99:1107–1122 [DOI] [PubMed] [Google Scholar]
- 39. Barrail-Tran A, Mentre F, Cosson C, Piketty C, Chazallon C, Gerard L, Girard PM, Taburet AM. 2010. Influence of alpha-1 glycoprotein acid concentrations and variants on atazanavir pharmacokinetics in HIV-infected patients included in the ANRS 107 trial. Antimicrob. Agents Chemother. 54:614–619 [DOI] [PMC free article] [PubMed] [Google Scholar]
- 40. Cohen J. 2011. HIV/AIDS research. Tissue says blood is misleading, confusing HIV cure efforts. Science 334:1614. 10.1126/science.334.6063.1614 [DOI] [PubMed] [Google Scholar]
- 41. Robinson BS, Riccardi KA, Gong YF, Guo Q, Stock DA, Blair WS, Terry BJ, Deminie CA, Djang F, Colonno RJ, Lin PF. 2000. BMS-232632, a highly potent human immunodeficiency virus protease inhibitor that can be used in combination with other available antiretroviral agents. Antimicrob. Agents Chemother. 44:2093–2099 [DOI] [PMC free article] [PubMed] [Google Scholar]
- 42. Kempf DJ, Marsh KC, Denissen JF, McDonald E, Vasavanonda S, Flentge CA, Green BE, Fino L, Park CH, Kong XP, Wideburg NE, Saldivar A, Ruiz L, Kati WM, Sham HL, Robins T, Stewart KD, Hsu A, Plattner JJ, Leonard JM, Norbeck DW. 1995. ABT-538 is a potent inhibitor of human immunodeficiency virus protease and has high oral bioavailability in humans. Proc. Natl. Acad. Sci. U. S. A. 92:2484–2488 [DOI] [PMC free article] [PubMed] [Google Scholar]
- 43. Arnaout MA. 1990. Structure and function of the leukocyte adhesion molecules CD11/CD18. Blood 75:1037–1050 [PubMed] [Google Scholar]