

Abstract
A single-molecule probe of chromatin structure can uncover dynamic chromatin states and rare epigenetic variants of biological importance that bulk measures of chromatin structure miss. In bisulfite genomic sequencing, each sequenced clone records the methylation status of multiple sites on an individual molecule of DNA. An exogenous DNA methyltransferase can thus be used to image nucleosomes and other protein–DNA complexes. In this chapter, we describe the adaptation of this technique, termed Methylation Accessibility Protocol for individual templates, to modern high-throughput sequencing, which both simplifies the workflow and extends its utility.
1. INTRODUCTION
Methylation Accessibility Protocol for individual templates (MAPit) assays chromatin structure on single molecules, as reviewed in Darst et al. (2012), Miranda, Kelly, Bouazoune, and Jones (2010), Pardo, Darst, Nabilsi, Delmas, and Kladde (2011), and Pondugula and Kladde (2008). The method combines DNA methyltransferase (DNMT) accessibility probing with bisulfite genomic sequencing. Exogenous DNMT probes can be used to footprint protein–DNA complexes, which block cytosine methylation (Kladde, Xu, & Simpson, 1996; Xu, Simpson, & Kladde, 1998). Chemical conversion of unmethylated cytosine to uracil and retention of methyl-5-cytosine (m5C) upon bisulfite treatment then record methylation status of each residue as DNA sequence, as reviewed in Darst, Pardo, Ai, Brown, and Kladde (2010). Thus, by subsequent cloning, each sequence obtained records the chromatin landscape of a single parent molecule (Fatemi et al., 2005; Jessen, Hoose, Kilgore, & Kladde, 2006), as illustrated in Fig. 8.1. MAPit has been used to track chromatin transitions at single-molecule resolution in vitro (Bouazoune, Miranda, Jones, & Kingston, 2009; Dechassa et al., 2010), in isolated nuclei (Gal-Yam et al., 2006; Kilgore, Hoose, Gustafson, Porter, & Kladde, 2007; Lin et al., 2007), and in vivo (Jessen et al., 2006). MAPit can also probe protein–DNA interactions and endogenous DNA methylation simultaneously, using an enzyme cloned from a Chlorella virus, M.CviPI (Xu, Kladde, Van Etten, & Simpson, 1998a), which we have made commercially available. Whereas methylation in differentiated human cells is largely restricted to CG dinucleotides (Lister et al., 2009), M.CviPI methylates cytosine in GC dinucleotides exclusively. With M.CviPI, MAPit has been used to characterize chromatin diversity at a variety of loci (Andreu-Vieyra et al., 2011; Delmas et al., 2011; Han et al., 2011; Pardo, Carr, et al., 2011; Wolff et al., 2010).
Figure 8.1.
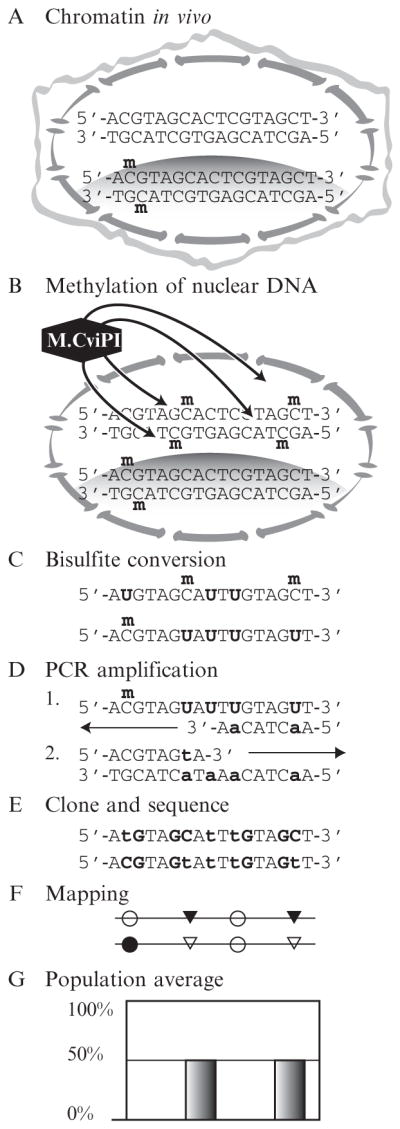
MAPit workflow. (A) In live cells, chromatin structures vary between loci and between copies of the same locus. Here, the upper sequence copy is unmethylated and unbound by protein. The lower has one CG site methylated on both strands and is in a closed chromatin domain, such as a nucleosome, indicated by shading. (B) Cells are lysed while nuclear integrity is preserved. Treatment with recombinant M.CviPI causes methylation of accessible GC sites. (C) Genomic DNA is extracted and treated with bisulfite. Unmethylated cytosine deaminates to sulfonyluracil, becoming uracil upon alkaline desulfonation. Methylated cytosine is unaffected. (D) In two rounds of amplification of the bottom molecule shown in (C), uracil is replaced with thymine, indicated in lower case. (E) Each sequence of an individual DNA molecule records its methylation pattern, that is, chromatin state, specifically, endogenous CG methylation in (A) and accessibility to GC M.CviPI in (B). The DNA sequences shown correspond to the two molecules of (C). (F) After deep sequencing, methylation information is extracted to make structure plots. (G) An assay that measures bulk accessibility at the two GC sites would not report the correlation between them seen when visualizing single molecules from a population as in (F).
To characterize variation in chromatin structure of a locus of interest across a population, enough sequences are needed to see every major variant and their intermediate states. We have found chromatin variants by MAPit that represented real biological phenomena and were only detectable when sequencing about 100 molecules (RPD, I. Haecker, CEP, A. Delmas, R. Renne, and MPK, unpublished observation). With modern high-throughput sequencing, one could study even rarer subjects within mixed populations, such as cancer stem cells or intermediates in chromatin remodeling. At the same time, direct deep sequencing of amplicons bypasses the need for cloning, streamlining the workflow. As for other chromatin analysis techniques that evolved to genome-wide analysis, the future of MAPit undoubtedly lies with deep sequencing.
This chapter describes construction of an amplicon sequencing library for the Roche 454 system. The choice of sequencing platform is driven by the marked utility of read length in MAPit. A read with 20 GC sites has over a million possible methylation configurations, whereas a read with two GC sites has just four. Thus, the structural information per read scales dramatically with the number of sites sequenced per molecule. Furthermore, read length must exceed length of expected features, such as nucleosomes, to map both ends. At present, the 454 system is a good choice for mapping nucleosomes, with average read lengths of 400+ bp readily achievable. Because this platform produces hundreds of thousands of reads, we pool PCR of several loci and from several samples in equimolar amounts, using barcodes incorporated in the primers to track which sequence came from which sample.
Recently, it has become possible to sequence DNA methylation directly, without bisulfite conversion, using the Pacific Biosciences SMRT technology (Clark et al., 2012; Flusberg et al., 2010). Unfortunately, the low fidelity of SMRT recognition of cytosine methylation precludes single-molecule analysis at present. However, with further advances, this or another next-generation sequencing approach may soon revolutionize the way MAPit is done. In turn, a simpler and more direct approach to MAPit could have a broad impact on molecular biology.
2. MATERIALS
Methods and materials needed for the following common laboratory procedures are not detailed in this chapter: tissue culture, agarose gel electrophoresis, PCR both standard and quantitative real-time (qPCR), phenol: chloroform extraction, and ethanol precipitation.
2.1. Reagents
-
1
GC-sensitive restriction endonuclease such as HaeIII and manufacturer’s supplied buffer.
-
2
Hot-start Taq formulation, for example, HotStarTaq (Qiagen) or Pfu Turbo Cx (Stratagene), and manufacturer’s supplied buffer.
-
3
M.CviPI, at least 20 U/μl, fused either to glutathione S-transferase (Zymo Research Corp.) or to maltose binding protein (New England Biolabs). Aliquot and store at −20 °C.
-
4
SAM (S-adenosylmethionine), 32 mM. Aliquot and store at −80 °C; do not reuse aliquots.
-
5
Trypan blue, 0.4% (w/v).
For homebrew bisulfite conversion (optional):
-
6
Hydroquinone
-
7
Sodium hydroxide
-
8
Sodium metabisulfite. Prepare 5 g aliquots in an oxygen-free environment. Store desiccated and in the dark
2.2. Solutions
Dissolve in deionized distilled water and store at room temperature indefinitely unless otherwise specified.
DNMT storage buffer. 15 mM Tris–HCl pH 7.4, 200 mM NaCl, 100 μM EDTA pH 8.0, 1 mM DTT, 200 μg/ml nuclease-free bovine serum albumin, 50% (v/v) glycerol. Store at −20 °C.
DTT (dithiothreitol), 1 M. Aliquot and store at −20 °C.
EDTA (ethylenediaminetetraacetic acid), 0.5 M pH 8.0.
PMSF (phenylmethanesulfonyl fluoride), 25 mM in ethanol. Aliquot and store at −20 °C.
PBS (phosphate-buffered saline). 137 mM NaCl, 5.37 mM Na2HPO4, 2.68 mM KCl, 1.76 mM KH2PO4, pH to 7.4.
Resuspension buffer. 20 mM HEPES (4-(2-hydroxyethyl)-1-piperazineethanesulfonic acid) pH 7.5, 70 mM NaCl, 0.25 mM EDTA pH 8.0, 0.5 mM EGTA (ethylene glycol tetraacetic acid) pH 8.0, 0.5% (v/v) glycerol. Store at 4 °C for up to a month. Add DTT to 10 mM and PMSF to 0.25 mM immediately before use and place on ice.
Lysis buffer. As resuspension buffer, plus 0.19% (v/v) Nonidet P-40 equivalent (octylphenoxypolyethoxyethanol). Store at 4 °C for up to a month. Add DTT to 10 mM and PMSF to 0.25 mM immediately before use and place on ice.
Stop buffer, 2×. 100 mM NaCl, 10 mM EDTA pH 8.0, 1% (w/v) SDS (sodium dodecyl sulfate). Store at room temperature (20–25 °C).
Proteinase K, 20 mg/ml in 5% (v/v) glycerol, 1 mM Tris pH 7.5, 250 μM CaCl2. Do not vortex. Store aliquots at −20 °C.
Phenol:chloroform solution, phenol:chloroform:isoamyl alcohol (25:24:1), equilibrated with 1 M Tris–HCl pH 8.0.
TE, 0.1×. 1 mM Tris–HCl pH 8.0, 100 μM EDTA pH 8.0.
2.3. Supplies
Bisulfite conversion and/or clean-up kit, for example, EZ DNA Methylation (Zymo Research; catalog # D5001).
DNA purification kit, for example, QIAEX II Gel Extraction Kit (Qiagen; catalog #20021).
High-throughput DNA sequencer, for example, Roche 454 GS-FLX, and associated materials.
3. PROTOCOLS
3.1. MAPit in nuclei
This section describes MAPit with cultured fetal neural stem cells (NSCs) grown in suspension, taking enough cells for a two-point titration of M.CviPI concentration, and an untreated control. The protocol can be readily adapted to other cell types and growth conditions. For attached cells, trypsinization is preferred over scraping for cell detachment. If higher detergent concentration is needed for cell lysis to prepare nuclei, then it must be diluted to 0.07% (v/v) in the methylation reaction. Optimal M.CviPI concentration and reaction time may also vary with cell type. For more information on MAPit with reconstituted chromatin, see Darst et al. (2012), Miranda et al. (2010), or Pondugula, Gangaraju, and Bartholomew (2009). For in vivo MAPit using budding yeast, see Pardo, Hoose, Pondugula, and Kladde (2009).
3.1.1 Isolate nuclei
Pellet the cells from a single cell suspension in a sterile 50-ml conical tube by centrifugation at 1000×g for 5 min at 4 °C. From this point on, keep cells on ice.
Wash the cells twice with 5 ml ice-cold PBS by centrifugation at 1000×g for 5 min at 4 °C.
Resuspend the cells in 1 ml PBS and count, either on a hemocytometer by light microscopy, or with an automated counter. Aliquot 3.3×10⁶ cells per sample to a 1.7-ml microcentrifuge tube.
Centrifuge at 1000×g for 5 min at 4 °C and resuspend pellet in 500 μl ice-cold resuspension buffer with freshly added DTT and PMSF. Centrifuge at 1000×g for 5 min at 4 °C and carefully remove supernatant.
Add 115 μl ice-cold lysis buffer with freshly added DTT and PMSF. Resuspend the cells by gentle tapping and incubate on ice.
After 8 min, quickly mix 2 μl cell suspension with 2 μl of 0.4% (v/v) try-pan blue and examine by light microscopy. When lysis is complete, nuclei should be blue, round, and granular, with no attached debris. If intact cells are observed, continue lysis reaction and check again in 2 min.
Terminate the lysis by adding 171 μl resuspension buffer. Put the nuclei on ice.
3.1.2 Probe with M.CviPI
-
On ice, dilute DNMT to treat nuclei with 0, 30, and 100 U M.CviPI per 106 cells:
100 U/10 μl: 1 part 80 U/μl M.CviPI plus 7 parts resuspension buffer with freshly added DTT and PMSF;
30 U/10 μl: 24 parts 100 U/10 μl M.CviPI from step a, plus 7 parts DNMT storage buffer and 49 parts resuspension buffer;
-
0 U/10 μl: 1 part DNMT storage buffer plus 7 parts resuspension buffer.
The dilution scheme ensures that M.CviPI concentration is the only variable.
Prewarm samples at 37 °C for 2 min. Prewarm stop buffer at 50 °C. Bring ice bucket with M.CviPI dilutions, timer, micropipette, and tips to 37 °C water bath.
Add SAM to 160 μM final concentration (1.5 μl of 32 mM SAM per 300 μl nuclei). Withdraw a 90-μl aliquot (about 106 cells) for each methylation reaction and transfer to a 1.7-ml microcentrifuge tube.
To ensure that all samples receive identical DNMT treatment, addition of DNMT to each sample should be staggered. Therefore, set timer to 15 min. After 30 s, add 10 μl DNMT dilution to the first sample. Mix by flicking the tube briefly and return to 37 °C. Repeat every 30 s until all samples have been treated.
15 min after addition of DNMT (30 s after alarm sounds), add 100 μl of 2×stop buffer to the first sample treated. Vortex for 5 s and keep at room temperature until all the samples have been processed. Treat the samples in the same order as before, once every 30 s.
Add proteinase K to 100 μg/ml to each sample (1 μl of 20 mg/ml per 200-μl sample). Mix by flicking the tube briefly and incubate 16–20 h at 50 °C.
Phenol:chloroform extract and ethanol-precipitate DNA, and then elute in 50 μl of 0.1×TE at 4 °C for 12–16 h. Measure nucleic acid concentration by 260-nm absorbance.
3.2. MAPit validation
It is prudent to confirm that the methylation reaction was successful before investing in high-throughput library construction. Although there is no universal yardstick for measuring methylation efficiency, quantifying methylation of a single GC site provides a useful test for M.CviPI activity. The simplest such test is quantitative methyl-sensitive restriction endonuclease digest (qMSRE; Hashimoto, Kokubun, Itoi, & Roach, 2007). Percent GC methylation is proportional to percent protection from a restriction enzyme sensitive to GC methylation, which one can assay by real-time molecular amplification (qPCR), comparing digested to uncut. This protocol probes a HaeIII site at the human GAPDH promoter:
Digest 10 ng genomic DNA (from nuclei treated and untreated with M.CviPI) with HaeIII in 20 μl volume of 1×manufacturer’s supplied buffer for 2 h at 37 °C. For mock digests, add 50% (v/v) glycerol solution in place of restriction enzyme.
Stop the reaction at 80 °C for 20 min.
Measure GAPDH promoter abundance by real-time PCR: three reactions per sample, each with 2 μl digestion or mock reaction, using primers 5′-TACTAGCGGTTTTACGGGCG-3′ and 5′-TCGAACAG-GAGGAGCAGAGAGCGA-3′.
Compute percent protection as: 2(C̄Tmock−C̄Tdigest) where C̄T is the average cycle at which signal exceeds the threshold for the indicated sample.
At least 95% of unmethylated DNA should be cut, whereas treatment with M.CviPI may give up to 80% protection. Percent protection depends both on M.CviPI activity and on the chromatin structure at the site.
3.3. Amplicon sequencing
In amplicon sequencing, libraries of selected loci are amplified by locus-specific primers with 5′ extensions containing the universal sequencing primers used by the high-throughput sequencing platform of choice. For MAPit, the DNA must be bisulfite-treated first (Fig. 8.1, compare B to C). There are two challenges in amplification of deaminated DNA.
First, DNA strands fragment during bisulfite conversion, likely due to the temperature and acidity. It has been estimated that DNA recovered after bisulfite treatment averages 675 bp in length (Munson, Clark, Lamparska-Kupsik, & Smith, 2007). Thus, there is an inverse dependence of amplification efficiency with length. On the other hand, utility of MAPit sequence reads scales with length. Ideally, amplicon length matches the expected sequence length obtained, which is 400–500 bp with the current Roche 454 GS-FLX system.
The second challenge is reduced specificity of primers. Deaminated DNA is less complex, and once a primer has incorporated bases at a nonspecific site, it can no longer amplify the locus of interest. Primer design and optimization of amplification conditions are therefore critical for success. Below, we describe how to design primers, give an optional homebrew bisulfite conversion protocol, and discuss amplification optimization. After a PCR product is obtained, follow the manufacturer’s protocol for deep sequencing.
3.3.1 Primer design
The 5′ end of each primer should contain one of a pair of adaptor sequences. With the Roche 454 platform, these adaptors are used to prime both emulsion PCR and the sequencing reaction. For the latest version of these sequences, consult the manufacturer of the deep sequencing platform of choice (e.g., Roche). Next, a short 5–10 bp barcode should be appended to sequence a locus from several different samples in one reaction. Roche has already designed and validated an array of barcodes, and other manufacturers may have as well.
The 3′ end of each primer must anneal to deaminated DNA or its complement. After bisulfite treatment, the two strands of a DNA helix are no longer complementary because C:G base pairings convert to U:G mismatches. During amplification, DNA polymerase pairs uracil with adenine (Fig. 8.1D). Thus, amplification products have different sequences depending on which strand originated them, and primer sequences to amplify each strand are different as well.
An easy way to design primers is to view the sequence of the locus within a text editor. To design primers to the top strand, replace all “CG” with “YG,” all “GC” with “GY,” then replace all “C” with lowercase “t.” This is now the deaminated sequence of the top strand. Each lowercase “t” marks thymines that pair with adenines that had initially paired with uracils (converted cytosines) during the first extension. The “Y” marks cytosines that may or may not convert depending on methylation. Choose forward and reverse primer sequences that do not overlap a “Y,” if possible, with melting temperatures in the range 52–58 °C. Naturally, the reverse primer has to be the reverse complement of a top strand sequence. If a “Y” cannot be avoided, replace it with an adenine in the forward primer (or replace its complement “R” with a thymine in the reverse primer). The mismatch minimizes biased amplification of methylated or unmethylated sequence.
To design primers to the bottom strand, go back to the original sequence and replace all “CG” with “CR,” all “GC” with “RC,” then replace all “G” with lowercase “a.” In either case, the end result should be a forward primer in which thymine replaces cytosine, and a reverse primer in which adenine replaces guanine. Sometimes, one strand will become less complex than the other after deamination. For instance, the sequence 5′-AGGA-3′ is unchanged on the top deaminated stand, but the complement to the deaminated bottom strand becomes 5′-AaaA-3′. This could interfere with amplification or sequencing. Ideally, one would design and test primers to both strands in case of such problem sequences.
3.3.2 Bisulfite treatment
Bisulfite conversion can be performed with a number of commercially available kits, for example, EZ DNA Methylation (Zymo Research). Although these kits work well for most needs, for MAPit at CpG islands, we prefer a homebrew approach. We hypothesize that high GC density of deaminated DNA at these loci promotes reannealing, which interferes with bisulfite conversion. This homebrew method gives a better percent conversion than we have achieved with kits:
Degas 200 ml water by stirring 20 min either while boiling or under vacuum. Fill a 125-ml glass bottle to brim and cap. If boiled, let cool overnight before using.
Freshly prepare 3 N NaOH from pellets and 100 mM hydroquinone using the degassed water. Prepare 3×sample denaturation buffer: per sample, 6.5 μl degassed water, 3.0 μl of 3 N NaOH, and 0.5 μl of 500 mM EDTA pH 8.0.
Dissolve 0.2–4.0 μg total nucleic acid (DNA and RNA) in 20 μl of 0.1×TE. Add 10 μl of 3×sample denaturation buffer. Leave at room temperature.
Pipette 100 μl of 100 mM hydroquinone into a glass scintillation vial containing a small stir bar. Add quickly in order: 5 g sodium metabisulfite, 7 ml degassed water, and 1 ml of 3 N NaOH. Stir to dissolve, then adjust pH to 4.95–5.05 with 3 N NaOH (may take 100–200 μl). Place at 50 °C.
Denature the DNA samples at 98 °C in thermocycler. After 5 min, quickly add 200 μl metabisulfite solution to each sample and vortex. Keep the samples at 50 °C to prevent renaturation.
Incubate the samples at 50 °C in the dark for 6 h to deaminate cytosines to uracils.
To desulfonate and concentrate DNA, use a commercially available kit, for example, EZ Bisulfite Cleanup Kit (Zymo Research).
Elute the DNA in 25 μl of 0.1×TE prewarmed to 37 °C and store at −20 °C.
3.3.3 Amplification
Extensive denaturation is necessary with single-stranded, low complexity deaminated DNA. All thermocycling steps should be extended; the melt and anneal to 45 s, the extension to 3–4 min per kb, and the initial denaturation to 5 min. For this reason, a hot-start formulation of Taq DNA polymerase is preferred. Uracil in deaminated DNA stalls Pfu and other archaeal family B DNA polymerases (Lasken, Schuster, & Rashtchian, 1996). However, Pfu Turbo Cx (Stratagene) has been engineered to lack uracil recognition, providing another option.
For best amplification, the following parameters may need to be optimized: template DNA concentration, primer concentration, magnesium concentration, and annealing temperature. To begin, add 50 ng template DNA per reaction (i.e., 1–2% of the eluate) and primers to 250 nM each. Compare three magnesium concentrations (1.5, 2.5, and 3.5 mM) across an annealing temperature gradient from −3 to +3 °C of the calculated primer melting temperature, and electrophorese the products on a 1.5% (w/v) agarose gel. A smear or ladder of nonspecific product suggests that template DNA should be diluted. If no product is seen, increasing primer concentration up to 1 μM can sometimes help. In some cases, PCR additives such as trimethyl ammonium chloride (TMAC) are needed.
Once conditions have been optimized:
Amplify the library in at least three separate reactions to maximize sequence diversity.
Purify the product DNA from primers with a 1.5% (w/v) agarose gel.
Use Qiaex II (Qiagen) or other gel extraction kit to desalt and concentrate.
Run 20% on a second gel to quantify concentration.
Pool the samples for deep sequencing following platform manufacturer’s protocol.
3.4. Sequence analysis
Having obtained several tens of thousands of DNA sequence reads, one must first find the locus and barcode of each sequence read and align the sequence against the wild-type reference for the locus. Once aligned, percent bisulfite conversion can be measured and sequences with insufficient deamination discarded. One may also choose to discard duplicate sequences.
To display the data, we recommend two methods. MethylViewer is best for inspecting a small number of molecules in depth. To display hundreds or thousands of molecules at once, we have developed a color-map scheme, employed by MethylTracker.
Further methods of analysis include graphing percent methylation of each site to compare population average to other measures of chromatin structure; counting footprints within various size ranges at each base pair position, to compare populations; and clustering by structure to identify qualitative differences in chromatin diversity.
3.4.1 Alignment
Common multipurpose alignment tools are not well suited for processing bisulfite-converted sequence, or for pyrosequencing as used by the Roche 454 platform. Single base pair insertions and deletions (indels) are common in pyrosequencing, especially at homopolymer sequences, but larger indels are very rare (and reads containing large insertions should be discarded). We have had success with both BLAST (http://blast.ncbi.nlm.nih.gov/Blast.cgi; Altschul, Gish, Miller, Myers, & Lipman, 1990) and MUSCLE (http://www.drive5.com/muscle/; Edgar, 2004) to align bisulfite-converted, 454-sequenced DNA, using some basic code in a language like Python to process sequences in batch.
A custom scoring matrix can be useful for aligning cytosine in the reference with thymine in the read. Although one should treat all cytosines in the read as thymines to prevent a methylation bias in mapping of sequences (Robinson, Statham, Speed, & Clark, 2010), some weak preference for cytosine–cytosine alignment is useful with the 454 sequencer. Otherwise, rare single-thymine insertions (GC to GTC) will make methylated GC sites appear unmethylated, that is, false negatives. We have not observed cytosine insertions on the deaminated strand, perhaps because there are few cytosine homopolymers. This suggests that there is little risk of false positives from 454 sequencer error.
3.4.2 Percent conversion
Incomplete deamination is the source of most false positives for methylation. Percent deamination of unmethylated cytosines can be estimated from percent conversion of cytosines not within potential methylation sites, in other words, HCH, where H is A, C, or T. Discard sequence reads with HCH to HTH conversion of less than 95%, or whatever cutoff desired.
3.4.3 Duplicate sequences
Optionally, duplicate sequences may be discarded. We have found that, given variable endogenous CG methylation, probe GC methylation, and HCH conversion, usually only 5–10% of sequences are exact duplicates. Since two or more identical sequences can result from duplication during the PCR amplification step, their number does not necessarily attest to the frequency of a chromatin structure in live cells. On the other hand, a combination of high bisulfite conversion efficiency with low methylation diversity increases the proportion of duplicates at some loci. In this case, many duplicates likely derive from identical chromatin structures present on separate molecules in the original population. If there is a high proportion of duplicate sequences and the two above-mentioned conditions do not apply, amplification efficiency was likely very poor and the data cannot be used.
3.4.4 PCR recombination
In theory, an incompletely extended PCR product could bind and prime replication of a different copy of the amplicon in a subsequent cycle. This would create a chimerical amplicon, with some sequence from one molecule and some from another. In some situations, chimerical amplicons would be detectable. For example, PCR recombination or crossover between molecules protected by a nucleosome and those that are not would make the footprint size variable. However, we have not detected chimerical amplicons, because we have observed variability in the positions of features, but not their sizes.
3.4.5 MethylViewer
The standard map of DNA methylation is the “lollipop” diagram. We have modified this scheme to depict GC and CG methylation together, using circles for CG and triangles for GC sites (as in Fig. 8.1F). By spacing these symbols according to the location of the sites, sizes of footprints are represented in the image.
The program MethylViewer automates the construction of these illustrations and is freely available at http://dna.leeds.ac.uk/methylviewer/ (Pardo, Carr, et al., 2011). MethylViewer takes sequences in either ABI or FASTA format, aligned or unaligned. Figure 8.2 shows the MethylViewer output. This experiment probed chromatin in cultured human NSCs. These cells were cultured under conditions that would preserve their phenotypic diversity, that is, NSCs and progenitor cells (Siebzehnrubl, Vedam-Mai, Azari, Reynolds, & Deleyrolle, 2011). Accordingly, we anticipated that these conditions would also conserve epigenetic diversity among the cell population. The promoter of the tumor suppressor gene NF1 exhibited a diversity of chromatin structures including differential nucleosome positioning. Although MethylViewer is not suited for displaying large numbers of molecules, it is the best tool available for in-depth inspection of small numbers of MAPit reads. The MethylViewer image output displays all the relevant information for each molecule: CG methylation, GC methylation, methylation of GCG sites, percent HCH conversion, and location of unconverted HCH sites.
Figure 8.2.

MethylViewer plot of chromatin at the human NF1 promoter in NSCs. (A) The 303-bp amplicon was on the transcribed strand ~200 bp 5′ of the NF1 transcription start site (bent arrow) and gene body (dark blue bar), overlapping both a CG island (annotated by UCSC Genome Browser; http://genome.ucsc.edu/; Dreszer et al., 2012; Fujita et al., 2011), and sites hypersensitive to DNase I in several cell lines (Sabo et al., 2006). Nucleotide coordinates on chromosome 17 are indicated at the top. (B) MethylViewer plot (to scale with A) of 10 molecules randomly chosen from over 1000 sequenced with forward primer. Of these, four featured a protected footprint on the nucleosome scale, marked by the light blue shading. Note that the top two molecules appear to be duplicates, having identical unconverted HCH site and methylation status of all sites. Nucleosome core particle length is indicated by bar with light blue shading. (C) Plot of 10 randomly chosen from over 6000 sequenced with the reverse primer.
Note that GCG sites, which can be methylated both by endogenous mammalian DNMTs and by M.CviPI, are colored gray, to reflect their ambiguity. However, this is usually only a concern if significant levels of endogenous methylation are present at or within the vicinity of each GCG site, which can be assessed by a no M.CviPI control sample. MethylViewer can also display different types of methylation besides CG and GC. This is useful for instance for MAPit with M.HhaI, which methylates the 5′ cytosine in GCGC. Up to four methylation types of any desired sequence can be displayed simultaneously.
3.4.6 MethylTracker
To display MethylViewer images for hundreds of molecules on one printed page is impractical. To extract qualitative data from hundreds or thousands of molecules simultaneously, the information has to be condensed. For this purpose, we map methylation to scale with contrasting colors painting blocks of successively methylated and unmethylated sites, and the borders between them (Fig. 8.3A–C; Delmas et al., 2011). Alternately, different shades of a single color can be used; in this case, our convention is that black marks unmethylated spans of sites (panels D–E). Although it is possible to overlay two different types of methylation (i.e., CG and GC), we generally plot only one at a time in this manner. We exclude GCG sites unless only one methylation type is present. Similar schemes have been used by others (e.g., Gal-Yam et al., 2006).
Figure 8.3.

MethylTracker plot of chromatin at the human NF1 promoter in NSCs. (A) Diagram of the same amplicon as in Fig. 8.2 and a close-up view of the MethylTracker plot of CG methylation with these settings: two sites to make a patch, one to break, and exclude GCG. Each row represents one sequence read. See key below: methylated and unmethylated sites are indicated by dark green and bright red vertical bars, respectively. Green patches span successive methylated sites and dark red patches span successive unmethylated sites. Yellow patches mark the borders between sites of different methylation status, as well as sequence not bordered on both sides by sites, that is, at each end. Blue bar indicates 147-bp scale. (B) The complete CG methylation plot for 500 randomly chosen molecules. (C) The GC methylation plot for the same molecules. Blue bar at the top indicates 147-bp nucleosome core particle-length scale. Note variable nucleosome positioning among the molecules inferred from ~150 bp or longer spans of protection against GC methylation (dark red patches). As CG and GC methylation were clustered separately, the order of molecules differs from that in (B). (D) Molecules were divided into three classes by CG methylation structure, tagged red, green, or blue, and clustered for CG methylation again. Dark shading now marks unmethylated spans, spans of bright color mark successively methylated sites, and intermediate shading represents the borders. (E) The GC methylation plot for the molecules barcoded by CG structure. Dispersed distribution of molecules from each of the three CG clusters in (D) over the range of chromatin structures clustered in (C) based on GC methylation shows that CG methylation does not correlate with nucleosome positioning at the locus.
We have built an automated way to construct these plots, named MethylTracker (http://genome.ufl.edu/methyl/). The input must be a text file with aligned sequences in FASTA format. MethylTracker does not align the sequences itself. Currently, the interface allows the user to choose whether to plot CG or GC methylation, and whether to include GCG sites, and supports several ways of assigning patches. With the default settings, a patch is drawn between any two consecutive sites with the same methylation status. This allows a three-color plot, in which borders between methylated and unmethylated zones are shaded to indicate ambiguity. One may instead ask that patches not break until they meet two consecutive sites of a different status, creating a two-color plot (because only one methylation status can be mapped at a time this way).
3.4.7 Data analysis
It is easy to compare quantitative data between experiments. For instance, one could plot the average percent methylation at each site at a locus in two cell populations, to see whether one has higher endogenous methylation or is more open to M.CviPI. This data is comparable to what one would obtain from a population assay, such as methyl-specific PCR or DNase I footprinting. Indeed, comparison of average data from MAPit to these techniques provides a way to double-check MAPit results.
To take advantage of the single-molecule MAPit information, different modes of analysis are needed. One method is to classify footprints based on length and count their occurrence at each position within the locus. Generally, one can infer that M.CviPI-protected footprints in the size range of 100–150 bp result from nucleosomes. Footprints smaller than 100 bp can be assigned to other DNA-binding factors, when occupying known sites, but could also result from incomplete methylation. M.CviPI-accessible patches of ~100 bp or more in length represent nucleosome-free regions, as have been observed at promoters by deep sequencing of nucleosome core particle-length fragments (Jiang & Pugh, 2009). In this way, MAPit detects changes in nucleosome positioning or occupancy of subnucleosomal factors.
Another method is hierarchical clustering of methylation maps (Delmas et al., 2011). Suppose one population has a chromatin state that the other lacks. This may not be obvious from looking at the population average (especially if it is a rare state), or from looking at the methylation maps (if the vertical order of molecules is random). Hierarchical clustering brings together molecules with similar chromatin structure. Thus, instead of thousands of molecules, the human eye sees a smaller number of structure clusters. These clusters can be viewed as chromatin states. For instance, the defining feature of one cluster might be a particular positioned nucleosome; it is the chromatin state in which that nucleosome is present. It may be possible to see a cluster that is present in one population but not in the other. If not, tagging the molecules by origin and mixing them, then clustering them, may reveal a cluster that has a statistically significant enrichment for tags from one population.
The MethylTracker program has a color barcoding system. To access this, the user must add the bar character “|” and a text string to the end of each sequence identifier line. MethylTracker tracks up to six of these text strings, assigning each a primary or secondary color. Each sequence with that barcode is then represented in the assigned color, as in Fig. 8.3D and E. In this example, three patterns of CG methylation were found in 500 molecules: a single site upstream (coded green), some sites downstream (red), or no methylation (blue). Molecules were barcoded by CG structure and reclustered. The GC methylation plot in Fig. 8.3E shows that red, green, and blue molecules are present in each structure cluster. Although this shows that these CG methylations do not affect nucleosome positioning, the opposite result would not support the reverse conclusion. A correlation between CG and GC methylation maps would indicate that chromatin structure variations are epigenetic, but would not necessarily define the epigenetic determinants.
Acknowledgments
This work was supported by grants R01CA095525 and R01CA155390 from the National Institutes of Health, BC097648 from the Department of Defense, 1BD-03 and 2BT01 from the Florida Department of Health (N.H.N. and M. P. K.), and funds from the UF Genetics Institute (A. R.).
References
- Altschul SF, Gish W, Miller W, Myers EW, Lipman DJ. Basic local alignment search tool. Journal of Molecular Biology. 1990;215:403–410. doi: 10.1016/S0022-2836(05)80360-2. [DOI] [PubMed] [Google Scholar]
- Andreu-Vieyra C, Lai J, Berman BP, Frenkel B, Jia L, Jones PA, et al. Dynamic nucleosome-depleted regions at androgen receptor enhancers in the absence of ligand in prostate cancer cells. Molecular and Cellular Biology. 2011;31:4648–4662. doi: 10.1128/MCB.05934-11. [DOI] [PMC free article] [PubMed] [Google Scholar]
- Bouazoune K, Miranda TB, Jones PA, Kingston RE. Analysis of individual remodeled nucleosomes reveals decreased histone-DNA contacts created by hSWI/ SNF. Nucleic Acids Research. 2009;37:5279–5294. doi: 10.1093/nar/gkp524. [DOI] [PMC free article] [PubMed] [Google Scholar]
- Clark TA, Murray IA, Morgan RD, Kislyuk AO, Spittle KE, Boitano M, et al. Characterization of DNA methyltransferase specificities using single-molecule, real-time DNA sequencing. Nucleic Acids Research. 2012;40:e29. doi: 10.1093/nar/gkr1146. http://dx.doi.org/10.1093/nar/gkr1146. [DOI] [PMC free article] [PubMed] [Google Scholar]
- Darst RP, Pardo CE, Ai L, Brown KD, Kladde MP. Bisulfite sequencing of DNA. Current Protocols in Molecular Biology. 2010;chapter 7(Unit 7.9.1–17) doi: 10.1002/0471142727.mb0709s91. [DOI] [PMC free article] [PubMed] [Google Scholar]
- Darst RP, Pardo CE, Pondugula S, Gangaraju VK, Nabilsi NH, Bartholomew B, et al. Simultaneous single-molecule detection of endogenous C-5 DNA methylation and chromatin accessibility using MAPit. Methods in Molecular Biology. 2012;833:125–141. doi: 10.1007/978-1-61779-477-3_9. [DOI] [PubMed] [Google Scholar]
- Dechassa ML, Sabri A, Pondugula S, Kassabov SR, Chatterjee N, Kladde MP, et al. SWI/SNF has intrinsic nucleosome disassembly activity that is dependent on adjacent nucleosomes. Molecular Cell. 2010;38:590–602. doi: 10.1016/j.molcel.2010.02.040. [DOI] [PMC free article] [PubMed] [Google Scholar]
- Delmas AL, Riggs BM, Pardo CE, Dyer LM, Darst RP, Izumchenko EG, et al. WIF1 is a frequent target for epigenetic silencing in squamous cell carcinoma of the cervix. Carcinogenesis. 2011;32:1625–1633. doi: 10.1093/carcin/bgr193. [DOI] [PMC free article] [PubMed] [Google Scholar]
- Dreszer TR, Karolchik D, Zweig AS, Hinrichs AS, Raney BJ, Kuhn RM, et al. The UCSC Genome Browser database: Extensions and updates 2011. Nucleic Acids Research. 2012;40:D918–D923. doi: 10.1093/nar/gkr1055. [DOI] [PMC free article] [PubMed] [Google Scholar]
- Edgar RC. MUSCLE: Multiple sequence alignment with high accuracy and high throughput. Nucleic Acids Research. 2004;32:1792–1797. doi: 10.1093/nar/gkh340. [DOI] [PMC free article] [PubMed] [Google Scholar]
- Fatemi M, Pao MM, Jeong S, Gal-Yam EN, Egger G, Weisenberger DJ, et al. Footprinting of mammalian promoters: use of a CpG DNA methyltransferase revealing nucleosome positions at a single molecule level. Nucleic Acids Research. 2005;33:e176. doi: 10.1093/nar/gni180. [DOI] [PMC free article] [PubMed] [Google Scholar]
- Flusberg BA, Webster DR, Lee JH, Travers KJ, Olivares EC, Clark TA, et al. Direct detection of DNA methylation during single-molecule, real-time sequencing. Nature Methods. 2010;7:461–465. doi: 10.1038/nmeth.1459. [DOI] [PMC free article] [PubMed] [Google Scholar]
- Fujita PA, Rhead B, Zweig AS, Hinrichs AS, Karolchik D, Cline MS, et al. The UCSC Genome Browser database: Update 2011. Nucleic Acids Research. 2011;39:D876–D882. doi: 10.1093/nar/gkq963. [DOI] [PMC free article] [PubMed] [Google Scholar]
- Gal-Yam EN, Jeong S, Tanay A, Egger G, Lee AS, Jones PA. Constitutive nucleosome depletion and ordered factor assembly at the GRP78 promoter revealed by single molecule footprinting. PLoS Genetics. 2006;2:e160. doi: 10.1371/journal.pgen.0020160. [DOI] [PMC free article] [PubMed] [Google Scholar]
- Han H, Cortez CC, Yang X, Nichols PW, Jones PA, Liang G. DNA methylation directly silences genes with non-CpG island promoters and establishes a nucleosome occupied promoter. Human Molecular Genetics. 2011;20:4299–4310. doi: 10.1093/hmg/ddr356. [DOI] [PMC free article] [PubMed] [Google Scholar]
- Hashimoto K, Kokubun S, Itoi E, Roach HI. Improved quantification of DNA methylation using methylation-sensitive restriction enzymes and real-time PCR. Epigenetics. 2007;2:86–91. doi: 10.4161/epi.2.2.4203. [DOI] [PubMed] [Google Scholar]
- Jessen WJ, Hoose SA, Kilgore JA, Kladde MP. Active PHO5 chromatin encompasses variable numbers of nucleosomes at individual promoters. Nature Structural & Molecular Biology. 2006;13:256–263. doi: 10.1038/nsmb1062. [DOI] [PubMed] [Google Scholar]
- Jiang C, Pugh BF. Nucleosome positioning and gene regulation: Advances through genomics. Nature Reviews Genetics. 2009;10:161–172. doi: 10.1038/nrg2522. [DOI] [PMC free article] [PubMed] [Google Scholar]
- Kilgore JA, Hoose SA, Gustafson TL, Porter W, Kladde MP. Single-molecule and population probing of chromatin structure using DNA methyltransferases. Methods. 2007;41:320–332. doi: 10.1016/j.ymeth.2006.08.008. [DOI] [PMC free article] [PubMed] [Google Scholar]
- Kladde MP, Xu M, Simpson RT. Direct study of DNA-protein interactions in repressed and active chromatin in living cells. The EMBO Journal. 1996;15:6290–6300. [PMC free article] [PubMed] [Google Scholar]
- Lasken RS, Schuster DM, Rashtchian A. Archaebacterial DNA polymerases tightly bind uracil-containing DNA. The Journal of Biological Chemistry. 1996;271:17692–17696. doi: 10.1074/jbc.271.30.17692. [DOI] [PubMed] [Google Scholar]
- Lin JC, Jeong S, Liang G, Takai D, Fatemi M, Tsai YC, et al. Role of nucleosomal occupancy in the epigenetic silencing of the MLH1 CpG island. Cancer Cell. 2007;12:432–444. doi: 10.1016/j.ccr.2007.10.014. [DOI] [PMC free article] [PubMed] [Google Scholar]
- Lister R, Pelizzola M, Dowen RH, Hawkins RD, Hon G, Tonti-Filippini J, et al. Human DNA methylomes at base resolution show widespread epigenomic differences. Nature. 2009;462:315–322. doi: 10.1038/nature08514. [DOI] [PMC free article] [PubMed] [Google Scholar]
- Miranda TB, Kelly TK, Bouazoune K, Jones PA. Methylation-sensitive single-molecule analysis of chromatin structure. Current Protocols in Molecular Biology. 2010;chapter 21(Unit 21.17.1–16) doi: 10.1002/0471142727.mb2117s89. [DOI] [PubMed] [Google Scholar]
- Munson K, Clark J, Lamparska-Kupsik K, Smith SS. Recovery of bisulfite-converted genomic sequences in the methylation-sensitive QPCR. Nucleic Acids Research. 2007;35:2893–2903. doi: 10.1093/nar/gkm055. [DOI] [PMC free article] [PubMed] [Google Scholar]
- Pardo CE, Carr IM, Hoffman CJ, Darst RP, Markham AF, Bonthron DT, et al. MethylViewer: Computational analysis and editing for bisulfite sequencing and methyltransferase accessibility protocol for individual templates (MAPit) projects. Nucleic Acids Research. 2011;39:e5. doi: 10.1093/nar/gkq716. [DOI] [PMC free article] [PubMed] [Google Scholar]
- Pardo CE, Darst RP, Nabilsi NH, Delmas AL, Kladde MP. Simultaneous single-molecule mapping of protein-DNA interactions and DNA methylation by MAPit. Current Protocols in Molecular Biology. 2011;chapter 21(Unit 21.22.1–18) doi: 10.1002/0471142727.mb2122s95. [DOI] [PMC free article] [PubMed] [Google Scholar]
- Pardo C, Hoose SA, Pondugula S, Kladde MP. DNA methyltransferase probing of chromatin structure within populations and on single molecules. Methods in Molecular Biology. 2009;523:41–65. doi: 10.1007/978-1-59745-190-1_4. [DOI] [PubMed] [Google Scholar]
- Pondugula S, Gangaraju VK, Bartholomew B, Kladde MP. DNA methyl-transferase-based single-molecule (MAPit) assay for mapping protein-DNA interactions in vitro. 2009 Published online at http://www.epigenesys.eu/index.php/en/protcols/chromatin-biochemistry/
- Pondugula S, Kladde MP. Single-molecule analysis of chromatin: Changing the view of genomes one molecule at a time. Journal of Cellular Biochemistry. 2008;105:330–337. doi: 10.1002/jcb.21849. [DOI] [PMC free article] [PubMed] [Google Scholar]
- Robinson MD, Statham AL, Speed TP, Clark SJ. Protocol matters: Which methylome are you actually studying? Epigenomics. 2010;2:587–598. doi: 10.2217/epi.10.36. [DOI] [PMC free article] [PubMed] [Google Scholar]
- Sabo PJ, Kuehn MS, Thurman R, Johnson BE, Johnson EM, Cao H, et al. Genome-scale mapping of DNase I sensitivity in vivo using tiling DNA micro-arrays. Nature Methods. 2006;3:511–518. doi: 10.1038/nmeth890. [DOI] [PubMed] [Google Scholar]
- Siebzehnrubl FA, Vedam-Mai V, Azari H, Reynolds BA, Deleyrolle LP. Isolation and characterization of adult neural stem cells. Methods in Molecular Biology. 2011;750:61–77. doi: 10.1007/978-1-61779-145-1_4. [DOI] [PubMed] [Google Scholar]
- Wolff EM, Byun HM, Han HF, Sharma S, Nichols PW, Siegmund KD, et al. Hypomethylation of a LINE-1 promoter activates an alternate transcript of the MET oncogene in bladders with cancer. PLoS Genetics. 2010;6:e1000917. doi: 10.1371/journal.pgen.1000917. [DOI] [PMC free article] [PubMed] [Google Scholar]
- Xu M, Kladde MP, Van Etten JL, Simpson RT. Cloning, characterization and expression of the gene coding for a cytosine-5-DNA methyltransferase recognizing GpC. Nucleic Acids Research. 1998;26:3961–3966. doi: 10.1093/nar/26.17.3961. [DOI] [PMC free article] [PubMed] [Google Scholar]
- Xu M, Simpson RT, Kladde MP. Gal4p-mediated chromatin remodeling depends on binding site position in nucleosomes but does not require DNA replication. Molecular and Cellular Biology. 1998;18:1201–1212. doi: 10.1128/mcb.18.3.1201. [DOI] [PMC free article] [PubMed] [Google Scholar]