

Abstract
Salmonella enterica subsp. enterica serovar Newport (S. Newport) is the third most prevalent cause of food-borne salmonellosis. Rapid, efficient, and accurate methods for identification are required to track specific strains of S. Newport during outbreaks. By exploiting the hypervariable nature of virulence genes and clustered regularly interspaced short palindromic repeats (CRISPRs), we previously developed a sequence-based subtyping approach, designated CRISPR–multi-virulence-locus sequence typing (CRISPR-MVLST). To demonstrate the applicability of this approach, we analyzed a broad set of S. Newport isolates collected over a 5-year period by using CRISPR-MVLST and pulsed-field gel electrophoresis (PFGE). Among 84 isolates, we defined 38 S. Newport sequence types (NSTs), all of which were novel compared to our previous analyses, and 62 different PFGE patterns. Our data suggest that both subtyping approaches have high discriminatory abilities (>0.95) with a potential for clustering cases with common exposures. Importantly, we found that isolates from closely related NSTs were often similar by PFGE profile as well, further corroborating the applicability of CRISPR-MVLST. In the first full application of CRISPR-MVLST, we analyzed isolates from a recent S. Newport outbreak. In this blinded study, we confirmed the utility of CRISPR-MVLST and were able to distinguish the 10 outbreak isolates, as defined by PFGE and epidemiological data, from a collection of 20 S. Newport isolates. Together, our data show that CRISPR-MVLST could be a complementary approach to PFGE subtyping for S. Newport.
INTRODUCTION
There are over a million estimated cases of salmonellosis annually in the United States, resulting in approximately 400 deaths, nearly 20,000 hospitalizations, and an economic burden of $3.3 to 4.4 billion (1, 2). Salmonella enterica subsp. enterica serovar Newport is the third most common serovar of Salmonella enterica subsp. enterica that causes illness, and the disease incidences attributed to this serovar increased by 46% between 1999 and 2009 (3). In 2009, S. Newport accounted for 9.3% of total salmonellosis cases (3). Of concern, strains that are resistant to at least seven antimicrobial agents have been isolated from humans (4), increasing the need to monitor the genetic diversity and evolutionary path of pathogenic and medically challenging strains. Some recent multistate S. Newport outbreaks were linked to contaminated cantaloupe melons (in 2012), live poultry (2012), and alfalfa sprouts (2010) (5). Additionally, an outbreak associated with the consumption of tomatoes was identified in June 2012 in southeast Pennsylvania that resulted in 37 reported cases of illness (data from Pennsylvania Department of Health).
During outbreak investigations, following sample enrichment and positive identification of Salmonella colonies, isolates are serotyped. Next, both conventional epidemiology and molecular subtyping are used to identify the transmission routes of the specific outbreak strain. The current gold standard for typing at the strain level for Salmonella is pulsed-field gel electrophoresis (PFGE), by which rare cutting restriction enzymes are used to digest the genomic DNA and the resulting bands are resolved on an agarose gel. PFGE requires skilled personnel, does not lend itself to automation, and although standardized protocols exist that enable PFGE to be completed in 24 h, this method can take longer. Importantly, PFGE does not display equal sensitivities among different Salmonella serovars, and at times effective discrimination can be precluded in clonal serovars, such as S. Enteritidis and S. Typhimurium phage type DT104. Alternative subtyping approaches include multiple-locus variable-number tandem repeat analysis (MLVA) and clustered regularly interspaced short palindromic repeat and multiple-virulence-locus sequence typing (CRISPR-MVLST). MLVA involves amplification and fragment size analysis of polymorphic regions of DNA that contain variable numbers of tandemly repeated sequences. This approach has been used most commonly for S. Typhimurium (6, 7), S. Enteritidis (8–11), and S. Typhi (12). An additional study by van Cuyck and colleagues used MLVA to analyze 31 different Salmonella serovars (13). A recently published MLVA protocol for S. Newport is being modified, standardized, and validated by PulseNet USA, the electronic network for food-borne disease surveillance (14), although this test is not yet in routine use by public health laboratories in the United States.
CRISPR-MVLST is also a molecular-based subtyping technique, which was recently developed and is based on the sequence analysis of four genomic loci in Salmonella: fimH1 (fimH), sseL, CRISPR1, and CRISPR2 (15). There are two CRISPR loci in Salmonella (16), and each comprises several short sequences, called spacers, that are interspaced by conserved direct repeats. In some bacteria, homology between a spacer and a complementary target nucleic acid results in degradation of the target by sequence-specific endonucleases, providing protection from exogenous bacteriophage or plasmid DNA (reviewed in references 17 and 18). Due to both acquisition and loss of these spacer elements, CRISPRs arguably represent the most rapidly evolving prokaryotic loci (19–21). Although originally used for spacer oligonucleotide typing, or spoligotyping, for Mycobacterium tuberculosis (22, 23), we and others have successfully exploited CRISPR spacer sequence differences for subtyping several different pathogens, including group A Streptococcus (24), Campylobacter species (25), Salmonella (15, 26–28), and Shiga toxin-producing Escherichia coli (29, 30). In Salmonella, CRISPR spacer compositions are highly conserved at the serovar level, suggesting that CRISPR sequence typing alone may be sufficient to detect, identify, and distinguish serotypes (27). CRISPR analysis of a limited set of S. Typhimurium isolates has shown that this approach is discriminatory enough for laboratory surveillance of Salmonella infections (27). MVLST is an adaptation of MLST schemes and involves sequence analysis of virulence genes instead of housekeeping genes (31–33). Given that virulence genes are under greater selective pressure and therefore evolve at a higher rate, these are ideal molecular targets for subtyping pathogens (34). Our initial studies showed that sequence analysis of both CRISPR and of two virulence genes, fimH and sseL, as a CRISPR-MVLST scheme, can provide greater discrimination than CRISPR alone (15). CRISPR-MVLST has been most thoroughly studied in both clinical and environmental isolates of S. Enteritidis (26, 28). Unlike most S. enterica serovars, S. Enteriditis strains exhibit high clonality and, among a large and randomized set of clinical isolates, CRISPR-MVLST was marginally more discriminatory than PFGE (28).
To determine the utility of CRISPR-MVLST for subtyping a more genetically diverse but clinically relevant serovar, we analyzed 84 S. Newport isolates from the Pennsylvania Department of Health that were systematically collected over a 5-year period. We found that CRISPR-MVLST and PFGE had similar discriminatory abilities when we used these isolates. Importantly, using this large data set, we found, for the first time, that isolates that are closely related by CRISPR-MVLST are also similar by PFGE, and vice versa.
Further, we applied CRISPR-MVLST to successfully distinguish outbreak isolates within a blinded collection of S. Newport isolates sampled during the same period. In conclusion, we provide the first evidence that CRISPR-MVLST can be used to subtype Salmonella isolates in a real-life outbreak scenario.
MATERIALS AND METHODS
Bacterial isolates and sample preparation.
A total of 84 clinical isolates of S. Newport were obtained from the Pennsylvania Department of Health and are listed in Table 1. These isolates were selected systematically over 5 years (isolates received closest to the 1st and 15th of each month from 2007 to 2011 were selected) to represent an unbiased collection of human clinical isolates.
Table 1.
List of the 84 Salmonella serovar Newport isolates from the Pennsylvania Department of Health that were analyzed
| Isolate | CRISPR-MVLSTa | PFGE | PA regionb | Isolation date |
|---|---|---|---|---|
| 07E00097 | NST 7 | JJPX01.0061 | NE | Jan-07 |
| M10013735001A | NST 7 | JJPX01.0061 | NE | Jun-10 |
| 08E00210 | NST 7 | JJPX01.0267 | SE | Feb-08 |
| 09E00125 | NST 7 | JJPX01.0267 | SE | Jan-09 |
| 08E01607 | NST 8 | JJPX01.0005 | SW | Sep-08 |
| 07E00155 | NST 8 | JJPX01.0119 | SE | Jan-07 |
| 08E01537 | NST 8 | JJPX01.0119 | NW | Aug-08 |
| M11030458001A | NST 8 | JJPX01.0239 | SW | Dec-11 |
| 07E00399 | NST 9 | JJPX01.2015 | SW | Mar-07 |
| 07E00461 | NST 10 | JJPX01.2010 | SE | Apr-07 |
| 07E01951 | NST 11 | JJPX01.0014 | SE | May-07 |
| 07E00747 | NST 12 | JJPX01.0289 | NE | May-07 |
| M11000510001A | NST 12 | JJPX01.2721 | SE | Jan-11 |
| 07E00929 | NST 13 | JJPX01.2261 | SW | Jun-07 |
| 07E02078 | NST 14 | JJPX01.0011 | SE | Oct-07 |
| 08E01356 | NST 14 | JJPX01.0011 | SC | Aug-08 |
| M09016624001A | NST 14 | JJPX01.0011 | SW | Jul-09 |
| M09024074001A | NST 14 | JJPX01.0011 | SE | Oct-09 |
| M10028778001A | NST 14 | JJPX01.0011 | SW | Dec-10 |
| M10018416001A | NST 14 | JJPX01.0030 | SE | Aug-10 |
| M11019990001A | NST 14 | JJPX01.0030 | NE | Aug-11 |
| 07E00925 | NST 14 | JJPX01.0057 | NE | Jun-07 |
| M11018046001A | NST 14 | JJPX01.0213 | SE | Jul-11 |
| 08E00500 | NST 14 | JJPX01.0394 | SW | Apr-08 |
| M11015863001A | NST 14 | JJPX01.0872 | SW | Jun-11 |
| 07E01217 | NST 15 | JJPX01.2301 | SW | Jul-07 |
| 07E01261 | NST 16 | JJPX01.2263 | SE | Jul-07 |
| M11014659001A | NST 17 | JJPX01.0105 | SE | Jun-11 |
| 07E01662 | NST 17 | JJPX01.0177 | SE | Sep-07 |
| M11022592001A | NST 17 | JJPX01.0309 | SE | Sep-11 |
| 07E02298 | NST 17 | JJPX01.2282 | SE | Nov-07 |
| M10026897001A | NST 17 | JJPX01.3088 | SW | Oct-10 |
| 07E02137 | NST 18 | JJPX01.0025 | SW | Oct-07 |
| 08E00166 | NST 18 | JJPX01.0242 | SE | Jan-08 |
| 08E00335 | NST 18 | JJPX01.2775 | SE | Mar-08 |
| 08E02126 | NST 18 | JJPX01.0497 | SW | Nov-08 |
| 07E02409 | NST 19 | JJPX01.0149 | NC | Dec-07 |
| M10029131001A | NST 20 | JJPX01.0014 | SE | Dec-10 |
| 09E00792 | NST 20 | JJPX01.0383 | SC | Apr-09 |
| 07E01395 | NST 20 | JJPX01.0383 | SC | Aug-07 |
| M11026343001A | NST 20 | JJPX01.0422 | SW | Oct-11 |
| M10003908001A | NST 20 | JJPX01.1811 | SE | Feb-10 |
| 08E00177 | NST 20 | JJPX01.2232 | SE | Feb-08 |
| 09E01543 | NST 20 | JJPX01.3251 | SC | Jun-09 |
| 08E00291 | NST 21 | JJPX01.0023 | SW | Mar-08 |
| M09018506001A | NST 21 | JJPX01.0358 | SE | Aug-09 |
| M09019440001A | NST 21 | JJPX01.0358 | NE | Aug-09 |
| M09016172001A | NST 21 | JJPX01.0847 | SW | Jul-09 |
| 08E00513 | NST 22 | JJPX01.0235 | SE | May-08 |
| M10011785001A | NST 22 | JJPX01.3528 | SW | May-10 |
| 08E01026 | NST 23 | JJPX01.0438 | NC | Jun-08 |
| 08E00966 | NST 24 | JJPX01.0538 | SW | Jul-08 |
| 09E01420 | NST 24 | JJPX01.0538 | NE | Jun-09 |
| 08E01066 | NST 25 | JJPX01.0170 | SW | Jul-08 |
| M09023181001A | NST 25 | JJPX01.0687 | SW | Sep-09 |
| 08E01928 | NST 27 | JJPX01.1824 | NE | Oct-08 |
| M11010588001A | NST 27 | JJPX01.3681 | SE | Mar-11 |
| M11010828001A | NST 27 | JJPX01.3681 | SE | Apr-11 |
| 08E02388 | NST 29 | JJPX01.0025 | SC | Dec-08 |
| M10027390001A | NST 29 | JJPX01.0025 | SE | Nov-10 |
| M10006936001A | NST 29 | JJPX01.0534 | SW | Mar-10 |
| M10013705001A | NST 29 | JJPX01.3115 | SE | Jun-10 |
| 08E02500 | NST 30 | JJPX01.0497 | SE | Dec-08 |
| 09E00195 | NST 31 | JJPX01.0267 | SE | Jan-09 |
| 09E00491 | NST 32 | JJPX01.0514 | SE | Mar-09 |
| 09E00565 | NST 33 | JJPX01.1846 | NE | Mar-09 |
| 09E01249 | NST 34 | JJPX01.0241 | SE | May-09 |
| 09E01236 | NST 34 | JJPX01.0241 | SC | May-09 |
| M09032450001A | NST 35 | JJPX01.0696 | NW | Nov-09 |
| M10001733001A | NST 36 | JJPX01.0472 | NC | Jan-10 |
| M10015969001A | NST 37 | JJPX01.0032 | SE | Jul-10 |
| M11004830001A | NST 37 | JJPX01.0032 | SW | Feb-11 |
| M10015025001A | NST 37 | JJPX01.0038 | SE | Jul-10 |
| M10007077001A | NST 37 | JJPX01.1477 | SE | Mar-10 |
| M10008806001A | NST 38 | JJPX01.0629 | SE | Apr-10 |
| M10011150001A | NST 39 | JJPX01.3105 | SW | May-10 |
| M10017951001A | NST 40 | JJPX01.0206 | SW | Aug-10 |
| M10020055001A | NST 41 | JJPX01.0061 | SE | Sep-10 |
| M10021286001A | NST 42 | JJPX01.0023 | SE | Sep-10 |
| M11007253001A | NST 43 | JJPX01.0742 | SE | Mar-11 |
| M11012736001A | NST 44 | JJPX01.0005 | SW | May-11 |
| M11030097001A | NST 45 | JJPX01.3896 | SW | Nov-11 |
| M09021254001A | NST 47 | JJPX01.0413 | SE | Sep-09 |
| M09029283001A | NST 51 | JJPX01.0238 | NE | Nov-09 |
Isolates are listed according to NST.
Pennsylvania regions are abbreviated as follows: SE, southeast; SC, south central; SW, southwest; NE, northeast; NC, nortc entral; NW, northwest.
All isolates were stored at −80°C in 20% glycerol. Isolates were grown overnight in 2 ml LB in a shaking incubator at 37°C. DNA was isolated using the Promega (Madison, WI) genomic DNA isolation kit, following the manufacturer's directions, and pellets were resuspended in 200 μl autoclaved, deionized water. DNA samples were stored at −20°C prior to PCR analysis. PFGE-XbaI analysis of all isolates was performed using standard protocols (35, 36).
PCR amplification.
Primers for amplification of all four genomic loci are listed in Table 2. PCRs were performed in a total volume of 25 μl: 1.5 μl template, 0.3 μl Taq (1.5 units; New England Bio Labs, Ipswich, MA), 0.2 μl 10 mM deoxynucleoside triphosphates (dNTPs), 1 μl of a 10 μM concentration of each primer, 2.5 μl of 10× Taq buffer, and 18.5 μl water. PCR conditions were as follows (the annealing temperatures [AT] are listed in Table 2): initial denaturation step of 10 min at 94°C, followed by 35 cycles of 1 min at 94°C, 1 min at the AT, and 1 min (for fimH and sseL) or 1.5 min (for CRISPR1 and CRISPR2) at 72°C, and a final extension step at 72°C for 8 min. PCR products were stored at −20°C. For the outbreak study, primer CRISPR1 (120) was used for PCR amplification of CRISPR1 instead of CRISPR1 (59).
Table 2.
Primers used for CRISPR-MVLST PCR and sequencing
| Marker | Orientation | Primer sequence (5′–3′) | Annealing temp (°C)a | Primer used for: |
|
|---|---|---|---|---|---|
| PCR | Sequencing | ||||
| CRISPR1-5 | Forward | TGAAAACAGACGTATTCCGGTAGATT | 55.5 | Yes | Yes |
| CRISPR1-1 | Reverse | CAGCATATTGACAAGGCGCT | Yes | Yes | |
| CRISPR1-6 | Forward | AATTGGGTAGATTTAGGGTGT | Yes | ||
| CRISPR2-3 | Forward | ATTGTTGCGATTATGTTGGT | 57 | Yes | Yes |
| CRISPR2-1 | Reverse | TCCAGCTCCCTTATGATTTT | Yes | ||
| CRISPR2-4 | Reverse | GCAATACCCTGATCCTTAACGCCA | Yes | ||
| fimH-1 | Forward | AGGTGAACTGTTCATCCAGTGG | 56.7 | Yes | Yes |
| fimH-2 | Reverse | GCGGGCTGAACAAAACACAA | Yes | Yes | |
| sseL-1 | Forward | AAAATCAGGTCTATGCCTGATTTAATATATC | 60 | Yes | |
| sseL-5 | Reverse | GGCTCTAAGTACTCACCATTACT | Yes | ||
| sseL-3 | Forward | ACCAGGAAACAGAGCAAAATGAATATATGT | Yes | ||
| sseL-4 | Forward | TTCTCTCGGTAAACTATCCTATTGGGC | Yes | ||
The annealing temperature is shown for the PCR primers.
DNA sequencing.
PCR products were treated with 10 units of exonuclease (New England BioLabs, Ipswich, MA) and 1 unit of Antarctic alkaline phosphatase (New England BioLabs, Ipswich, MA). The mixture was incubated for 40 min at 37°C to remove remaining primers and unincorporated dNTPs. The enzymes were inactivated by incubating the samples at 85°C for 15 min. Purified PCR products were sequenced at the Huck Institute's Nucleic Acid Facility at Pennsylvania State University by using 3′ BigDye-labeled dideoxynucleotide triphosphates (v. 3.1 dye terminators; Life Technologies, Carlsbad, CA) and run on an ABI 3730XL DNA analyzer, using the ABI data collection program (v. 2.0). Data were analyzed with ABI Sequencing Analysis software (v. 5.1.1). All genes were sequenced in both the forward and reverse directions to obtain double-stranded sequences for all loci. Primers used for sequencing are indicated in Table 2.
Sequence analysis and sequence type assignment.
Sequences were assembled and aligned using SeqMan and MegAlign (Lasergene 10; DNAStar, Madison, WI). The composition of spacers within a particular CRISPR locus defined the CRISPR allele and those not previously identified by our group were assigned a new numerical designation; these are highlighted in Table 3. For each isolate, the combination of allelic type at all four loci defined the Newport sequence type, or NST. Analyses of CRISPR1 and CRISPR2 were conducted using CRISPR-finder (http://crispr.u-psud.fr/Server/). Relationships between NSTs were calculated using BURST (www.pubmlst.org/analysis/), with a group definition of n − 1. The discriminatory power was calculated using the method described by Hunter and Gaston in 1988 (37), with strains defined as either unique NSTs or unique PFGE patterns. Unique PFGE patterns, or pulsotypes, were defined by PulseNet, using the Dice coefficient, and with an optimization of 1.5% and a position tolerance of 1.5%. The difference of one band was sufficient to call two PFGE patterns different. PFGE dendrograms were generated using BioNumerics v. 6.6.
Table 3.
List of all NSTs identified in this study, showing the allelic combination of all four markers, fimH, sseL, CRISPR1, and CRISPR2, that define each NST
| NST | Allelea |
|||
|---|---|---|---|---|
| fimH | sseL | CRISPR1 | CRISPR2 | |
| NST 7 | 4 | 17 | 101 | 130 |
| NST 8 | 5 | 17 | 110 | 131 |
| NST 9 | 3 | 56 | 111 | 133 |
| NST 10 | 5 | 17 | 112 | 134 |
| NST 11 | 3 | 56 | 112 | 132 |
| NST 12 | 5 | 17 | 113 | 135 |
| NST 13 | 5 | 17 | 114 | 131 |
| NST 14 | 5 | 57 | 7 | 136 |
| NST 15 | 5 | 17 | 115 | 131 |
| NST 16 | 3 | 56 | 116 | 137 |
| NST 17 | 5 | 17 | 103 | 11 |
| NST 18 | 5 | 17 | 7 | 138 |
| NST 19 | 5 | 57 | 119 | 139 |
| NST 20 | 3 | 56 | 181 | 132 |
| NST 21 | 5 | 57 | 7 | 139 |
| NST 22 | 5 | 17 | 103 | 140 |
| NST 23 | 5 | 17 | 109 | 11 |
| NST 24 | 3 | 56 | 121 | 142 |
| NST 25 | 5 | 17 | 122 | 143 |
| NST 27 | 3 | 56 | 123 | 142 |
| NST 29 | 5 | 17 | 7 | 144 |
| NST 30 | 5 | 17 | 113 | 145 |
| NST 31 | 4 | 17 | 101 | 146 |
| NST 32 | 3 | 55 | 101 | 148 |
| NST 33 | 3 | 56 | 124 | 150 |
| NST 34 | 3 | 56 | 181 | 152 |
| NST 35 | 5 | 17 | 125 | 11 |
| NST 36 | 5 | 17 | 7 | 153 |
| NST 37 | 4 | 17 | 101 | 147 |
| NST 38 | 5 | 17 | 126 | 11 |
| NST 39 | 5 | 17 | 127 | 154 |
| NST 41 | 4 | 17 | 101 | 151 |
| NST 42 | 3 | 56 | 7 | 139 |
| NST 43 | 3 | 56 | 111 | 142 |
| NST 44 | 5 | 17 | 110 | 155 |
| NST 45 | 3 | 56 | 128 | 157 |
| NST 46 | 3 | 56 | 121 | 132 |
| NST 47 | 3 | 56 | 161 | 202 |
| NST 48 | 3 | 56 | 162 | 142 |
| NST 49 | 5 | 17 | 163 | 204 |
| NST 50 | 51 | 17 | 164 | 203 |
| NST 51 | 3 | 56 | 180 | 149 |
New alleles identified in this study and assigned a new numerical identifier are shown in bold.
S. Newport outbreak analysis.
A summary of 20 outbreak isolates from 2012 is shown in Table 4. This sample set contained 10 S. Newport outbreak isolates that were associated with contaminated tomatoes and 10 sporadic case isolates, all of which were obtained by the Pennsylvania Department of Health in either June or July 2012. Of the 10 outbreak isolates, 9 were from clinical specimens and 1 (M12012100001) was from a tomato. The PFGE profiles and other outbreak data were kept blinded until the completion of CRISPR-MVLST analysis. The isolates were cultured as described above.
Table 4.
Salmonella serovar Newport isolates analyzed by CRISPR-MVLST and PFGE as part of the tomato outbreak studya
| Isolate | PFGE | CRISPR-MVLST | PA regionb | Isolation date |
|---|---|---|---|---|
| M12012060001A | JJPX01.0238 | NST 46 | OS | Jun-12 |
| M12012090001A | JJPX01.0238 | NST 46 | SE | Jun-12 |
| M12012292001A | JJPX01.0238 | NST 46 | SE | Jun-12 |
| M12012137001A | JJPX01.0238 | NST 46 | SE | Jun-12 |
| M12012364001A | JJPX01.0238 | NST 46 | SE | Jun-12 |
| M12012100001 | JJPX01.0238 | NST 46 | SE | Jun-12 |
| M12012372001A | JJPX01.0238 | NST 46 | SE | Jun-12 |
| M12012369001A | JJPX01.0238 | NST 46 | SE | Jun-12 |
| M12012471001A | JJPX01.0238 | NST 46 | SE | Jun-12 |
| M12012531001A | JJPX01.0238 | NST 46 | SE | Jun-12 |
| M12012312001A | JJPX01.0415 | NST 17 | SE | Jun-12 |
| M12012826001A | JJPX01.0413 | NST 47 | SE | Jun-12 |
| M12012889001A | JJPX01.0025 | NST 49 | SC | Jun-12 |
| M12012888001A | JJPX01.0011 | NST 14 | SC | Jun-12 |
| M12013292001A | JJPX01.0546 | NST 24 | SE | Jul-12 |
| M12014067001A | JJPX01.0011 | NST 14 | SE | Jul-12 |
| M12014796001A | JJPX01.0111 | NST 48 | SE | Jul-12 |
| M12014789001A | JJPX01.0061 | NST 7 | SE | Jul-12 |
| M12014624001A | JJPX01.0011 | NST 14 | SE | Jul-12 |
| M12014798001A | JJPX01.0301 | NST 50 | SE | Jul-12 |
Data shown in boldface indicate isolates that were part of the outbreak.
The region of a patient's residence is indicated as follows: SE, southeast Pennsylvania; SC, south central Pennsylvania; OS, out of state (New Jersey).
Nucleotide sequence accession numbers.
Sequences of the alleles that were identified in this study were submitted as a batch set to GenBank and assigned accession numbers KC993008 to KC993071.
RESULTS AND DISCUSSION
CRISPR-MVLST and sequence type distribution.
To quantify the discriminatory power of CRISPR-MVLST, we subtyped 84 S. Newport isolates that were systematically selected from the Pennsylvania Department of Health. To ensure that our data set represented an unbiased set of isolates, we subtyped isolates that were submitted to the Pennsylvania Health Department closest to the 1st and 15th of each month.
Among 84 S. Newport isolates, we identified 23 CRISPR1 alleles, 29 CRISPR2 alleles, 3 fimH alleles, and 4 sseL alleles. For both CRISPR loci, the majority of the alleles were new and had not been observed in our previous studies: 22 new CRISPR1 alleles and 28 new CRISPR2 alleles. We found three new sseL alleles, and all three fimH alleles had been previously observed in S. Newport isolates (15). The new alleles are highlighted in bold in Table 3.
The combined allelic variation of these four markers provided 38 unique S. Newport NSTs (Table 3). The most frequent NSTs were NST 14 (13.1% of all isolates), NST 20 (9.5%), and NST 17 (6.0%) (Fig. 1a). The majority of NSTs, 23/40, were represented by single isolates. The overwhelming genetic diversity among different NSTs was derived from polymorphisms in CRISPR1 and CRISPR2. In none of the 38 NSTs was the sole presence of a different fimH or sseL allele responsible for defining an NST. The distinction between NST 21 and NST 42 arises from differences at both fimH (alleles 5 and 3, respectively) and sseL (alleles 57 and 56, respectively) loci, even though the CRISPR loci are the same.
Fig 1.
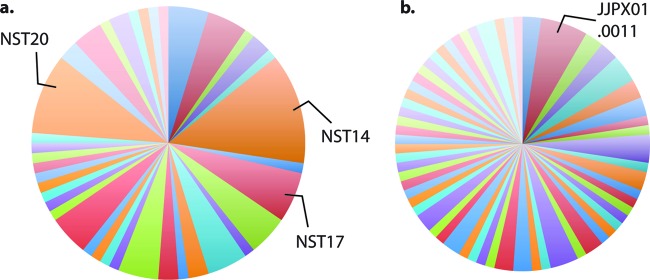
Discriminatory power (D) provided by CRISPR-MVLST and PFGE. Pie charts show the number of distinct groups that were defined by (a) CRISPR-MVLST (38 groups; D = 0.9597) or (b) PFGE (62 groups; D = 0.9907). The most frequent NSTs and PFGE patterns are indicated on the representative pie charts.
Discriminatory powers of CRISPR-MVLST and PFGE.
The unbiased method of isolate collection for this study allowed us to more accurately determine the discriminatory power of any given subtyping method. For this data set, CRISPR-MVLST identified 38 unique NSTs and yielded a discriminatory power of 0.9597 (Fig. 1a). PFGE profiling of the same isolates identified 62 unique patterns and provided a discriminatory power of 0.9907 (Fig. 1b). Both approaches yielded power that were >0.95, which complies with the conventional 5% level of acceptable probability (38). The comparative similarity in discriminatory powers between the two methodologies suggests that CRISPR-MVLST may be appropriate for use as a single subtyping method for outbreak investigations of S. Newport.
Relationships between NSTs and PFGE patterns.
Differences in CRISPR-MVLST occur through vertical transmission, and differences in PFGE patterns arise largely through horizontal gene transmission. Given these differences, we wanted to investigate whether any relationships existed between specific NSTs and specific PFGE profiles. We first separately determined the relationships among different NSTs and the relationships among different PFGE patterns. BURST analysis of the 38 NSTs generated eight groups, each consisting of 2 to 5 NSTs, plus a collection of singletons that BURST was unable to assign to a group (Fig. 2). Each group comprised a core NST that was surrounded by NSTs that differed from the core by one allele. For example, in group 5, NST 8 was the core NST and NSTs 13, 15, and 44 each shared three alleles with NST 8. We next overlaid our PFGE data to identify isolates from different NSTs that were related by pulsotype. PFGE patterns are shown as colored ovals on the BURST groups in Fig. 2. In the majority of cases, identical PFGE patterns were found in isolates that had closely related NSTs, such as JJPX01.0267 and JJPX01.0005 (NSTs 7 and 31 and NSTs 8 and 44, respectively), suggesting a correlation between PFGE patterns and CRISPR-MVLST results.
Fig 2.
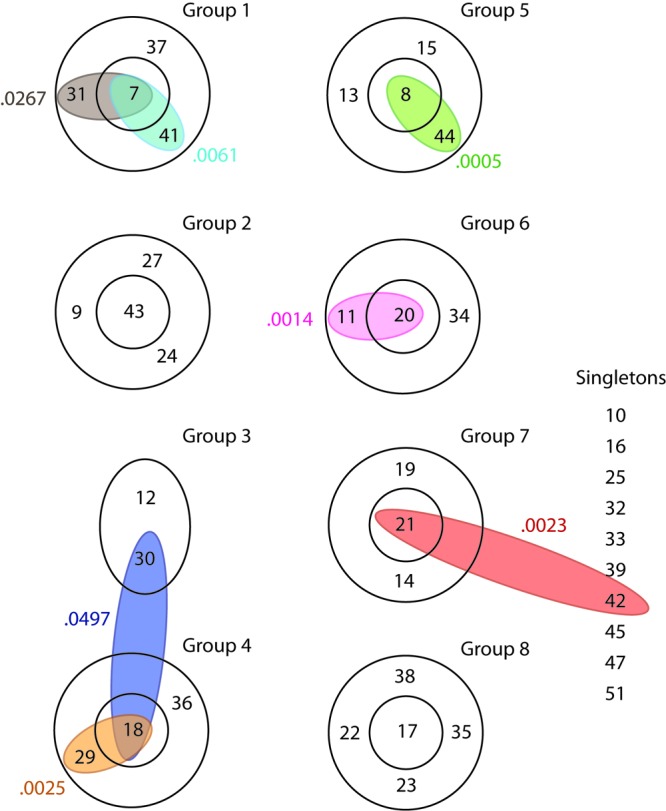
Closely related NSTs share PFGE patterns. BURST analysis revealed the relationships between different NSTs. Within a BURST group, the NSTs in the outer ring differ from the core NST at one of the four CRISPR-MVLST loci. NSTs that could not be assigned to a group are listed as singletons. Individual PFGE patterns that were found in isolates that had different NSTs are shown as colored ovals, and the PFGE pulsotype is indicated by the numbers that follow JJPX01, i.e., JJPX01.0061 is shown as 0.0061.
Following this analysis, we performed the opposite analysis and created a dendrogram showing the relatedness of all the PFGE patterns identified in this study. We next overlaid our NST data, focusing only on NST groups containing isolates with multiple PFGE profiles (Fig. 3). Similar to the previous analysis, we found that isolates related by CRISPR-MVLST had similar PFGE patterns.
Fig 3.
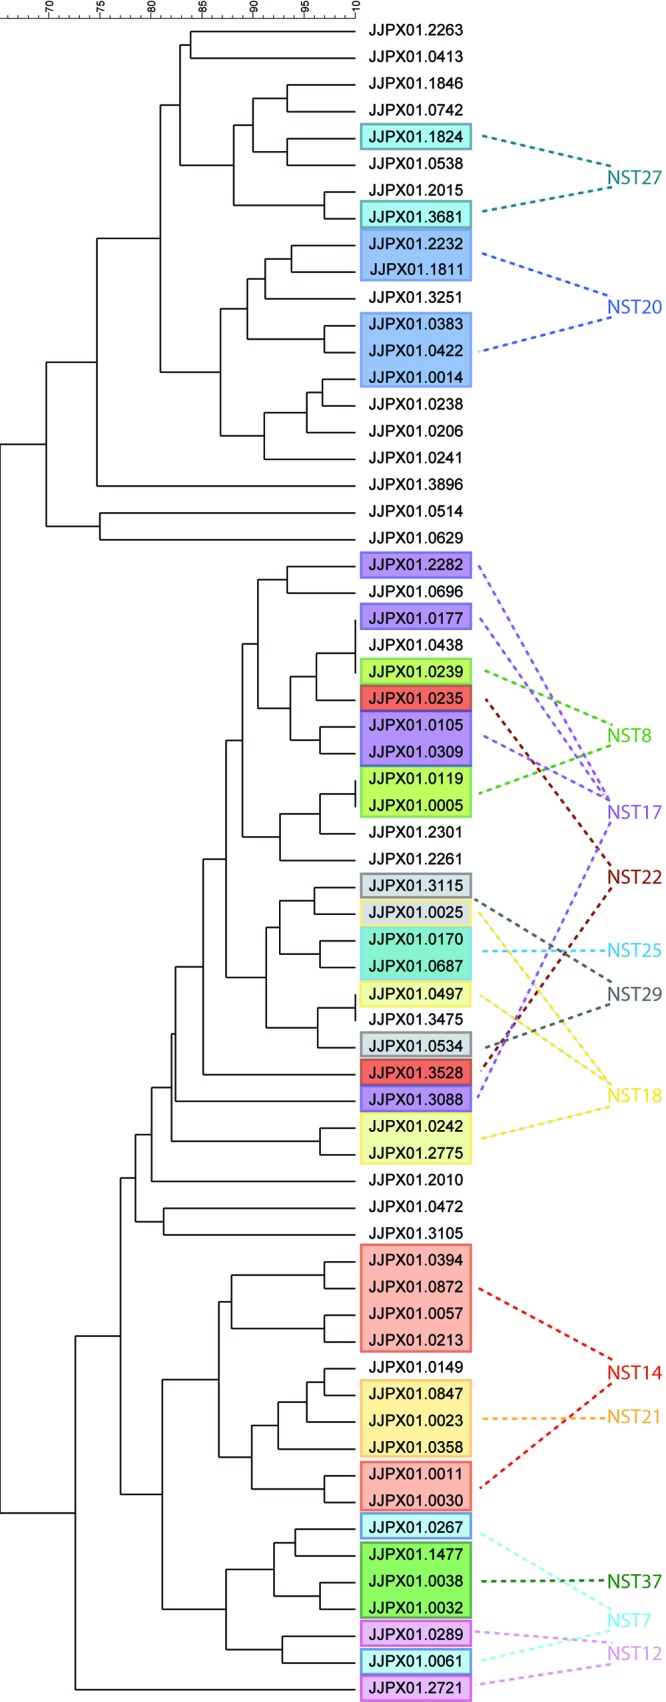
Closely related PFGE patterns share NSTs. The dendrogram shows the relationship among the 62 PFGE patterns identified in this study. Single NSTs that were found in isolates with different PFGE pulsotypes are shown in colored boxes.
We then extended our analyses to individually plot all NSTs of a BURST group onto the dendrogram and found that for five out of the eight groups, these NSTs clustered into distinct regions, as determined by the Dice coefficient (Fig. 4). For groups 4 and 8, the NSTs did cluster, but the PFGE patterns within the groups were not as closely related as those within BURST groups 1, 2, 5, 6, and 7. This is the first time that PFGE patterns have been compared to CRISPR-MVLST sequence types, and our data show that the two methods are strongly correlated. This is surprising, given the distinct mechanisms that drive diversity for CRISPR-MVLST and PFGE.
Fig 4.

Correlation of CRISPR-MVLST and PFGE data. Individual PFGE dendrograms, comprising portions from the full dendrogram in Fig. 3, show all the NSTs from within a single BURST group. This analysis included all groups from Fig. 2, with the exception of group 3 and the singleton NSTs. Group 3 was excluded because it did not contain a core NST.
Analysis of Salmonella serovar Newport outbreak isolates by CRISPR-MVLST and PFGE.
Our next objective was 2-fold: first, to test CRISPR-MVLST using isolates from a single outbreak to validate that this subtyping method works in an actual outbreak scenario, and second, to see how CRISPR-MVLST compares to PFGE. There was a salmonellosis outbreak during the summer of 2012 in Pennsylvania that was associated with S. Newport contamination of tomatoes, and it affected 37 persons. The outbreak strain was also identified in one food sample. We performed CRISPR-MVLST analysis in a blinded study of 20 clinical S. Newport isolates that were collected during June and July 2012 by the Pennsylvania Department of Health. These isolates included 10 outbreak isolates and 10 sporadic case-control isolates (which were collected during the same time frame and from the same regions of Pennsylvania). We successfully separated the outbreak isolates from control isolates by CRISPR-MVLST: all 10 outbreak isolates shared the same NST (NST 46) and same PFGE pattern (JJPX01.0238) (Tables 3 and 4). Importantly, NST 46 was not observed among the remaining 10 sporadic isolates also analyzed, nor was it found in the original set of 84 isolates. Interestingly, the same PFGE pattern, JJPX01.0238, occurred in one of the isolates analyzed earlier in the work, M09029283001A. This isolate was isolated in 2009, 3 years prior to the outbreak, and bears NST 51, which differs from NST 46 at two of the four CRISPR-MVLST loci. This suggests that in this particular case, CRISPR-MVLST is more discriminatory than PFGE. The 10 outbreak isolates were also analyzed by MLVA, based on new protocols being developed by the CDC for analysis of S. Newport. Nine of the isolates clustered together, and one was an outlier, although this only differed at one of the six loci (E. Trees, unpublished data). Collectively, though a small and thus limited study, this outbreak study does show remarkable congruence between CRISPR-MVLST and PFGE and excellent concordance between both of these methods and the conventional epidemiologic data. Further investigations on additional outbreak isolates are required to fully determine the utility of CRISPR-MVLST.
Rapid CRISPR profiling based on amplicon size.
Variations in the numbers and compositions of spacers within different CRISPR alleles result in different-sized CRISPR PCR products. By virtue of this observation, it has been suggested and shown by Weill and colleagues that size determination by simple gel electrophoresis of CRISPR amplicons can provide rapid initial typing of S. Typhimurium isolates (27). This screening approach would be particularly valuable during the midst of an outbreak and in public health laboratories in developing countries where the resources for PFGE or other in-depth subtyping techniques do not exist. To test this hypothesis in S. Newport, we examined the PCR product sizes for both CRISPR loci of isolates that represented each of the nine NSTs identified in the tomato outbreak study. As can be seen in Fig. 5, by using the combination of the PCR product sizes for CRISPR1 and CRISPR2, we were able to separate the outbreak strains (lanes 2 and 3) from the remaining strains. Although NST 46 and NST 24 isolates shared the same-sized CRISPR1 allele (compare lanes 2 and 3 with lane 7 in the top gel), these two sequence types had different-sized CRISPR2 alleles (compare the same lanes in the lower gel), confirming that size inspection of both CRISPR alleles can be used for rapid subtype screening. This approach is rapid, independent of serotyping, and could be cheaply implemented in developing countries, where equipment for sequence analysis and PFGE may not be readily accessible.
Fig 5.

Rapid separation of Salmonella serovar Newport isolates based on size of CRISPR PCR products. PCR products of CRISPR1 (top) and CRISPR2 (bottom) were run on 1.2% agarose gels. Samples NST 46-1 and NST 46-2 are two different representative isolates from the tomato outbreak and share the same PCR product sizes at both loci. The other lanes correspond to single representatives of the remaining eight NSTs. The size differences between CRISPR1 NST 24 and NST 48 and between CRISPR2 NST 17 and NST 47 represent a single spacer repeat unit (or 61 bp). M, marker. The molecular sizes (in kb) of the marker are shown to the right.
The data presented here show that both CRISPR-MVLST and PFGE have good discriminatory powers, as demonstrated among a broad set of S. Newport isolates. Although PFGE is slightly better than CRISPR-MVLST (0.9907 versus 0.9597, respectively), the latter showed good epidemiological concordance, as it could be used to group outbreak-related isolates and separate temporarily associated sporadic cases from the outbreak isolates. Our in-depth analyses also showed good correlation between related NSTs and PFGE patterns and vice versa. There are several advantages to using CRISPR-MVLST over PFGE. First, CRISPR-MVLST is one of the faster methods for Salmonella subtyping (39); including the DNA isolation step, it takes ∼15 h to complete CRISPR-MVLST, whereas, at a minimum, PFGE takes 24 h. This decrease in time requirement would be beneficial during the course of an outbreak. Second, CRISPR analysis of several Salmonella serovars showed that these loci display distinct spacer contents, such that sequence analysis of the spacers can be used to determine the particular serovar (15, 27, 28). Thus, CRISPR-MVLST could provide a one-shot approach that could be used for both serotyping of Salmonella and subtyping to the strain level. This would be advantageous, given the expense and occasional difficulty in maintaining the pool of somatic and flagella antisera for complete Salmonella subtyping. Third, although PFGE data are uploaded to the national PulseNet Salmonella database, interlaboratory data interpretation can be challenging due to small differences in banding patterns. CRISPR-MVLST data are, on the other hand, represented unambiguously by nucleotide sequences. Further benefits of CRISPR-MVLST are the potential automation of the procedure, the ability to conduct this analysis in a high-throughput manner, and sequence data that are inherently more tractable for downstream applications, such as phylogenetic and evolutionary analyses, than are PFGE data.
In summary, given the similarities in discriminating unrelated strains by both methods and the advantages that are proffered by CRISPR-MVLST, we have shown the latter as a complementary method for rapid and accurate subtyping of S. Newport isolates.
ACKNOWLEDGMENTS
We thank Stephen Knabel for critically reading the manuscript and Sara Lomonaco for helpful discussions. We also acknowledge the Huck Institute's Nucleic Acid Facility at Penn State University.
This study was supported by a U.S. Army Research Office grant to E.G.D. (W911NF-11-1-0442).
Footnotes
Published ahead of print 15 May 2013
REFERENCES
- 1. Hoffmann S, Batz MB, Morris JG., Jr 2012. Annual cost of illness and quality-adjusted life year losses in the United States due to 14 foodborne pathogens. J. Food Prot. 75:1292–1302 [DOI] [PubMed] [Google Scholar]
- 2. Scharff RL. 2012. Economic burden from health losses due to foodborne illness in the United States. J. Food Prot. 75:123–131 [DOI] [PubMed] [Google Scholar]
- 3. Centers for Disease Control and Prevention 2009. National Salmonella surveillance annual summary 2009. Centers for Disease Control and Prevention, Atlanta, GA: http://www.cdc.gov/ncidod/dbmd/phlisdata/salmonella.htm Accessed 4 March 2013 [Google Scholar]
- 4. Centers for Disease Control and Prevention 2013. Salmonella home page. Centers for Disease Control and Prevention, Atlanta, GA: http://www.cdc.gov/salmonella/general/technical.html Accessed 11 January 2013 [Google Scholar]
- 5. Centers for Disease Control and Prevention 2013. Reports of selected Salmonella outbreak investigations. Centers for Disease Control and Prevention, Atlanta, GA: http://www.cdc.gov/salmonella/outbreaks.html Accessed 25 January 2013 [Google Scholar]
- 6. Larsson JT, Torpdahl M, Petersen RF, Sørensen G, Lindstedt BA, Nielsen EM. 2009. Development of a new nomenclature for Salmonella Typhimurium multilocus variable number of tandem repeats analysis (MLVA). Euro Surveill. 14(15):pii=19174. http://www.eurosurveillance.org/ViewArticle.aspx?ArticleId=19174 [PubMed] [Google Scholar]
- 7. Torpdahl M, Sørensen G, Lindstedt BA, Nielsen EM. 2007. Tandem repeat analysis for surveillance of human Salmonella Typhimurium infections. Emerg. Infect. Dis. 13:388–395 [DOI] [PMC free article] [PubMed] [Google Scholar]
- 8. Beranek A, Mikula C, Rabold P, Arnhold D, Berghold C, Lederer I, Allerberger F, Kornschober C. 2011. Assessment of the application of variable-number tandem repeat loci of Salmonella Enteritidis in subtyping multiple-locus variable-number tandem repeat analysis. Int. J. Med. Microbiol. 45:516–521 [DOI] [PubMed] [Google Scholar]
- 9. Hopkins KL, Peters TM, De Pinna E, Wain J. 2011. Standardisation of multilocus variable-number tandem-repeat analysis (MLVA) for subtyping of Salmonella enterica serovar Enteritidis. Euro Surveill. 16(32):pii:19942. http://www.eurosurveillance.org/ViewArticle.aspx?ArticleId=19942 [PubMed] [Google Scholar]
- 10. Malorny B, Junker E, Helmuth R. 2008. Multi-locus variable-number tandem repeat analysis for outbreak studies of Salmonella enterica serotype Enteritidis. BMC Microbiol. 8:84. 10.1186/1471-2180-8-84 [DOI] [PMC free article] [PubMed] [Google Scholar]
- 11. Dewaele I, Rasschaert G, Bertrand S, Wildemauwe C, Wattiau P, Imberechts H, Herman L, Ducatelle R, De Reu K, Heyndrickx M. 2012. Molecular characterization of Salmonella Enteritidis: comparison of an optimized multi-locus variable-number of tandem repeat analysis (MLVA) and pulsed-field gel electrophoresis. Foodborne Pathog. Dis. 9:885–895 [DOI] [PubMed] [Google Scholar]
- 12. Octavia S, Lan R. 2009. Multiple-locus variable-number tandem-repeat analysis of Salmonella enterica serovar Typhi. J. Clin. Microbiol. 47:2369–2376 [DOI] [PMC free article] [PubMed] [Google Scholar]
- 13. Van Cuyck H, Farbos-Granger A, Leroy P, Yith V, Guillard B, Sarthou JL, Koeck JL, Kruy SL. 2011. MLVA polymorphism of Salmonella enterica subspecies isolated from humans, animals, and food in Cambodia. BMC Res. Notes 4:306. 10.1186/1756-0500-4-306 [DOI] [PMC free article] [PubMed] [Google Scholar]
- 14. Davis MA, Baker KNK, Call DR, Warnick LD, Soyer Y, Wiedmann M, Gröhn Y, McDonough PL, Hancock DD, Besser TE. 2009. Multilocus variable-number tandem-repeat method for typing Salmonella enterica serovar Newport. J. Clin. Microbiol. 47:1934–1938 [DOI] [PMC free article] [PubMed] [Google Scholar]
- 15. Liu F, Barrangou R, Gerner-Smidt P, Ribot EM, Knabel SJ, Dudley EG. 2011. Novel virulence gene and clustered regularly interspaced short palindromic repeat (CRISPR) multilocus sequence typing scheme for subtyping of the major serovars of Salmonella enterica subsp. enterica. Appl. Environ. Microbiol. 77:1946–1956 [DOI] [PMC free article] [PubMed] [Google Scholar]
- 16. Touchon M, Rocha EPC. 2010. The small, slow and specialized CRISPR and anti-CRISPR of Escherichia and Salmonella. PLoS One 5:e11126. 10.1371/journal.pone.0011126 [DOI] [PMC free article] [PubMed] [Google Scholar]
- 17. Bhaya D, Davison M, Barrangou R. 2011. CRISPR-Cas systems in bacteria and archaea: versatile small RNAs for adaptive defense and regulation. Annu. Rev. Genet. 45:273–297 [DOI] [PubMed] [Google Scholar]
- 18. Wiedenheft B, Sternberg SH, Doudna JA. 2012. RNA-guided genetic silencing systems in bacteria and archaea. Nature 482:331–338 [DOI] [PubMed] [Google Scholar]
- 19. Tyson GW, Banfield JF. 2008. Rapidly evolving CRISPRs implicated in acquired resistance of microorganisms to viruses. Environ. Microbiol. 10:200–207 [DOI] [PubMed] [Google Scholar]
- 20. Andersson AF, Banfield JF. 2008. Virus population dynamics and acquired virus resistance in natural microbial communities. Science 320:1047–1050 [DOI] [PubMed] [Google Scholar]
- 21. Barrangou R, Fremaux C, Deveau H, Richards M, Boyaval P, Moineau S, Romero DA, Horvath P. 2007. CRISPR provides acquired resistance against viruses in prokaryotes. Science 315:1709–1712 [DOI] [PubMed] [Google Scholar]
- 22. Groenen PM, Bunschoten AE, Van Soolingen D, Van Embden JDA. 1993. Nature of DNA polymorphism in the direct repeat cluster of Mycobacterium tuberculosis; application for strain differentiation by a novel typing method. Mol. Microbiol. 10:1057–1065 [DOI] [PubMed] [Google Scholar]
- 23. Kamerbeek J, Schouls LM, Kolk A, Van Agterveld M, Van Soolingen D, Kuijper S, Bunschoten AE, Molhuizen H, Shaw R, Goyal M, van Embden J. 1997. Simultaneous detection and strain differentiation of Mycobacterium tuberculosis for diagnosis and epidemiology. J. Clin. Microbiol. 35:907–914 [DOI] [PMC free article] [PubMed] [Google Scholar]
- 24. Hoe N, Nakashima K, Grigsby D, Pan X, Dou SJ, Naidich S, Garcia M, Kahn E, Bergmire-Sweat D, Musser JM. 1999. Rapid molecular genetic subtyping of serotype M1 group A Streptococcus strains. Emerg. Infect. Dis. 5:254–263 [DOI] [PMC free article] [PubMed] [Google Scholar]
- 25. Schouls LM, Reulen S, Duim B, Wagenaar JA, Willems RJL, Dingle KE, Colles FM, Van Embden JDA. 2003. Comparative genotyping of Campylobacter jejuni by amplified fragment length polymorphism, multilocus sequence typing, and short repeat sequencing: strain diversity, host range, and recombination. J. Clin. Microbiol. 41:15–26 [DOI] [PMC free article] [PubMed] [Google Scholar]
- 26. Liu F, Kariyawasam S, Jayarao BM, Barrangou R, Gerner-Smidt P, Ribot EM, Knabel SJ, Dudley EG. 2011. Subtyping Salmonella enterica serovar Enteritidis isolates from different sources by using sequence typing based on virulence genes and clustered regularly interspaced short palindromic repeats (CRISPRs). Appl. Environ. Microbiol. 77:4520–4526 [DOI] [PMC free article] [PubMed] [Google Scholar]
- 27. Fabre L, Zhang J, Guigon G, Le Hello S, Guibert V, Accou-Demartin M, De Romans S, Lim C, Roux C, Passet V, Diancourt MG, Guibourdenche M, Issenuth-Jeanjean S, Achtman M, Brisse S, Sola C, Weill F. 2012. CRISPR typing and subtyping for improved laboratory surveillance of Salmonella infections. PLoS One 7:e36995. 10.1371/journal.pone.0036995 [DOI] [PMC free article] [PubMed] [Google Scholar]
- 28. Shariat N, DiMarzio MJ, Yin S, Dettinger L, Sandt CH, Lute JR, Barrangou R, Dudley EG. 2013. The combination of CRISPR-MVLST and PFGE provides increased discriminatory power for differentiating human clinical isolates of Salmonella enterica subsp. enterica serovar Enteritidis. Food Microbiol. 34:164–173 [DOI] [PubMed] [Google Scholar]
- 29. Delannoy S, Beutin L, Burgos Y, Fach P. 2012. Specific detection of enteroaggregative hemorrhagic Escherichia coli O104:H4 strains by use of the CRISPR locus as a target for a diagnostic real-time PCR. J. Clin. Microbiol. 50:3485–3492 [DOI] [PMC free article] [PubMed] [Google Scholar]
- 30. Delannoy S, Beutin L, Fach P. 2012. Use of clustered regularly interspaced short palindromic repeat sequence polymorphisms for specific detection of enterohemorrhagic Escherichia coli strains of serotypes O26:H11, O45:H2, O103:H2, O111:H8, O121:H19, O145:H28, and O157:H7 by real-time PCR. J. Clin. Microbiol. 50:4035–4040 [DOI] [PMC free article] [PubMed] [Google Scholar]
- 31. Chen Y, Zhang W, Knabel SJ. 2007. Multi-virulence-locus sequence typing identifies single nucleotide polymorphisms which differentiate epidemic clones and outbreak strains of Listeria monocytogenes. J. Clin. Microbiol. 45:835–846 [DOI] [PMC free article] [PubMed] [Google Scholar]
- 32. Lomonaco S, Chen Y, Knabel SJ. 2008. Analysis of additional virulence genes and virulence gene regions in Listeria monocytogenes confirms the epidemiologic relevance of multi-virulence-locus sequence typing. J. Food Prot. 71:2559–2566 [DOI] [PubMed] [Google Scholar]
- 33. Zhang W, Jayarao BM, Knabel SJ. 2004. Multi-virulence-locus sequence typing of Listeria monocytogenes. Appl. Environ. Microbiol. 70:913–920 [DOI] [PMC free article] [PubMed] [Google Scholar]
- 34. Endo T, Ikeo K, Gojobori T. 1996. Large-scale search for genes on which positive selection may operate. Mol. Biol. Evol. 13:685–690 [DOI] [PubMed] [Google Scholar]
- 35. Ribot EM, Fair MA, Gautom R, Cameron DN, Hunter SB, Swaminathan B, Barrett TJ. 2006. Standardization of pulsed-field gel electrophoresis protocols for the subtyping of Escherichia coli O157:H7, Salmonella, and Shigella for PulseNet. Foodborne Pathog. Dis. 3:59–67 [DOI] [PubMed] [Google Scholar]
- 36. Sandt CH, Krouse DA, Cook CR, Hackman AL, Chmielecki WA, Warren NG. 2006. The key role of pulsed-field gel electrophoresis in investigation of a large multiserotype and multistate food-borne outbreak of Salmonella infections centered in Pennsylvania. J. Clin. Microbiol. 44:3208–3212 [DOI] [PMC free article] [PubMed] [Google Scholar]
- 37. Hunter PR, Gaston MA. 1988. Numerical index of the discriminatory ability of typing systems: an application of Simpson's index of diversity. J. Clin. Microbiol. 26:2465–2466 [DOI] [PMC free article] [PubMed] [Google Scholar]
- 38. Struelens MJ. 1996. Consensus guidelines for appropriate use and evaluation of microbial epidemiologic typing systems. Clin. Microbiol. Infect. 2:2–11 [DOI] [PubMed] [Google Scholar]
- 39. Wattiau P, Boland C, Bertrand S. 2011. Methodologies for Salmonella enterica subsp. enterica subtyping: gold standards and alternatives. Appl. Environ. Microbiol. 77:7877–7885 [DOI] [PMC free article] [PubMed] [Google Scholar]