Abstract
Comprehensive two dimensional GC (GC×GC), coupled to either a time of flight MS (TOF-MS) or a fast scanning quadrupole MS (qMS) has greatly increased the peak capacity and separation space compared to conventional GC-MS. However, commercial GC×GC-TOFMS systems are not equipped with chemical ionization (CI) and do not provide dominant molecular ions or enable single ion monitoring for maximal sensitivity. A GC×GC-qMS in mass scanning mode was investigated with EI and positive CI (PCI), using CH4 and NH3 as reagent gases. Compared to EI, PCI-NH3 produced more abundant molecular ions and high mass structure specific ions for steroid acetates. Chromatography in two dimensions was optimized with a mixture of 12 endogenous and 3 standard acetylated steroids (SM15-AC) relevant to doping control. Eleven endogenous target steroid acetates were identified in normal urine based on their two retention times, and EI and PCI-NH3 mass spectra; nine of these endogenous target steroid acetates were identified in congenital adrenal hyperplasia (CAH) patients. The difference between the urinary steroids profiles of normal individuals and from a CAH patient can easily be visually distinguished by their GC×GC-qMS chromatograms. We focus here on the comparison and interpretation of the various mass spectra of the targeted endogenous steroids. PCI-NH3 mass spectra were most useful for unambiguous molecular weight determination and for establishing the number of -OH by the losses of 1 or more acetate groups. We conclude that PCI-NH3 with GC×GC-qMS provides improved peak capacity and pseudomolecular ions with structural specificity.
Keywords: anabolic androgenic steroids, comprehensive two dimensional gas chromatography, quadrupole mass spectrometry, electron impact ionization, positive chemical ionization
Introduction
Gas chromatography electron impact mass spectrometry (GC-(EI)-MS) has been used for almost 40 years testing for anabolic androgenic steroids (AAS) in antidoping tests since the first use of capillary columns for steroid analysis was published by Vollmin in 19721. The development of GC-(EI)-MS showed steady progress over these years resulting in the inexpensive and robust bench-top systems in use today. However, GC-(EI)-MS analysis of complex mixtures of steroids extracted from urine, is limited by separation efficiency and production of ions characteristic of the molecular weight2–9. Alternatively, GC coupled to tandem MS (GC/MS/MS) has improved detection limits and compound identification has been used for steroid analysis in recent years, but still requires targeted analysis10–13.
The development of comprehensive two dimensional GC (GC×GC), coupled to either a time of flight MS (TOF-MS) or a fast scanning quadrupole MS (qMS) has greatly increased the peak capacity and separation space to improve analysis of complex samples. GC×GC employs two columns in tandem with orthogonal stationary phases, where the first column separates normally (~30–60 min) and the second column separates cryogenic trapped slices that are released after the first column very rapidly (every 2–10 seconds). GC×GC generally results in an order-of-magnitude increase in separation capacity over traditional GC and an increase in signal to noise (S/N) when used with a cryogenic modulator. In recent years, GC×GC-TOFMS has been explored for steroid analysis.14–17 The significantly less expensive and smaller footprint GC×GC-qMS has the advantage of additional technical capabilities, such as positive chemical ionization (PCI) and negative chemical ionization (NCI). GC×GC-qMS has been successfully applied to analysis of bacterial lipids18, environmental contaminants19, essential oils20, and gasoline21 using EI.
PCI-MS emerged from pioneering work on ion/molecule reactions in the 1960s by Munson and Field22. It is now an optional feature on many commercially available mass spectrometers and is performed using reagent gas plasmas to ionize sample molecules. For generation of positive ion mass spectra, the most common reagent gases are CH4, C4H10, and NH3. In PCI, the reagent gas is ionized by EI, followed by ion-molecule reactions that produce primary and secondary reagent ions such as CH5+ and C2H5+ with CH4, C3H7+ and C4H9+ with C4H10 and NH4+ with NH3, all of which are excellent proton donors. These ions react with the analyte molecules (M), in fast acid/base reactions, or subsequently fragment to yield a limited number of product ions.23 CH4 is the strongest proton donor commonly used, with a proton affinity (PA) of 546 kJ/mol. For softer ionization, isobutane (C4H10 ; PA = 824 kJ/mol) and NH3 (PA = 858 kJ/mol) are frequently used 24. Due to the lower excess energy transfer than in EI, PCI produces simpler mass spectra with less molecular fragmentation and more abundant and easily identifiable molecular ions than EI. PCI mass spectra concentrate more ion signal in fewer m/z peaks and aids in molecular weight determination due to the intense (pseudo)-molecular ions formed from protonation [M+H]+, hydride abstraction [M−H]+, or adduct formation [M+NH4]+ (for ammonia) that are typically observed.
Early on, Lin et al23 reported PCI-MS of free steroids using ammonia as reagent gas ((PCI-NH3)-MS) and showed simple ions that provide information about molecular weight, as well as functionalities in the molecules for cholesterol and its derivatives in 1980. Subsequently, Lusby et al2 presented (PCI-NH3)-MS as the method of choice for MS analysis of sterol esters after comparison of three reagent gases, CH4, C4H10, and NH3. In 1992, Rezanka et al25 demonstrated that more than 30 sterols in a complex sample, such as alga and yeast, can be detected using (PCI-NH3)-MS due to its high sensitivity and abundant molecular ion information.
Here we report an evaluation of a novel commercial GC×GC coupled to fast qMS with PCI-NH3 (GC×GC-(PCI-NH3)-qMS) to analyze complex urinary steroid extract samples with high specificity as a potentially useful technique for as an untargeted screening of urinary steroid profiles. Urinary steroid preparation methods common to antidoping analysis are applied to test human urine samples.
Experimental
Chemicals and Standard Mixtures
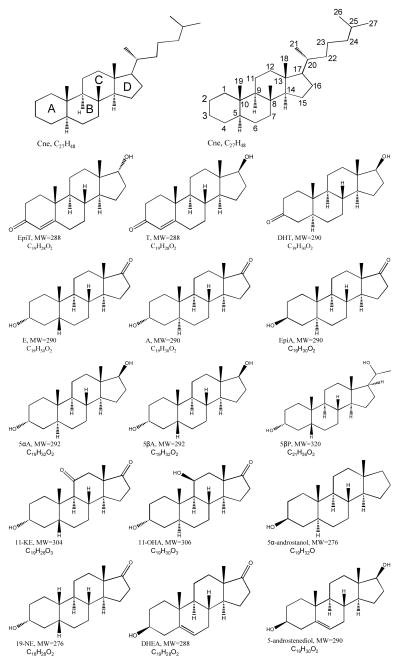
High purity He (99.999%) and NH3 (99.9995%) were purchased from Airgas East (Salem, NH). High purity CH4 (99.999%) was purchased from Matheson Tri-Gas (Twinsburg, OH). A mixture of 15 steroids shown in Table 1 (SM15) was prepared. Twelve target endogenous steroids were used: 5β-androstan-3α-ol-17-one (etiocholanolone, E), 5α-androstan-3α-ol-17-one (androsterone, A), 5-androsten-3β-ol-17-one (dehydroepiandrosterone, DHEA), 5β-androstan-3α-ol-11, 17-dione (11-ketoetiocholanolone, 11KE), 5α-androstan-17β-ol-3-one (dihydrotestosterone, DHT), 5β-androstan-3α, 17β-diol (5βA), 5α-androstan-3α, 17β-diol (5αA), 4-androsten-17α-ol-3-one (epitestosterone, EpiT), 4-androsten-17β-ol-3-one (testosterone, T), 5α-androstan-3α, 11β-diol-17-one (11β-hydroxyandrosterone, 11-OHA), 5β-pregnane-3α,20α-diol (5β-pregnanediol, 5βP), and 5β-estran-3α-ol-17-one (19-Noretiocholanolone, 19NE). One endogenous steroid normally present in urine at low concentration as a glucuronide conjugate, 5α-androstane-3β-ol-17-one (epiandrosterone, EpiA), and two exogenous steroids, 5α-androstan-3β-ol (5α-androstanol) and 5α-cholestane (Cne), were used as internal standards. Other steroid standards were: 5β-pregnane-3α, 17,20α-triol (pregnanetriol), 5β-pregnane-3α, 17, 20α-triol-11-one (pregnanetriolone), 5-pregnen-3β, 17-diol-20-one (17α-hydroxypregnenolone), and 4-pregnen-17-ol-3, 20-dione acetate (17α-progesterone-AC). All steroids were of 99% purity, and were purchased from Steraloids (Newport, RI) and used without further purification. SM15 structures, molecular weight (MW), their acetate molecular weight (MWAC) are shown in Figure 1. Chromabond® C18 cartridges (500 mg, 6 mL) were obtained from Macherey-Nagel (Bethlehem, PA). HPLC grade 2-propanol and methanol were obtained from Mallinckrodt Baker (Phillipsburg, NJ). The steroid mixture was prepared in HPLC grade 2-propanol at a concentration of 2 ng/μL for each steroid in the mixture. Pyridine, acetic anhydride, tert-butylmethylether (TBME), β-glucuronidase from Escherichia coli, sodium phosphate buffer (0.2M, pH=7), and potassium carbonate buffer (K2CO3/KHCO3 1:1, w/w, 200 g/L) were purchased from Sigma-Aldrich (St. Louis, MO). All solvents and reagents were of analytical grade.
Table 1.
PCI- NH3 GC×GC-qMS mass spectra interpretation, including m/z ion masses and relative intensities of these ion masses, for endogenous steroids and internal standards in SM15-AC mixture in urine matrix.
| PCI-NH3
| ||||||||||||
|---|---|---|---|---|---|---|---|---|---|---|---|---|
| Steroid | Molecular Weight | [M+NH4]+ | [M+H]+ | [M-OH]+ | [MH-CH3CO]+ | [MH-CH3COOH]+ | [MH-H2O-CH3COOH]+ | [MH- 2CH3CO]+ | [MH-2CH3COOH]+ | M+ | Others | Ratio [M+NH4]+/[M+H]+ |
|
| ||||||||||||
| E-AC | 332 | 350(100) | 333(7) | 315(29) | 290(35) | 273(58) | 255(21) | 14.3 | ||||
| A-AC | 332 | 350(100) | 333(20) | 315(9) | 290(40) | 273(57) | 255(22) | 5.0 | ||||
| DHEA-AC | 330 | 348(49) | 331(4) | 288(74) | 271(100) | 253(13) | 12.3 | |||||
| 11KE-AC | 346 | 364(41) | 347(3) | 304(14) | 287(100) | 13.7 | ||||||
| DHT-AC | 332 | 350(100) | 333(41) | 290(19) | 273(22) | 255(3) | 2.4 | |||||
| EpiT-AC | 330 | 348(3) | 331(100) | 288(2) | 271(4) | 0.03 | ||||||
| T-AC | 330 | 348(3) | 331(100) | 288(3) | 271(2) | 0.03 | ||||||
| 11OHA-AC | 348 | 366(79) | 349(35) | 331(54) | 306(17) | 289(21) | 271(100) | 2.3 | ||||
| 5α-Androstanol-AC | 318 | 336(48) | 319(5) | 276(21) | 259(100) | 9.6 | ||||||
| EpiA-AC | 332 | 350(100) | 333(27) | 315(12) | 290(37) | 273(45) | 255(22) | 3.7 | ||||
| 19NE-AC | 318 | 336(100) | 319(23) | 301(15) | 276(35) | 259(59) | 241(16) | 4.3 | ||||
|
| ||||||||||||
| 5βA-DiAC | 376 | 394(98) | 334(7) | 317(78) | 274(4) | 257(100) | ∞ | |||||
| 5αA-DiAC | 376 | 394(33) | 377(2) | 334(6) | 317(90) | 274(8) | 257(100) | 16.5 | ||||
| 5βP-DiAC | 404 | 422(37) | 362(14) | 345(28) | 285(100) | ∞ | ||||||
|
| ||||||||||||
| Cne | 372 | 372(100) | 357(53) | |||||||||
Figure 1.
Chemical structures of the SM15 native steroids.
SM15 was prepared by dissolving an equal amount of each steroid (~1 mg) in 1 mL 2-propanol and diluted to a concentration of 100 ng/μL. A 200 μL aliquot of SM15 (100 ng/μL) was dried under nitrogen, acetylated by adding 100 μL pyridine and 100 μL acetic anhydride and heating at 60°C for 1 hour, evaporated to dryness under nitrogen, and then reconstitute into 200 μL of 2-propanol. The acetylated SM15 acetate (SM15-AC) was further diluted 50-fold to 2 ng/μL in 2-propanol, and 1 uL injection into GC×GC-qMS for analysis.
Urinary Steroid Sample Preparation
Collection and use of human urine was approved by the Institutional Review Boards of the University of Texas Southwestern Medical Center and Cornell University. Urine (25–80 ml) was obtained from each of five normal healthy male subjects, between the ages of 20 and 50 years old, and each of three congenital adrenal hyperplasia (CAH) female subjects, 23, 27 and 30 years old undergoing long-term therapeutic treatment with various combinations of hydrocortisone, fludrocortisone (9α-fluorocortisol), and an oral contraceptive (Yasmin®, drospirenone 3 mg + ethinyl estradiol 0.03 mg). After urine collection, samples were immediately frozen at −20°C and remained so until sample preparation.
A 20 mL aliquot of each urine sample was prepared for analysis. The urine samples were prepared by extracting steroid glucuronides using solid phase extraction (SPE) and liquid-liquid extraction, followed by enzymatic hydrolysis to produce free steroids and derivatized by acetylation, as described by Piper et al.26 and Zhang et al27. No other cleanup was performed on the steroid extract samples.
Samples were spiked with an internal standard, EpiA glucuronide (100 μL of 20 ng/μL) prior to the SPE step. Another internal standard, Cne (100 μL of 20 ng/μL) was added quantitatively prior to injection of the samples into the GC×GC-qMS. These two internal standards were spiked into all the prepared urine extracts to account for extraction efficiency and instrumental variations.
GC×GC Configuration
All steroid analyses were carried out on a Shimadzu GC×GC QP2010 Ultra quadrupole MS system (Shimadzu, Columbia, MD) equipped with an AOC-20i autoinjector and a split/splitless inlet (300°C). GC column 1 was a 30 m × 0.25 mm i.d. × 1.0 μm film ZB-1ms (100% dimethylpolysiloxane, Phenomenex, Torrance, CA) and GC column 2 was a 1.5 m × 0.1 mm i.d. × 0.1 μm film BPX-50 (50% phenyl polysilphenylene-siloxane 50% dimethylpolysiloxane, SGE, Austin, TX), both fitted in a single GC oven. The GC oven temperature program was 70°C for 1 min, ramped at 40°C/min to 300°C, held for 35 min, ramped at 40°C/min to 340°C and held for 5 min. Helium carrier, with an initial head pressure of 377 kPa at 70°C, was used at a constant flow rate of 1.3 mL/min. Samples were injected into a split/splitless inlet held at 300°C in splitless mode. The modulation was 6 s using a Zoex double focusing loop modulator (Zoex Corp., Houston, TX) consisting of a 1.5 m × 0.1 mm i.d. capillary. The nitrogen gas cold jet was operated at ~125°C to trap steroids, and the hot jet pulse was operated at 350°C for plug release. A fused silica capillary (1 m × 0.1 mm i.d.) was used as a transfer line to the MS.
MS Parameters
The samples were analyzed in the mass scanning mode at 25 Hz (25 full scans per second), with a scan speed of 10,000 u/s and with mass ranges of 50–390 u for EI, 70–420 u for PCI-CH4, and 200–440 u for PCI-NH3 at a detector voltage of 0.8 V. The ion source temperature for EI was 290°C with EI energy of 70 eV, for PCI-CH4 and PCI-NH3 was 250°C. The NH3 and CH4 gas pressures were 30 psi and 35 psi, respectively. Shimadzu GCMS solution software version 2.53 and GC image software (Zoex Corp.), version 2.1 were used for data analysis and construction of GC×GC chromatograms.
Results and Discussions
GC×GC-qMS Chromatographic Separation of Urinary Steroids
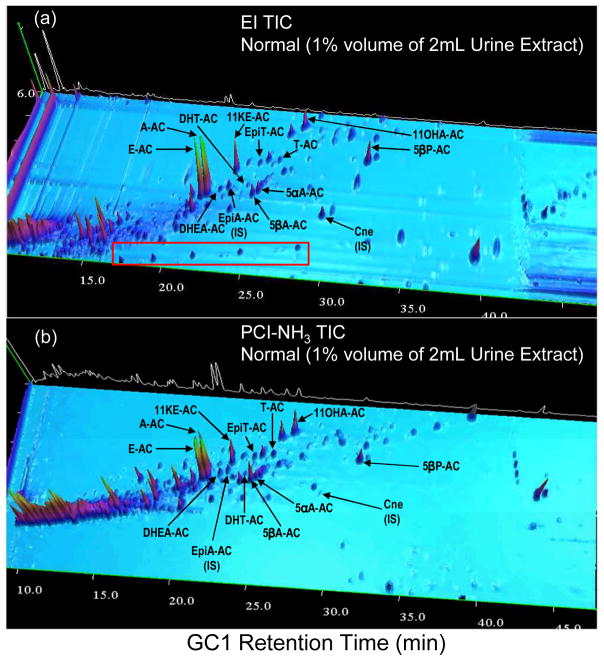
GC×GC-qMS chromatographic conditions were optimized using SM15-AC to achieve best separation of target steroids. Figure 2 presents a total ion chromatogram (TIC) of endogenous steroids in a urine extract analyzed by GC×GC-qMS using EI (Figure 2a) and PCI-NH3 (Figure 2b). All target steroids are detected by PCI-NH3 except for 19NE, which is seldom detected in male urine28. All detected target steroids are baseline resolved, apart from DHT and 5αA-diAC which coelute with matrix interference.
Figure 2.
GC×GC-qMS total ion chromatogram (TIC) of a typical normal urine extract using (a) EI and (b) PCI-NH3.
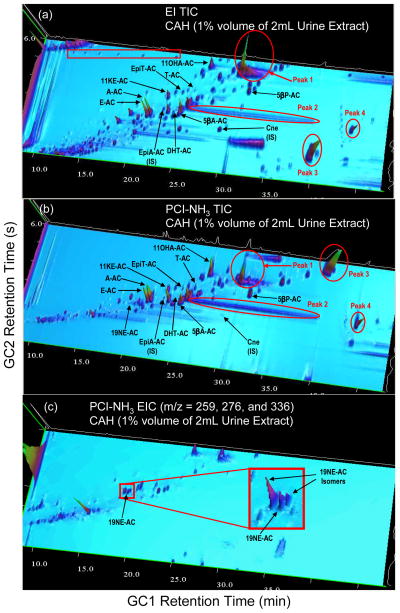
CAH refers to autosomal recessive diseases resulting from mutations of genes for enzymes mediating the biochemical steps of production of cortisol and aldosterone from cholesterol by the adrenal glands (steroidogenesis). It involves excessive or deficient production of sex steroids and can alter development of primary or secondary sex characteristics in some affected infants, children, or adults of both genders, and early diagnosis is considered important for treatment29, 30. The three CAH patients were treated with various binary combinations of hydrocortisone, fludrocortisone, and oral contraceptive; thus, CAH symptoms and steroid metabolites were altered in unpredictable ways. Figure 3 shows a typical GC×GC-qMS analysis of endogenous steroids in an extract of urine from a female patient with CAH, and indicates similar chromatographic separation for target endogenous steroids observed for the male athletes. In contrast to urine of healthy males, a peak is found at the retention times for 19NE-AC, an endogenous steroid which is occasionally found in women’s urine, and may be due to degradation of E. Figure 3c shows an extracted ion chromatogram (EIC) (m/z 259, 276, 336) characteristic of 19-nor steroid acetates including 19NE. The inset shows that 19NE-AC, identified by its mass spectrum and retention time, is baseline resolved from two adjacent peaks presumed to be isomers of 19NE-AC based on their similar mass spectra.
Figure 3.
GC×GC-qMS TIC of (a) EI and (b) PCI-NH3 in a typical CAH patient urine extract, and the PCI-NH3 (c) extracted ion chromatogram (EIC, m/z = 259, 276, 336).
The TIC chromatographic patterns for the five normal urine samples and the three CAH urine samples are generally consistent within each group, reflecting expected interindividual variability in absolute steroid concentrations. A dramatic difference is apparent between the TIC steroid patterns (using both EI and PCI-NH3) of normal urine and CAH urine by comparison of the GC×GC-qMS chromatograms presented in Figure 2 and Figure 3. Obvious manifestations of this difference lie in a few large peaks as labeled peak 1, peak 2, peak 3, and peak 4 in red circles as shown in Figure 3a and 3b. Peaks 1, 2, and 4 are not found in normal urine, while peak 3 is at higher concentration than normal urine. From PCI-NH3 mode, their molecular weight (MW) and number of –OH groups was readily apparent; peak 1 has a MW=376 amu and 2 –OH groups, and peak 2 has a MW=342 amu and one –OH group. The MW of peaks 3 and 4 are uncertain because of the limited PCI-NH3 mass scan range, m/z 220–440. Based on the loss of acetates in other spectra, a plausible MW of peak 3 is m/z 462 amu (3 –OH); two –OHs for peak 3 would not match observed losses. The peak 4 mass spectrum (not shown) is consistent with MW=476 amu (3 –OH) or MW=416 amu (2 –OH). CAH is usually associated with 21-hydroxylase deficiency (21-HOD), and diagnosis is by measurement of elevated urinary 17α-hydroxyprogesterone metabolites pregnanetriol and pregnanetriolone, and as well as 17-ketosteroids such as A, E, 11-KE, 11-OHA and DHEA, present in our SM15 mixture29–33. Our results show no obvious elevation of the 17-ketosteroids in the CAH urine samples. Three acetylated steroid standards, pregnanetriol-AC (MW=462, 3 -AC), pregnanetriolone-AC (MW=476, 3 -AC), and17α-hydroxypregnenolone-AC (MW=416, 2 -AC) have the same MWs as estimated for the unknown peaks 3 and 4 assuming all –OH groups are amenable to acetylation. They were investigated using EI mode; however, none eluted within our GC×GC temperature program. The precursor 17α-progesterone, normally measured in serum, also did not elute as the acetate under our chromatographic conditions. Peak 2 has a single unique mass spectrum and is thus one long tailing compound. The cause of this chromatographic phenomenon is not clear, but may be due to column overloading for this compound. These unexpected large peaks and bands are consistent and reproducible in the other two CAH samples and their structures have not yet been positively identified. However, the untargeted nature of the technique, where full mass scans are available at every pixel provides abundant structural information without requiring reanalysis, as is discussed below. An advantage of GC×GC is that the peak patterns can be easily visualized by 2D contour plots or 3D plots, which could define steroid patterns suggestive of certain clinical maladies, such as endrocrinological disorders, and is a rapid visual way to monitor the effects of medical treatments or changes in an individuals metabolic processes due to nefarious doping practices. Following temporal changes in urinary profiles via the “biological passport” concept is likely to be useful as a non-targeted approach to detect use that influence steroid profiles34, 35.
In reference to the chromatograms in Figures 2a, 2b, 3a, and 3b, automatic peak detection of components using PCI-NH3 appears to be more specific than using EI due to the nature of protonation by reagent NH3 gas, where a total of approximately 1800 and 1200 peaks (i.e. compounds) were detected using EI and PCI-NH3, respectively, in both urine samples. For instance, the hydrocarbons highlighted in the red box in Figure 2a are detected in EI but not detected in PCI-NH3, thereby producing a cleaner and more specific chromatogram. This is advantageous and suitable for steroid detection in complex urine matrices since endogenous steroids generally have functional groups (-OH/-C=O) with higher proton affinity (PA) than NH3, resulting in efficient ionization using PCI-NH3.
PCI Mass Spectra
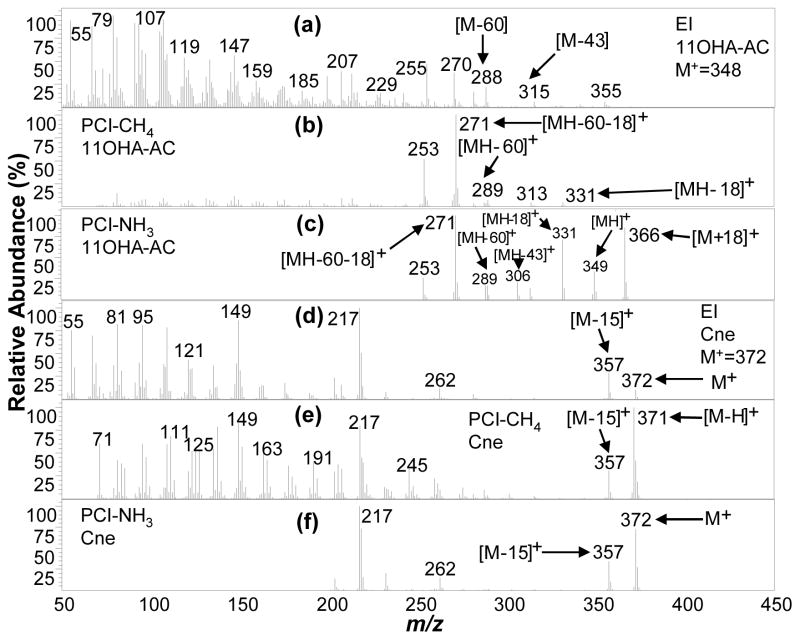
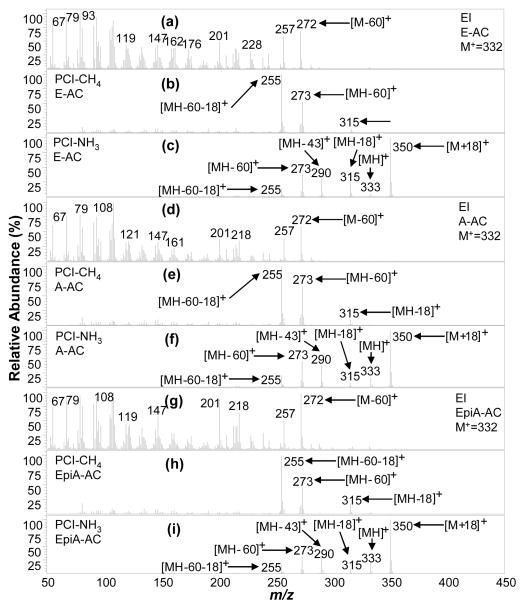
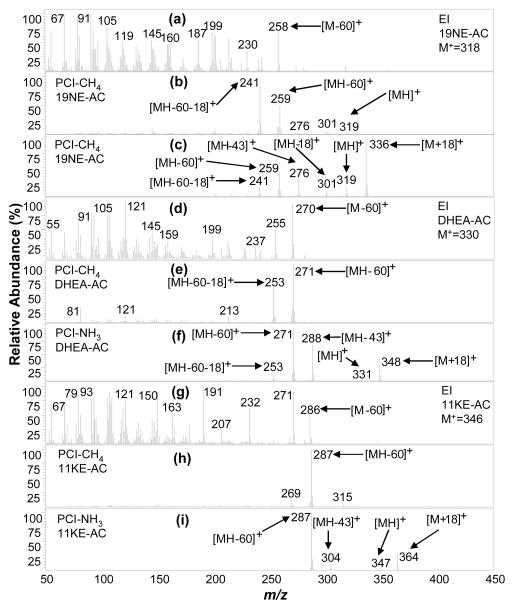
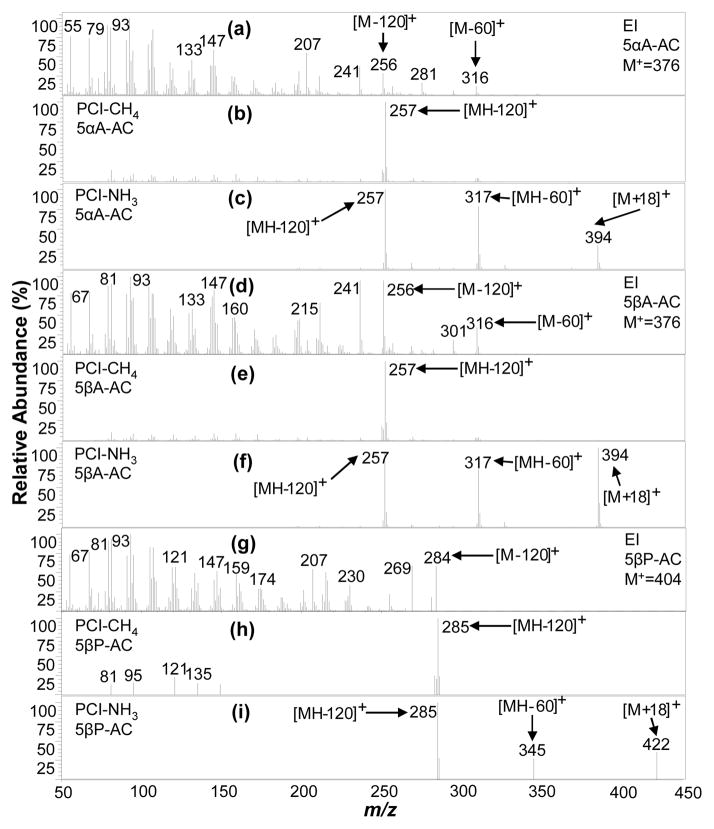
The EI, PCI-CH4, and PCI-NH3 mass spectra (MS) for the twelve target endogenous acetylated steroids detected in urine and other steroids in SM-15-AC are presented in Figures 4–8. Generally, the EI MS of all steroid acetates are dominated by fragments with most signals concentrated at low masses and little to no molecular ion signal, precluding molecular weight determination of unknowns. On the other hand, the PCI-NH3 MS generally contain abundant (pseudo)molecular ion signals and a few high mass fragment ions that are easily interpretable for structural information, while PCI-CH4 MS contain similar useful ion signals in many cases. PCI-NH3, with its high PA (~870 kJ/mol24) and low energy transfer in ion-molecule reactions, forms abundant adduct m/z ions [M + NH4]+ for compounds with many electronegative functional groups, as well as protonated molecular ions [MH]+, which together (difference of 17 mass units) confirm unambiguous molecular weight determination. The acetylating of the steroids assists in functional group information where abundant fragments associated with the acetate loss are easily identified and indicate the number of hydroxyl groups present in the native (underivatized) steroid. These fragments were manifested as single acetate loss ions [MH - CH3COOH] + (or [MH - 60] +), partial acetate loss ions [MH - CH3CO] + (or [MH - 43] +), and double acetate loss ions [MH – 2 × CH3COOH]+ (or [MH - 120] +). In addition, these signals are often associated with water loss ions such as [MH - 18] + and [MH – 60-18] +. PCI-CH4 produced some of the same acetate loss ions; however, seldom produced any (pseudo) molecular ions. The EI process also produced acetate loss ions in the form of [M - 60] +.
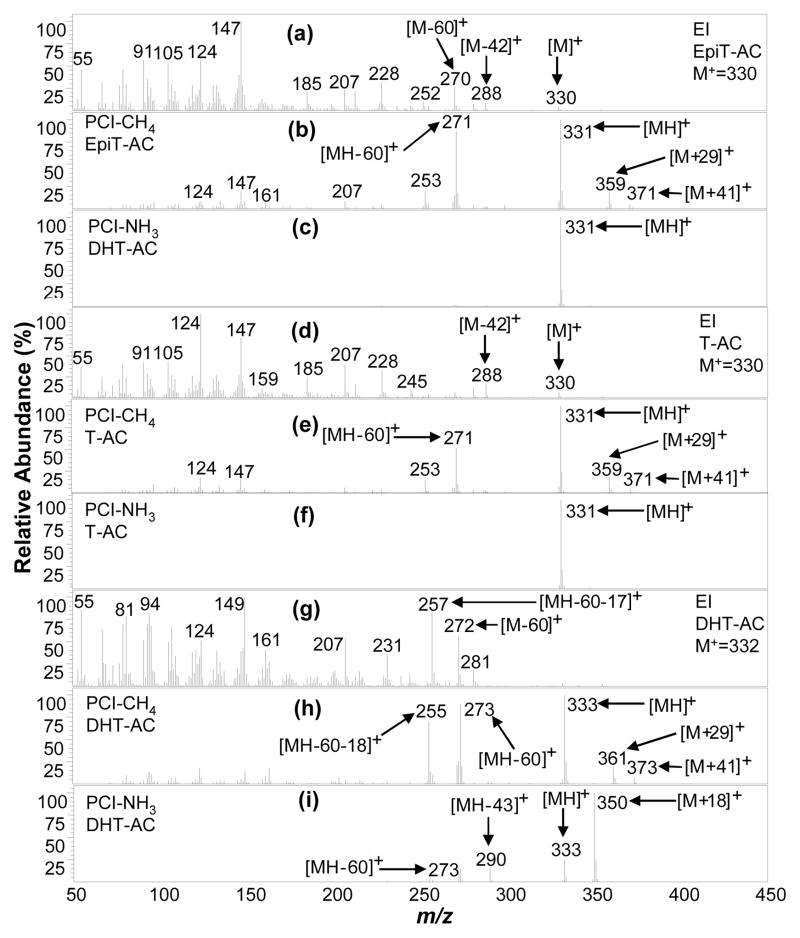
Figure 4.
EpiT-AC, T-AC (in normal urine extract), and DHT-AC (in SM15-AC standard) mass spectra acquired using (a, d, g) EI (mass range m/z 50–390 amu), (b, e, h) PCI with methane reagent gas (PCI-CH4) (mass range m/z 70–420 amu), and (c, f, i) PCI with ammonia reagent gas (PCI-NH3) (mass range m/z 220–440 amu). PCI-NH3 results in a very strong relative intensity for the MW + 18 ([M + NH4]+) or MH+ mass ion, providing unambiguous assignment of molecular weight identification.
Figure 8.
11OHA-AC (in normal urine extract) and Cne (in SM15-AC standard) mass spectra acquired using (a, d) EI (mass range m/z 50–390 amu), (b, e) PCI-CH4 (mass range m/z 70–420 amu), and (c, f) PCI-NH3 (mass range m/z 220–440 amu).
All the isomeric steroids in SM-15 can be differentiated by GC×GC retention times, and in some cases, by their mass spectra. Figure 1 depicts the structures of all the steroids analyzed in this work and shows the nomenclature of rings and position numbers in the steroid perhydrocyclopentanophenanthrene system, using Cne as the model. H, CH3, OH, and CH3COO groups that lie above the plane of the ring system are drawn with solid wedges and designated as β substituents, while those that lie below the plane are drawn with dashed wedges and designated as α substituents, and are important for stereochemical designations. For instance, EpiT-AC and T-AC are diastereoisomers that differ only at the 17 CH3COO position, where EpiT-AC is 17α and T-AC is 17β (Figure 1). In fact, as shown in Figure 4c and 4f, EpiT-AC and T-AC are the only steroids that resulted in an MS (using PCI-NH3) where practically all signal appeared as a single m/z ion, the [MH]+ ion at m/z 331, which is advantageous for increased sensitivity when targeted SIM would be performed. In the PCI-NH3 process, the protonation of a substrate molecule under PCI-NH3 conditions is measurable only if its proton affinity (PA) is greater than that of NH324. Thus here, the ions characteristic of the intact steroid acetate molecule depend upon the PA of the molecule. Westmore et al24 reported that when 787 kJ/mol < PA (analyte) < PA (NH3), [M + NH4]+ will be observed; when PA (analyte) > PA(NH3), both [M + NH4]+ and [MH] + can be formed, with the [M + NH4]+/[MH] + ratio decreasing as PA (analyte) increases. In Table 1, EpiT-AC and T-AC have the lowest [M + NH4] +/[MH] + ratio (=0.03), which indicate their PA are the largest in SM15-AC. This could be explained by their unique conjugated ketone group which stabilizes the molecule, making it resistant to deprotonation (more basic), and resulting in more intense protonation by the reagent gas; as a result [MH] + was produced almost exclusively over [M + NH4] +.
On the other hand, DHT-AC has the structure of T-AC, except the A ring is saturated (i.e. no double bond). This difference is reflected in the PCI-CH4 and PCI-NH3 MS (Figure 4h and 4i), where the [MH] + (m/z 333) is greater than for EpiT-AC and T-AC by 2 mass units; however, the PCI-NH3 MS of DHT contains relatively more [M + NH4] + signal ([M + NH4] +/[MH] + = 2.4) and demonstrates how a structural difference can alter the PCI-NH3 process. Although EpiT-AC and T-AC cannot be differentiated by their PCI-NH3 MS alone, a consistently stronger m/z 147 than m/z 124 ion signal for EpiT-AC in the EI (Figure 4a and 4d) and PCI-CH4 MS (Figure 4b and 4e) can be used with their substantially different GC×GC retention times to provide confident assignments.
PCI-NH3 MS of EpiT-AC (Figure 4c) and T-AC (Figure 4f) does not provide functional group information, but the PCI-CH4 does (Figure 4b and 4e), where in addition to a [MH]+ ion (m/z 331), a [MH-60] + ion (m/z 271) due to a loss of a complete acetate group, reveals the steroids to be monoacetates or have a single hydroxyl group in their native state. Presumably due to its saturated ring system, both PCI-CH4 (Figure 4h) and PCI-NH3 MS (Figure 4i) of DHT-AC provide fragment ions that reveal the presence of a single acetate group. EpiT-AC, T-AC, and DHT-AC are the only steroid acetates in SM-15 that contain a ketone group at position 3 and for which PCI-CH4 produced a [MH]+ ion and methane cluster adduct ions [M + C2H5]+ (or [M + 29]+) and [M + C3H5]+ (or [M + 41]+); [M + CH5]+ (or [M + 17]+) adduct ions are not observed.
E-AC and A-AC are isomers at one ring junction (A/B) position, where the hydrogen is 5β and 5α (Figure 1), respectively, resulting in very different structural configurations. The A/B ring structure is cis (the A ring is angled out of the plane of figure) when the 5 position H is β (5β), and trans when 5α (the A ring in the plane of the figure). Moreover, EpiA-AC is an isomer of A-AC, where the functional group (in this case AC) is 3β and 3α, respectively. The most notable comparison of these three steroids is that each of their EI, PCI-CH4 and PCI-NH3 MS has generally the same pattern for all three (Figure 5a, 5d, 5g). PCI-CH4 (Figure 5b, 5e, 5h) provides no (pseudo)molecular ion, but does result in acetate loss [MH-60] + ions (m/z 273) aiding in molecular weight assignment, when used along with the [MH-18] + ions (m/z 315) indicating a 42 mass loss. PCI-NH3 results in unambiguous molecular weight information through a 17 mass loss observed by the pair of [MH] + (m/z 333) and [M + NH4] + (m/z 350) ion signals, in addition to structural information through acetate loss [MH-60] + ions (m/z 273) indicating a monoacetate (Figure 5c, 5f, 5i). A-AC and EpiA-AC cannot be easily differentiated through either MS; however, PCI-NH3 can be used to differentiate E-AC and A-AC through the [M + NH4]+/[MH] + ratio which is 14.3 and 5 respectively, as shown in Table 1. The PCI-NH3 MS of the remaining endogenously relevant monoacetates (19NE-AC, DHEA-AC, 11KE-AC) also provided molecular weight and acetate group information as shown in Figures 6c, 6f, 6i, respectively.
Figure 5.
E-AC, A-AC (in normal urine extract), and EpiA-AC (in SM15-AC standard) mass spectra, acquired using (a, d, g) EI (mass range m/z 50–390 amu), (b, e, h) PCI-CH4 (mass range m/z 70–420 amu), and (c, f, i) PCI-NH3 (mass range m/z 220–440 amu).
Figure 6.
19NE-AC (in SM15-AC standard), DHEA-AC and 11KE-AC (in normal urine extract) mass spectra acquired using (a, d, g) EI(mass range m/z 50–390 amu), (b, e, h) PCI-CH4 (mass range m/z 70–420 amu), and (c, f, i) PCI-NH3 (mass range m/z 220–440 amu).
Two of the three analyzed diacetates, 5βA-diAC and 5αA-diAC, are cis/trans isomers at the A/B ring junction at position 5, respectively, while 5βP-diAC is A/B cis at position 5. Interestingly, PCI-CH4 yields primarily the [MH-120] + ion for all three diacetates at m/z 257 for 5αA-diAC and 5βA-diAC (Figure 7b and 7e) and m/z 285 for 5βP-diAC (Figure 7h); these ions are less useful for molecular weight and functional group information. In contrast, PCI-NH3 (Figure 7c, 7f, 7i) provides strong adduct [M + NH4] +, single acetate loss [MH-60]+, and double acetate loss [MH - 120] + ions, together making molecular weight determination and functional group assignment unambiguous. Alternatively, the native 11-OHA is a steroid diol that was derivatized to form a monoacetate (11OHA-AC; Steraloids Inc, Newport, RI) rather than a diacetate, which is interpretable and verified in the PCI-NH3 MS (Figure 8c), with the presence of (pseudo) molecular weight ions [M + NH4] + (m/z 366) and [MH] + (m/z 349) and partial [MH-43]+ and full [MH-60]+ single acetate loss ions. Otherwise, molecular weight is not directly obtained from the PCI-CH4 MS (Figure 8b), but it does reveal evidence of just one acetate group loss when comparing the [MH-60]+ and [MH-18]+ ions.
Figure 7.
5αA-DiAC, 5βA-DiAC, and 5βP-DiAC mass spectra in normal urine extract acquired using (a, d, g) EI(mass range m/z 50–390 amu), (b, e, h) PCI-CH4 (mass range m/z 70–420 amu), and (c, f, i) PCI-NH3 (mass range m/z 220–440 amu).
Overall, the order of the steroid PCI-NH3 MS [M + NH4] +/[MH] + ratios (infinite to 0.03 as shown in Table 1) followed as (5βP-diAC, 5βA-diAC) > 5αA-diAC > E-AC > 11KE-AC > DHEA-AC > 5α-androstanol-AC > A-AC > 19NE-AC > EpiA-AC > (DHT-AC, 11-OHA-3-AC) > (T-AC, EpiT-AC), and is inversely related to their PA. The only compound in SM15-AC that yielded neither [M + NH4] + nor [MH] +, but rather M+, was Cne, a saturated steroid precursor, as shown in Figure 8f and resembles the EI MS in Figure 8d. In addition, because Cne has no hydroxyl groups, it is not acetylated during derivatization.
Conclusions
This work demonstrates GC×GC coupled to qMS as a potential new tool for steroid detection and profiling in complex urine extracts. When used in combination with additional investigative techniques, the high specificity of GC×GC-(PCI-NH3)-qMS will be helpful for identification of unknown steroids in complex urine matrices. PCI-NH3 produces simpler mass spectra and more abundant pseudo molecular ion mass spectra than EI, allowing straightforward interpretation for molecular weight and characterization of steroid functional groups. The use of PCI-NH3, along with EI, potentially allows detection and identification of unknown compounds, such as designer steroids, that elute in unique retention spots in the 2D chromatogram, and potentially more easily interpretable than with traditional 1D GC-MS techniques.
Acknowledgments
This work was supported by the Partnership for Clean Competition (PCC) <http://www.cleancompetition.org> and NIH grant RR031264/GM103437. We thank Dr. Larry Bowers for many helpful discussions.
References
- 1.Vollmin JA. High Resolution Gas Chromatography of Urinary Steroids on Glass Capillary Columns. Clinica Chimica Acta. 1971;34(2):207–214. doi: 10.1016/0009-8981(71)90173-2. [DOI] [PubMed] [Google Scholar]
- 2.Lusby WR, Thompson MJ, Kochansky J. Analysis of Sterol Esters by Capillary Gas Chromatography-Electron Impact and Chemical Ionization-Mass Spectrometry. Lipids. 1984;19(11):888–901. [Google Scholar]
- 3.Ahmadkhaniha R, Shafiee A, Rastkari N, Khoshayand MR, Kobarfard F. Quantification of endogenous steroids in human urine by gas chromatography mass spectrometry using a surrogate analyte approach. Journal of Chromatography B-Analytical Technologies in the Biomedical and Life Sciences. 2010;878(11–12):845–852. doi: 10.1016/j.jchromb.2010.01.040. [DOI] [PubMed] [Google Scholar]
- 4.Dehennin L, Ferry M, Lafarge P, Peres G, Lafarge JP. Oral administration of dehydroepiandrosterone to healthy men: Alteration of the urinary androgen profile and consequences for the detection of abuse in sport by gas chromatography mass spectrometry. Steroids. 1998;63(2):80–87. doi: 10.1016/s0039-128x(97)00138-4. [DOI] [PubMed] [Google Scholar]
- 5.Donike M. The detection of doping by means of chromatographic methods. Drug Testing and Analysis. 2011;3(1):15–17. doi: 10.1002/dta.238. [DOI] [PubMed] [Google Scholar]
- 6.Donike M, Barwald KR, Klostermann K, Schanzer W, Zimmermann J. The Detection of Exogenous Testosterone. International Journal of Sports Medicine. 1983;4(1):68–68. [Google Scholar]
- 7.Mareck U, Geyer H, Opfermann G, Thevis M, Schanzer W. Factors influencing the steroid profile in doping control analysis. Journal of Mass Spectrometry. 2008;43(7):877–891. doi: 10.1002/jms.1457. [DOI] [PubMed] [Google Scholar]
- 8.Van Renterghem P, Van Eenoo P, Geyer H, Schanzer W, Delbeke FT. Reference ranges for urinary concentrations and ratios of endogenous steroids, which can be used as markers for steroid misuse, in a Caucasian population of athletes (vol 75, pg 154, 2010) Steroids. 2010;75(4–5):373–375. doi: 10.1016/j.steroids.2009.11.008. [DOI] [PubMed] [Google Scholar]
- 9.Van Renterghem P, Van Eenoo P, Van Thuyne W, Geyer H, Schanzer W, Delbeke FT. Validation of an extended method for the detection of the misuse of endogenous steroids in sports, including new hydroxylated metabolites. Journal of Chromatography B-Analytical Technologies in the Biomedical and Life Sciences. 2008;876(2):225–235. doi: 10.1016/j.jchromb.2008.10.047. [DOI] [PubMed] [Google Scholar]
- 10.Stanczyk FZ, Clarke NJ. Advantages and challenges of mass spectrometry assays for steroid hormones. Journal of Steroid Biochemistry and Molecular Biology. 2010;121(3–5):491–495. doi: 10.1016/j.jsbmb.2010.05.001. [DOI] [PubMed] [Google Scholar]
- 11.Parr MK, Fussholler G, Schlorer N, Opfermann G, Geyer H, Rodchenkov G, Schanzer W. Detection of Delta 6-methyltestosterone in a “dietary supplement” and GC-MS/MS investigations on its urinary metabolism. Toxicology Letters. 2011;201(2):101–104. doi: 10.1016/j.toxlet.2010.11.018. [DOI] [PubMed] [Google Scholar]
- 12.Parr MK, Schanzer W. Detection of the misuse of steroids in doping control. Journal of Steroid Biochemistry and Molecular Biology. 2010;121(3–5):528–537. doi: 10.1016/j.jsbmb.2009.12.008. [DOI] [PubMed] [Google Scholar]
- 13.Christakoudi S, Cowan DA, Taylor NF. Steroids excreted in urine by neonates with 21-hydroxylase deficiency: Characterization, using GC-MS and GC-MS/MS, of the D-ring and side chain structure of pregnanes and pregnenes. Steroids. 2010;75(1):34–52. doi: 10.1016/j.steroids.2009.09.011. [DOI] [PubMed] [Google Scholar]
- 14.Mitrevski BS, Brenna JT, Zhang Y, Marriott PJ. Application of comprehensive two-dimensional gas chromatography to sterols analysis. Journal of Chromatography A. 2008;1214(1–2):134–142. doi: 10.1016/j.chroma.2008.10.045. [DOI] [PubMed] [Google Scholar]
- 15.Mitrevski BS, Wilairat P, Marriott PJ. Comprehensive two-dimensional gas chromatography improves separation and identification of anabolic agents in doping control. Journal of Chromatography A. 2010;1217(1):127–135. doi: 10.1016/j.chroma.2009.10.075. [DOI] [PubMed] [Google Scholar]
- 16.Mitrevski BS, Wilairat P, Marriott PJ. Evaluation of World Anti-Doping Agency criteria for anabolic agent analysis by using comprehensive two-dimensional gas chromatography-mass spectrometry. Analytical and Bioanalytical Chemistry. 2010;396(7):2503–2511. doi: 10.1007/s00216-009-3415-3. [DOI] [PubMed] [Google Scholar]
- 17.Silva AI, Pereira HMG, Casilli A, Conceicao FC, Neto FRA. Analytical challenges in doping control: Comprehensive two-dimensional gas chromatography with time of flight mass spectrometry, a promising option. Journal of Chromatography A. 2009;1216(14):2913–2922. doi: 10.1016/j.chroma.2008.10.042. [DOI] [PubMed] [Google Scholar]
- 18.Purcaro G, Tranchida PQ, Dugo P, La Camera E, Bisignano G, Conte L, Mondello L. Characterization of bacterial lipid profiles by using rapid sample preparation and fast comprehensive two-dimensional gas chromatography in combination with mass spectrometry. Journal of Separation Science. 2010;33(15):2334–2340. doi: 10.1002/jssc.201000160. [DOI] [PubMed] [Google Scholar]
- 19.Lukaszewicz E, Ieda T, Horii Y, Yamashita N, Falandysz J. Comprehensive two-dimensional GC (GC x GC) qMS analysis of tetrachloronaphthalenes in Halowax formulations. Journal of Environmental Science and Health Part a-Toxic/Hazardous Substances & Environmental Engineering. 2007;42(11):1607–1614. doi: 10.1080/10934520701517788. [DOI] [PubMed] [Google Scholar]
- 20.Tranchida PQ, Shellie RA, Purcaro G, Conte LS, Dugo P, Dugo G, Mondello L. Analysis of Fresh and Aged Tea Tree Essential Oils By Using GCxGC-qMS. Journal of Chromatographic Science. 2010;48(4):262–266. doi: 10.1093/chromsci/48.4.262. [DOI] [PubMed] [Google Scholar]
- 21.Sciarrone D, Tranchida PQ, Ragonese C, Schipilliti L, Mondello L. Multidimensional GC coupled to MS for the simultaneous determination of oxygenate compounds and BTEX in gasoline. Journal of Separation Science. 2010;33(4–5):594–599. doi: 10.1002/jssc.200900577. [DOI] [PubMed] [Google Scholar]
- 22.Munson MSB, Field FH. Chemical Ionization Mass Spectrometry. I. General Introduction. Journal of the American Chemical Society. 1966;88(12):2621–2630. [Google Scholar]
- 23.Lin YY. Identification of Steroids by Chemical Ionization Mass-Spectrometry. Lipids. 1980;15(9):756–763. doi: 10.1007/BF02534029. [DOI] [PubMed] [Google Scholar]
- 24.Westmore JB, Alauddin MM. Ammonia Chemical Ionization Mass-Spectrometry. Mass Spectrometry Reviews. 1986;5(4):381–465. [Google Scholar]
- 25.Rezanka T. Analysis of Sterol Esters from Alga and Yeast by High-Performance Liquid-Chromatography and Capillary Gas-Chromatography Mass-Spectrometry with Chemical Ionization. Journal of Chromatography. 1992;598(2):219–226. doi: 10.1016/0021-9673(92)85051-t. [DOI] [PubMed] [Google Scholar]
- 26.Piper T, Mareck U, Geyer H, Flenker U, Thevis M, Platen P, Schanzer W. Determination of C-13/C-12 ratios of endogenous urinary steroids: method validation, reference population and application to doping control purposes. Rapid Communications in Mass Spectrometry. 2008;22(14):2161–2175. doi: 10.1002/rcm.3601. [DOI] [PubMed] [Google Scholar]
- 27.Zhang Y, Tobias JH, Brenna JT. Annual ASMS Meeting on Mass Spectrometry and Related Topics; Denver, CO. 2011. [Google Scholar]
- 28.Galan Martin AM, Marino JI, Garcia de Tiedra MP, Marabe JJ, Caballero Loscos MJ, Marino MM. Determination of nandrolone and metabolites in urine samples from sedentary persons and sportsmen. J Chromatogr B Biomed Sci Appl. 2001;761(2):229–36. doi: 10.1016/s0378-4347(01)00338-3. [DOI] [PubMed] [Google Scholar]
- 29.Auchus RJ. Congenital adrenal hyperplasia in adults. Current Opinion in Endocrinology Diabetes and Obesity. 2010;17(3):210–216. doi: 10.1097/MED.0b013e32833961d7. [DOI] [PubMed] [Google Scholar]
- 30.Stanic M, Nesovic M. Congenital adrenal hyperplasia. Medicinski pregled. 1999;52(11–12):447–54. [PubMed] [Google Scholar]
- 31.Homoki J, Solyom J, Wachter U, Teller WM. Urinary-Excretion of 17-Hydroxypregnanolones in Patients with Different Forms of Congenital Adrenal-Hyperplasia Due to Steroid 21-Hydroxylase Deficiency. European Journal of Pediatrics. 1992;151(1):24–28. doi: 10.1007/BF02073884. [DOI] [PubMed] [Google Scholar]
- 32.Homma K, Hasegawa T, Takeshita E, Watanabe K, Anzo M, Toyoura T, Jinno K, Ohashi T, Hamajima T, Takahashi Y, Takahashi T, Matsuo N. Elevated urine pregnanetriolone definitively establishes the diagnosis of classical 21-hydroxylase deficiency in term and preterm neonates. Journal of Clinical Endocrinology & Metabolism. 2004;89(12):6087–6091. doi: 10.1210/jc.2004-0473. [DOI] [PubMed] [Google Scholar]
- 33.White PC, Speiser PW. Congenital adrenal hyperplasia due to 21-hydroxylase deficiency (vol 21, pg 245, 2000) Endocrine Reviews. 2000;21(5):550–550. doi: 10.1210/edrv.21.3.0398. [DOI] [PubMed] [Google Scholar]
- 34.Sottas PE, Robinson N, Rabin O, Saugy M. The Athlete Biological Passport. Clinical Chemistry. 2011;57(7):969–976. doi: 10.1373/clinchem.2011.162271. [DOI] [PubMed] [Google Scholar]
- 35.Robinson N, Saugy M, Vernec A, Sottas PE. The Athlete Biological Passport: An Effective Tool in the Fight against Doping. Clinical Chemistry. 2011;57(6):830–832. doi: 10.1373/clinchem.2011.162107. [DOI] [PubMed] [Google Scholar]


