Abstract
OBJECTIVE
Little is known about the capacity, mechanisms, or timing of growth in β-cell mass in humans. We sought to establish if the predominant expansion of β-cell mass in humans occurs in early childhood and if, as in rodents, this coincides with relatively abundant β-cell replication. We also sought to establish if there is a secondary growth in β-cell mass coincident with the accelerated somatic growth in adolescence.
RESEARCH DESIGN AND METHODS
To address these questions, pancreas volume was determined from abdominal computer tomographies in 135 children aged 4 weeks to 20 years, and morphometric analyses were performed in human pancreatic tissue obtained at autopsy from 46 children aged 2 weeks to 21 years.
RESULTS
We report that 1) β-cell mass expands by several-fold from birth to adulthood, 2) islets grow in size rather than in number during this transition, 3) the relative rate of β-cell growth is highest in infancy and gradually declines thereafter to adulthood with no secondary accelerated growth phase during adolescence, 4) β-cell mass (and presumably growth) is highly variable between individuals, and 5) a high rate of β-cell replication is coincident with the major postnatal expansion of β-cell mass.
CONCLUSIONS
These data imply that regulation of β-cell replication during infancy plays a major role in β-cell mass in adult humans.
Glucose homeostasis is regulated by the secretion of insulin from pancreatic β-cells (1). Sufficient β-cells are therefore required to maintain normal glucose concentrations, as demonstrated by development of diabetes if β-cell mass is decreased surgically or by β-cell toxins (2–4). A deficit in the number of β-cells (collectively referred to as the β-cell mass) contributes to the development of both type 1 and type 2 diabetes (5–8). Correction of hyperglycemia by replenishment of β-cell mass in both type 1 and type 2 diabetes further emphasizes a central role of β-cell deficiency in diabetes. However, β-cell replacement by transplantation (whole pancreas or islet transplantation) has limitations as a therapy for diabetes (9,10). First, the incidence of diabetes far exceeds the supply of donor organs. Second, the side effects of chronic exposure to immunosuppression includes increased risk for lymphoproliferative disease as well as renal and islet failure (9). Third, there is relatively rapid progressive graft failure in the case of islet transplantation, although this is less problematic for whole pancreas transplantation (11).
Alternative approaches have been explored to restore an effective β-cell mass as a therapy for diabetes. One approach is to create β-cell surrogates by gene manipulation of a variety of cell lines, but to date, these efforts have not developed glucose-responsive cells that secrete sufficient insulin to be clinically useful (12). Another approach is to foster differentiation of embryonic stem cells into β-cells. There has been some success in this regard (13,14), but such approaches are still far from being applicable to humans.
An alternative strategy is to foster β-cell regeneration from endogenous sources. Cellular regeneration is most readily accomplished in tissue with a high basal rate of turnover (for example, gut epithelium) or a marked capacity for new cell formation after cell loss (for example, liver). There is indirect evidence of β-cell turnover in adult humans (7). β-Cell mass can be adaptively increased in humans, for example, in obesity (8,15), but the extent of this adaptive increase is modest compared with that in obese rodents (~0.5-fold vs. ~10-fold) (8,16). We reasoned that the most significant period of new β-cell formation in humans occurs between birth and the fully grown young adult. Effective β-cell regeneration in established type 1 diabetes would need to provide a comparable degree of β-cell formation.
There are two phases of rapid growth in childhood: the first 3 years of life and adolescence. There is an increased incidence of type 1 and type 2 diabetes in adolescence. There is an increasing incidence of type 1 diabetes in young childhood. These clinical observations draw particular attention to the pattern of β-cell growth during these two periods of childhood.
Therefore, our first aim in this study was to establish by use of pancreas obtained at autopsy the extent and timing of the expansion of β-cell numbers during human childhood from infancy to fully grown young adults. Our second aim was to establish the predominant source of newly forming β-cells. Based on partial pancreatectomy studies in rats, it has been suggested that β-cell regeneration may occur in part through the formation of new islets from endocrine progenitor cells residing in the exocrine ductal epithelium (17). Other investigators have proposed that bone marrow stem cells may give rise to β-cells in mice (18), although this has subsequently been challenged in murine and human studies (19,20).
Documentation of β-cell formation from stem cells requires lineage studies, an approach that is impracticable in humans. We therefore reasoned that having identified the period of maximal expansion of β-cell numbers in humans, we would seek to establish if this is accompanied by an increased frequency of β-cell replication. We also reasoned that if the expansion of β-cell mass during childhood is accomplished primarily by β-cell replication, then there should be a concurrent expansion in the numbers of β-cells per islet. On the other hand, if the predominant source of new β-cells during the expansion of β-cell mass in childhood is through the source of new islet formation from pancreatic stem cells, then there should be a substantial increase in the number of islets during the most rapid growth of β-cell mass.
Therefore in the present studies, we sought to establish the extent, timing, and predominant source of β-cell formation during normal growth in humans. To accomplish these goals, we obtained pancreas at autopsy from 46 individuals aged 2 weeks to 21 years of age and examined these pancreata for fractional β-cell area and β-cell turnover by immunohistochemistry and morphometric analysis. By use of population pancreas volume data obtained by computed tomography (CT) scan, we then computed growth of β-cell mass during growth from infancy to adulthood in humans.
RESEARCH DESIGN AND METHODS
Assessment of pancreas volume
To measure the pancreatic volume in different age-groups, abdominal CT scans from 135 subjects (77 males, 58 females) aged ≤20 years were used. These data have already been published in a previous report focused on the changes in pancreatic volume over time (21).
Autopsy cases
Human pancreatic tissue was obtained at autopsy from 46 individuals (34 male, 12 female), aged 2 weeks to 21 years (means ± SD: 9.7 ± 7.5 years). Potential cases were identified by retrospective analysis of the Mayo Clinic autopsy database. To be included, cases were required to have 1) had a full autopsy within 24 h of death and 2) pancreatic tissue stored that was of adequate size and quality. Cases were excluded if pancreatic tissue had undergone autolysis or showed evidence of acute pancreatitis. None of the individuals had a history of diabetes or any other diseases affecting the pancreas. The characteristics of the cases and diagnoses leading to death are presented in Table 1.
TABLE 1.
Characteristics of 46 autopsy cases
| Case number | Age (years) | Sex (M/F) | BMI (kg/m2) | Diagnoses leading to death |
|---|---|---|---|---|
| 1 | 0.05 | M | 13.5 | Respiratory distress; Down’s syndrome |
| 2 | 0.21 | M | 14.3 | Complete transposition of great arteries |
| 3 | 0.58 | F | 17.3 | Tetrology of Fallot |
| 4 | 0.58 | F | 14.9 | Ventricular septal defect; encephalopathy |
| 5 | 1.07 | M | 16.5 | Apnea and cardiac arrest after meningitis |
| 6 | 1.54 | F | 12.5 | Subdural and epidural hematoma |
| 7 | 1.85 | M | 14.8 | Congenital heart disease |
| 8 | 1.87 | M | 15.2 | Intractable seizures |
| 9 | 1.99 | M | 14.5 | Idiopathic restrictive cardiomyopathy with pulmonary venous hypertension |
| 10 | 2.05 | M | 17.2 | Tetralogy of Fallot |
| 11 | 2.07 | M | 13.1 | Collision with motor vehicle leading to subdural hematoma, hypoxic encephalopathy |
| 12 | 2.8 | M | 14.4 | Ingestion of alkalai (liquid dairy farm cleaner), leading to aspiration and hypoxiecencephalopathy |
| 13 | 2.91 | M | 11.8 | Acute thrombolitic occlusion of a gortex shunt after cardiac surgery for congenital heart disease |
| 14 | 3.66 | F | 13.9 | Unable to wean from bypass for congenital heart disease |
| 15 | 3.66 | F | 14 | Cerebral venous malformation leading to pontine hemorrhage |
| 16 | 4.17 | F | 12.5 | Unable to wean from bypass for congenital heart disease |
| 17 | 4.53 | M | 15.1 | Cerebellar meduloblastoma |
| 18 | 5.42 | M | 15.7 | Reye’s syndrome, encephalopathy |
| 19 | 5.52 | M | 14.7 | Massive head trauma after collision with a tractor |
| 20 | 6.27 | F | 16.5 | Polytrauma after collision with pickup truck |
| 21 | 6.32 | F | 10.6 | Skull fracture after collision with truck |
| 22 | 6.5 | M | 20.6 | Down’s syndrome leading to respiratory failure |
| 23 | 8.72 | F | 16.1 | Car accident |
| 24 | 9.23 | F | 14.9 | Congenital heart disease leading to cardiac failure |
| 25 | 9.49 | M | 14.3 | Head trauma after motor vehicle accident |
| 26 | 11.62 | M | 21.4 | Intracranial hemorrhage following accidental hit by a golf ball |
| 27 | 13.87 | M | 24 | Ventricular fibrillation post appendectomy |
| 28 | 14.6 | M | 12.8 | Tetrology of Fallot leading with pulmonary venous hypertension |
| 29 | 15.15 | M | 21.6 | Skull fracture after motor vehicle accident |
| 30 | 15.46 | M | 23.4 | Polytrauma after motor vehicle accident |
| 31 | 16.36 | M | 16.7 | Polytrauma after bike accident |
| 32 | 17.13 | M | 23.3 | Polytrauma after fall from a hotel roof |
| 33 | 17.16 | M | 25.5 | Polytrauma after bike accident |
| 34 | 17.56 | M | 20.5 | Subdural hematoma and edema of the right hemisphere after football injury |
| 35 | 17.92 | M | 21.3 | Multiple traumatic injuries after motorcycle accident |
| 36 | 18.25 | M | 25.5 | Profound hypothermia (12 h) after accidental cryoexposure |
| 37 | 18.34 | M | 19.6 | Pulmonary aspiration of gastric contents, leading to cardiorespiratory arrest after motorcycle accident |
| 38 | 18.57 | M | 18.7 | End-stage plexogenic pulmonary arteriopathy |
| 39 | 19.2 | F | 22.6 | Polytrauma after motor vehicle accident |
| 40 | 19.2 | M | 34.1 | Polytrauma after motor vehicle accident |
| 41 | 19.21 | M | 24.6 | Polytrauma after motor vehicle accident |
| 42 | 19.25 | M | 20.5 | Polytrauma after motor vehicle accident |
| 43 | 19.45 | M | 14.7 | Polytrauma after motor vehicle accident |
| 44 | 19.5 | M | 29.3 | Bowel perforation leading to peritonitis |
| 45 | 21.04 | F | 17.5 | Rheumatic heart disease |
| 46 | 21.46 | M | 25.7 | Gun shot wound to head |
Pancreatic tissue processing
Pancreas was fixed in formaldehyde and embedded in paraffin for subsequent analysis as previously described (8). Sequential µ5-m sections were stained as follows: 1) for insulin (peroxidase staining) and hematoxylin for light microscopy, 2) insulin and Tdt-mediated dUTP nick end labeling (TUNEL) combined (peroxidase staining), and 3) insulin, Ki67, and 4′,6-diamidino-2-phenylindole dihydrochloride (DAPI) combined (immunofluorescence).
For immunohistochemical staining, the following primary antibodies were used: guinea pig anti-insulin, 1:200 (Dako), and mouse Ki67, 1:200 (MIB-1, Dako). Secondary antibodies labeled with Cy3, fluorescein isothiocyanate, and 1-amino-1-methyl-3(4)-aminomethylcyclohexane (AMCA) were obtained from The Jackson Laboratories and used at dilutions of 1:100–1:200. For Tdt-mediated dUTP nick end labeling staining, in situ cell death detection KIT AP from Roche diagnostic was used.
Morphometric analysis
For the determination of the fractional β-cell area, the entire pancreatic section was imaged at 40× magnification (4× objective). The ratio of the β-cell area/exocrine area was digitally quantified as previously described (8) using Image Pro Plus software. The mean areas of the pancreatic sections included in these analyses was 117 ± 47 mm2.
For the determination of β-cell replication and of the extent to which β-cells were associated with exocrine ducts, 10 random locations in each section stained for insulin, Ki67, and 4’,6-diamidino-2-phenylindole dihydrochloride were imaged at 200 × magnification (20× objective) and analyzed in detail. The total number of Ki67-positive cells per section, as well as the number of β-cells co-staining with Ki67, were quantified, and the number of replicating β-cells was expressed as the percentage of the total number of β-cells per case. By these means, an average number of 678 ± 88 β-cells per case were counted. Furthermore, the number of islets adjacent to (i.e., closer than five nuclei width) exocrine ducts was quantified in each image. For these analyses, exocrine ducts were identified based on their typical cell shape and orientation.
For the determination of apoptosis, 200 islets per case were analyzed, and the number of apoptotic β-cells was expressed in relation to the respective β-cell area.
For the determination of islet size and density, pancreatic sections stained for insulin (peroxidase) and hematoxylin were analyzed. After careful assessment of the entire pancreatic section, five representative islets were identified. For each islet, first the total islet size was measured using Image Pro Plus version 4.5.1 (Media Cybernetics, Silver Spring, MD) and then the insulinpositive area of each islet was measured. Islet density was quantified by measuring the total area of the pancreas section using Image Pro Plus and then counting the number of islets contained within that pancreatic area. An islet was defined as a cluster of four or more insulin-positive cells.
To measure the nuclear and whole cell diameter, insulin-stained sections of pancreas (peroxidase) counterstained with hematoxylin were used. Five islets per case selected at random were photographed at ×200 magnification on an Olympus I×70 inverted system microscope (Olympus America, Melville, NY). These islets were then examined to identify five representative β-cell nuclei each. Selection criteria included clear presence of the nucleus within a β-cell, the ability to clearly visualize nuclear boundaries, circular shape (similar dimensions in all directions), and the appearance to the observer that the nucleus had been sectioned through its maximum diameter. Once the identified nucleus was encircled, measurement of 180 nuclear diameters per nucleus was made using Image Pro Plus software version 4.5.1, which quantified these 180 diameters at 2° angles throughout the circumference of the nucleus. Thus, the mean of 4,500 single measurements per case was used to compute the mean nuclear diameter per case. For the determination of the mean cell diameter, five distances between two adjacent β-cell nuclei (including one of the nuclei) were measured in each of the five islets. The mean intra-individual coefficients of variations for the determinations of β-cell nuclear size and β-cell size were 11 and 10%, respectively.
Assessment of β-cell mass
Because the pancreas weight is not readily determined at autopsy, we sought to establish the growth pattern of the pancreas volume in a population-based fashion. These measures of pancreas volume were then used to estimate β-cell mass in each age-group. Thus, respective values for β-cell mass in each case were derived from the actual measurement data of the fractional β-cell area and the population-based average volume of the pancreas in the respective age-group. Accordingly, β-cell mass was calculated in each of the 46 autopsy cases as a product of the fractional β-cell area as determined by immunohistochemical staining and the pancreatic parenchymal volume for the respective age, as calculated on the basis of the CT scans. These calculations were based on the assumption that in aqueous organs, such as the pancreas, 1 g of weight equals 1 cm3 of volume. Thus, it is theoretically possible that the actual determinations of β-cell mass were influenced by subtle differences in the volume density between different organs. However, because only normal pancreata without overt signs of fibrosis were included, there is no reason to expect major variations in the actual β-cell mass calculations implied by this factor.
The mean β-cell area per case was calculated from the measured mean cell diameter in each autopsy case assuming a spherical shape of β-cells. The β-cell number was then computed by dividing the total β-cell area by the individual area per β-cell. The total number of islets per case was calculated from the product of the measured number of islets per cm3 times the pancreatic volume.
Calculation of somatic and β-cell growth
To calculate the absolute somatic growth rate (in kilograms), the actual body weight in each case was subtracted by the mean body weight of the respective lower age quintile and expressed in relation to the respective time interval (in years). The youngest case available (2-week-old male) was chosen as the baseline for the youngest quintile. The relative growth (in percent per year) was computed in a similar way by expressing the actual body weight as a percentage of the mean weight of the lower quintile subtracted by 100. The absolute and relative increases in β-cell mass and β-cell number were calculated accordingly.
Statistical analysis
Subject characteristics are reported as means ± SD, and results are presented as means ± SE. For statistical comparisons, the 45 autopsy cases aged 11 weeks to 21 years were grouped into quintiles according to their age. Statistical calculations were carried out by one-way ANOVA and Tukey’s post hoc test using GraphPad Prism 4 (GraphPad Software, San Diego, CA). A P value <0.05 was taken to indicate significant differences. Regression analyses were carried out using GraphPad Prism 4.
RESULTS
Pancreas volume
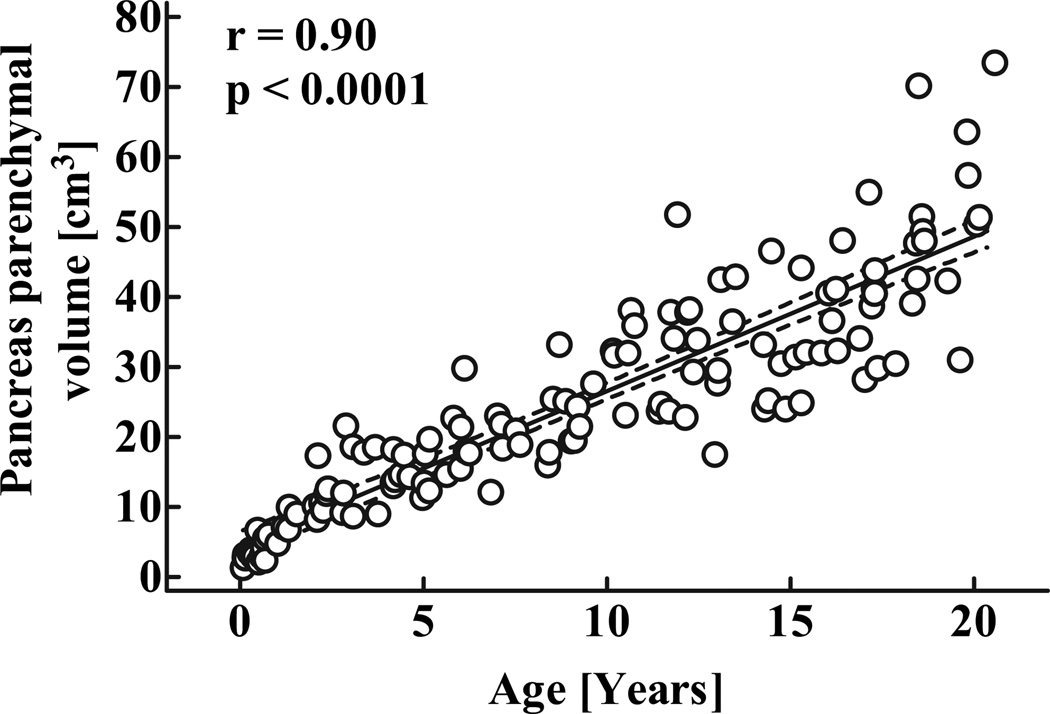
As described in detail elsewhere (21), the parenchymal volume of pancreas in human childhood increases in a linear manner with age (Fig. 1; r = 0.9, P < 0.0001) described by the equation yp = 4.3 + 2.25x, were yp is the parenchymal pancreas volume (cm3) and x is age (years).
FIG. 1.
Parenchymal volume of the pancreas in 135 children aged 30 days to 20 years. Dashed lines denote the respective upper and lower 95% CIs r and P values were calculated by linear regression analysis.
Pancreas morphology
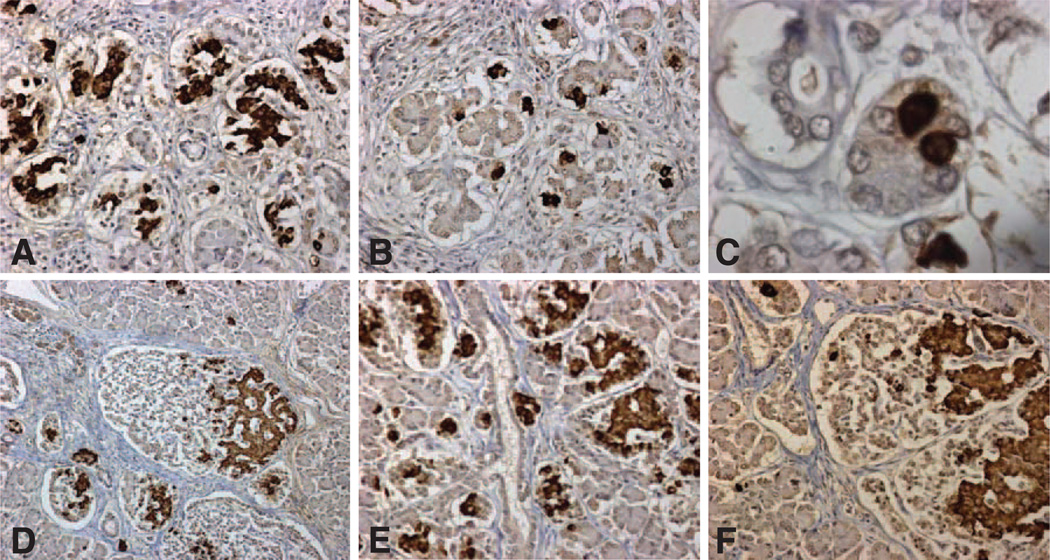
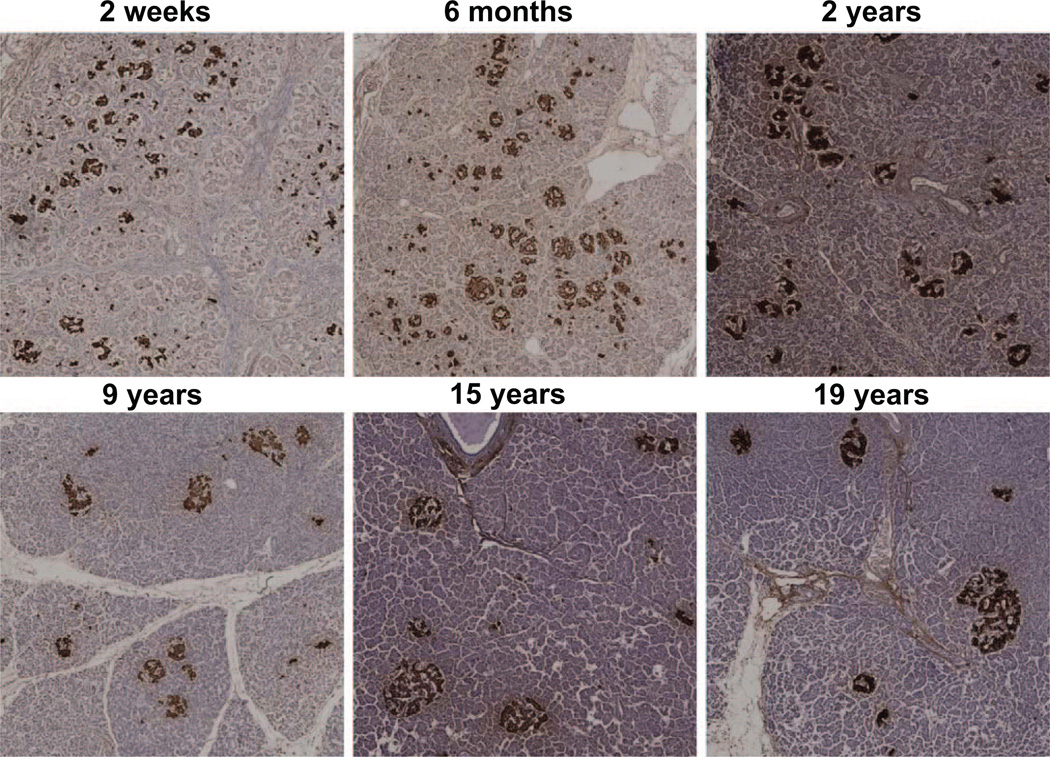
Histological evaluation of the pancreas demonstrated a more pronounced lobular organization in the youngest cases (Figs. 2 and 3). Within these lobules in early infancy, a high proportion of β-cells were present as single cells (Fig. 2B and C) or as small clusters of β-cells (Fig. 2A). In later infancy, the scattered β-cells were present in more pronounced and larger islets, in which β-cells were often distributed at one pole of the islet (Fig. 2D and F). The density of these newly formed islets was heterogeneous with highly packed islets (Fig. 2D and E) in some areas and other areas of pancreas still more represented by scattered single or small clusters of β-cells. Although there was no obvious relationship between densely packed groups of islets and ductal tissue, there was an occasional ductal tree decorated with islets (Fig. 2E).
FIG. 2.
Representative pancreatic sections stained for insulin (brown) and hematoxylin from case 1, aged 2.5 weeks (Table 1) (A–C) and case 2, aged 10 weeks (D–F), In early infancy, β-cells were abundant as small clusters (A, objective ×20) surrounded by a single cell layer nonfibrous capsule. In other areas, β-cells were mostly present as single cells (B, objective ×20), shown in high power in C (objective ×100). By 10 weeks of age, the small clusters of β-cells had grown in size and typically occupied an encapsulated islet-like structure, with the β-cells being predominantly polar within the islet as previously described (D, objective ×10; F, objective ×20). The capsule by 10 weeks had some fibrous tissue. At 10 weeks of age, islets were densely located throughout the pancreas but in higher density in some locations (E, objective ×20), in this case decorating a ductal tree.
FIG. 3.
Representative pancreatic sections stained for insulin (brown) and hematoxylin from six children aged 2 weeks to 19 years. Images were taken at 100 × magnification (10× objective).
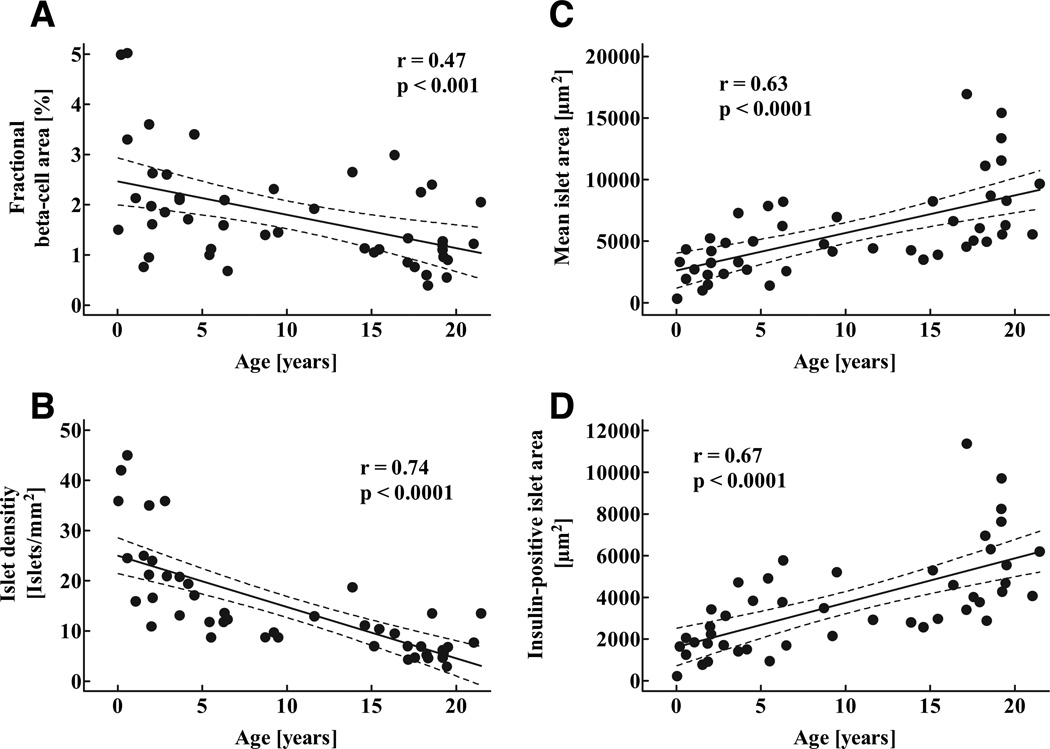
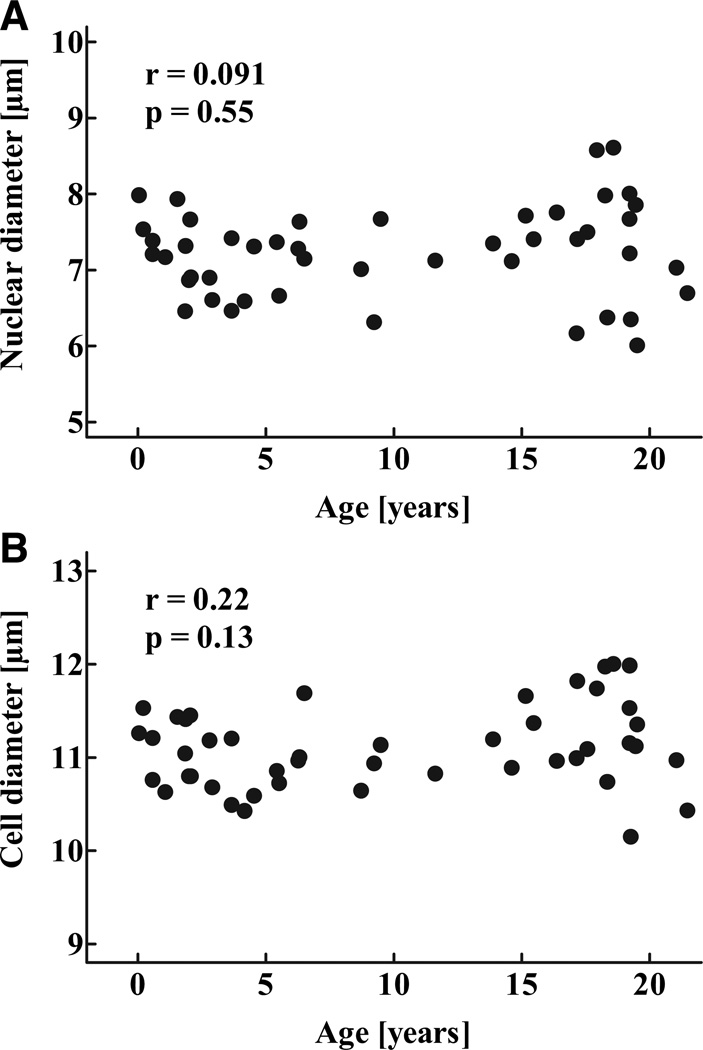
The fractional pancreatic area positive for insulin was highest in the youngest age-group and decreased during childhood (P < 0.05; Fig. 4A; Table 2), and there was a gradual decline in islet density during childhood (P < 0.0001; Fig. 4B). In contrast, mean islet size as well as the mean insulin-positive islet area increased throughout childhood (P < 0.001; Fig. 4C and D). Because neither β-cell nuclear diameter or β-cell diameter changed during childhood, the increased insulin-positive area per islet reflected increased numbers of β-cells rather than larger β-cells (Fig. 5).
FIG. 4.
Fractional pancreatic area positive for insulin (A), mean islet density (number of islets per mm2 pancreatic tissue (B), as well as mean islet area (C) and mean insulin-positive islet area (D) in 46 children aged 2 weeks to 21 years. Solid lines indicate the regression lines; dashed lines denote the respective upper and lower 95% CIs r and P values were calculated by linear regression analysis.
TABLE 2.
Measures of β-cell mass in 46 children aged 2 weeks to 21 years, grouped into quintiles
| 0.2–2.05 | 2.06–5.6 | 5.7–4.6 | 14.7–18.4 | 18.5–21.5 | P | |
|---|---|---|---|---|---|---|
| Fractional (β-cell area (%) | 2.6 ± 0.5 | 2.1 ± 0.3 | 1.7 ± 0.2 | 1.3 ± 0.3 | 1.3 ± 0.2 | 0.023 |
| Mean islet area (µm2) | 2,589 ± 476 | 4,325 ± 729 | 5,010 ± 594 | 7,493 ± 1393 | 9,377 ± 1163 | < 0.0001 |
| Insulin-positive islet area (µm2) | 1,533 ± 231 | 2,842 ± 500 | 3,374 ± 454 | 5,030 ± 900 | 6,296 ± 639 | < 0.0001 |
| Islet density (islets /mm2) | 27.9 ± 3.5 | 18.3 ± 2.6 | 11.9 ± 1.0 | 6.6 ± 0.7 | 7.3 ± 1.2 | 0.011 |
| Islet number (millions) | 0.98 ± 0.17 | 1.42 ± 0.25 | 1.91 ± 0.43 | 1.31 ± 0.20 | 1.89 ± 0.50 | 0.22 |
| β-Cell nuclear diameter (µm) | 7.35 ± 0.15 | 6.91 ± 0.12 | 7.18 ± 0.13 | 7.43 ± 0.25 | 7.27 ± 0.28 | 0.40 |
| β-Cell diameter (µm) | 11.15 ± 0.10 | 10.77 ± 0.09 | 11.03 ± 0.10 | 11.37 ± 0.15 | 11.19 ± 0.21 | 0.0502 |
Data are means ± SE. P values were calculated by ANOVA.
FIG. 5.
Nuclear diameter (A) and total diameter (B) of β-cells in 46 children aged 2 weeks to 21 years r and P values were calculated by linear regression analysis.
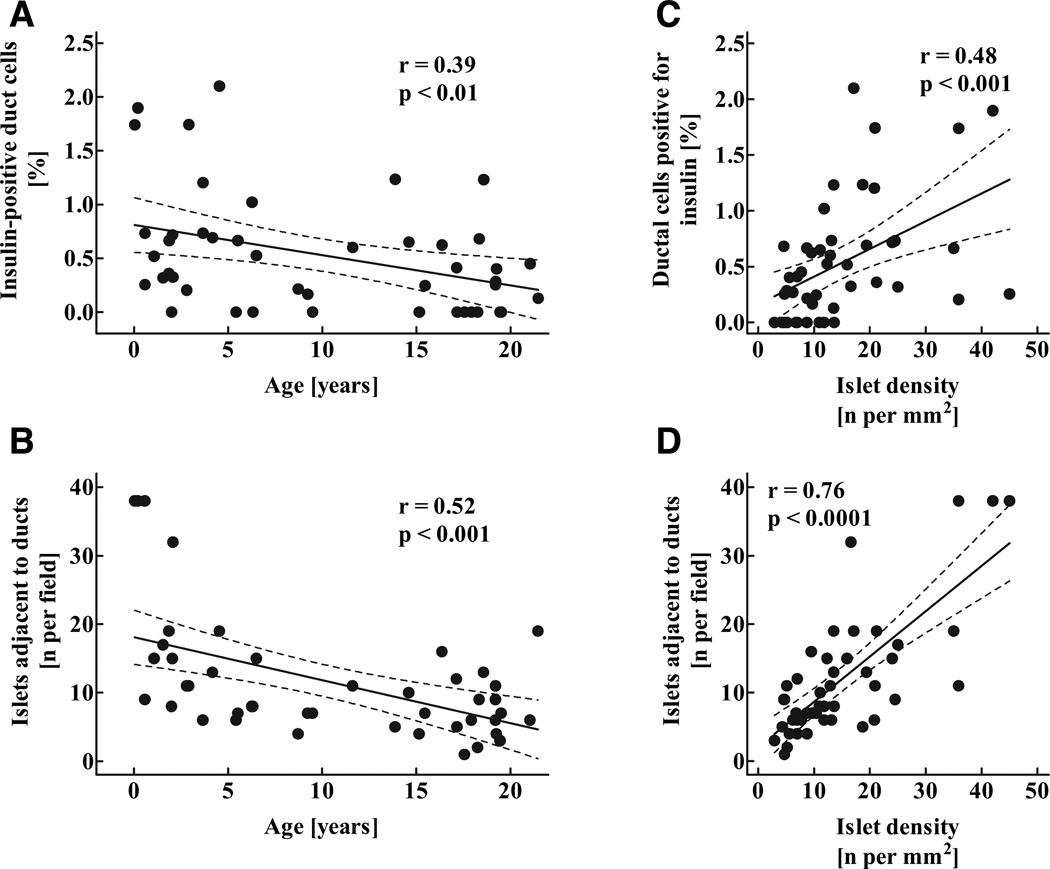
There was a tendency toward a decline in the percentage of ductal cells positive for insulin and number of islets immediately adjacent to exocrine ducts with aging (Fig. 6A and B). This decline in the number of duct-associated islets was parallel to the decline in islet density (Fig. 6C and D) and was opposite to pancreatic acinar growth (21). Therefore, the decline in numbers of islets adjacent to ducts with aging appeared to be most reflective of greater exocrine than endocrine growth after infancy.
FIG. 6.
Percentage of exocrine ductal cells positive for insulin (A), mean number of islets adjacent to (five or less nuclei away) exocrine ducts (B) in 46 children aged 2 weeks to 21 years, as well as correlation between the percentage of ductal cells positive for insulin (C) and the number of islets adjacent to ducts (D) and the mean islet density. Solid lines indicate the regression lines; dashed lines denote the respective upper and lower 95% CIs r and P values were calculated by linear regression analysis.
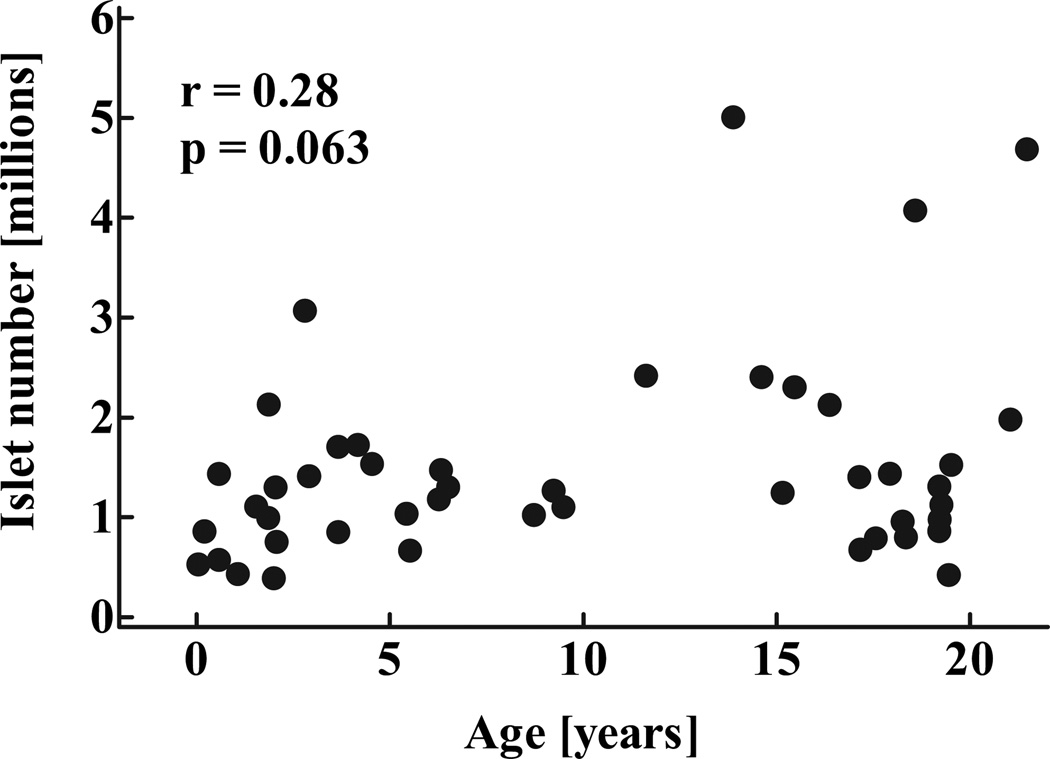
Consistent with the impression that β-cell numbers increased within islets rather than by formation of new islets after infancy, the computed total number of islets remained stable through childhood after infancy (P = 0.22; Fig. 7). Overall, islet number increased by 3.6-fold between the youngest case (2 weeks) and the oldest age-group, whereas β-cell mass increased by 30.5-fold during the same time period (Fig. 8C). Based on these numbers, the contribution of new islet formation to the overall increase in β-cell mass from birth to adolescence was 11.7%, whereas 88.3% of new β-cell formation was manifest as an increase in islet size, apparently from β-cell replication (see below).
FIG. 7.
Total calculated number of islets in 46 children aged 2 weeks to 21 years. Data were computed from evaluation of islet density in pancreas samples and population pancreatic volumes (Fig. 1). Data are presented as individual data points r and P values were calculated by linear regression analysis.
FIG. 8.
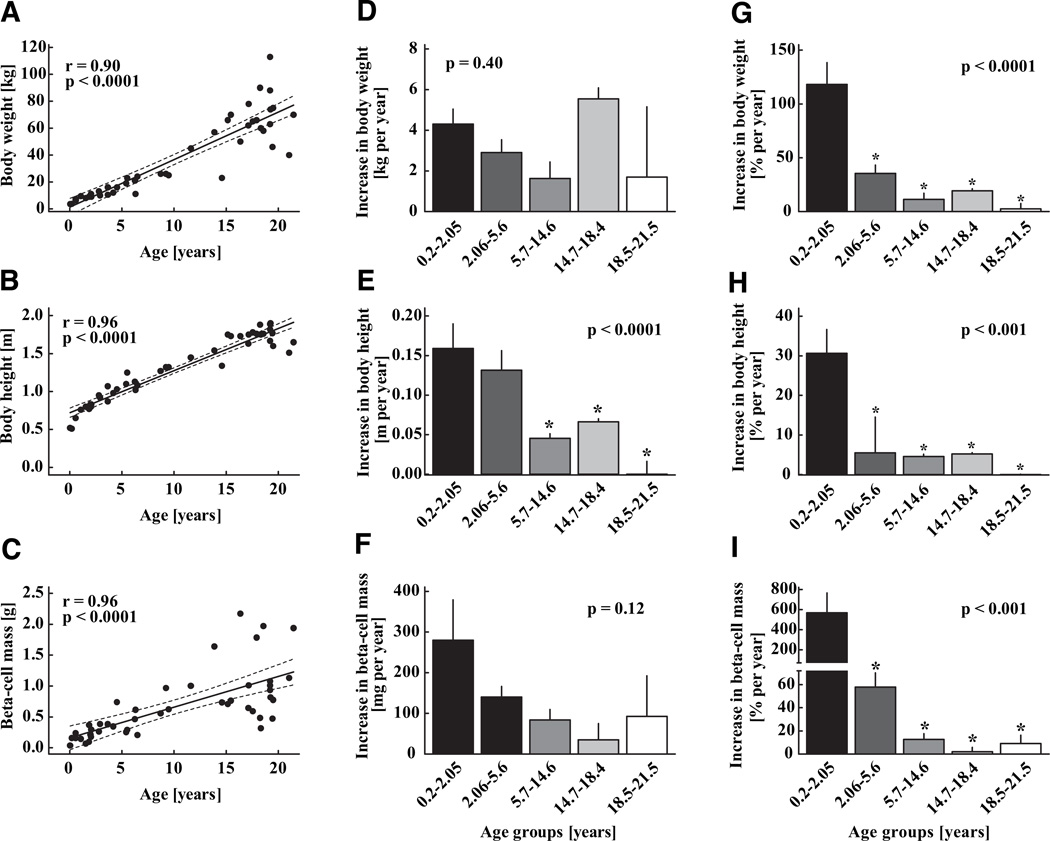
Body weight (A), body height (B), and β-cell mass (C) in 46 children aged 2 weeks to 21 years, shown as individual data. Solid lines indicate the regression lines; dashed lines denote the respective upper and lower 95% CIs r and P values were calculated by linear regression analysis. The absolute and relative increase in each parameter is shown as means ± SE on the middle and right panels (D–I) respectively. For these analyses, the group was divided into equal quintiles. Asterisks indicate significant differences versus the youngest age-group, respectively.
Body weight and height and β-cell mass and number
One of our questions was to establish if there was a secondary increase in the rate of growth of β-cell numbers during adolescence when there is a well-documented acceleration in somatic growth and insulin resistance mediated by increased sex hormones and growth hormone. As expected, body weight and height increased with aging (P < 0.0001; Fig. 8A and B). The increase in somatic growth was greatest in the youngest quintile with a second peak around puberty (Fig. 8). β-Cell mass was calculated as 37 mg in the youngest case (male, 2 weeks) and increased gradually to 1,125 ± 170 mg in the oldest age-group (P < 0.001; Fig. 8C). This corresponded to a total β-cell number of 49 million in the youngest case and 1,553 ± 256 million in the oldest cases (P < 0.001). The rate of increase in β-cell mass (and numbers) was most pronounced in the youngest age-group and gradually declined thereafter (Fig. 8). There was no evidence of a secondary acceleration in growth of β-cell mass around puberty despite a corresponding acceleration of somatic growth. The variance in β-cell mass and presumably growth rate of β-cell mass became increasingly more apparent after ~5 years of age (Fig. 8C).
β-Cell apoptosis
β-Cell apoptosis was very low in all age-groups (means ± SE: 0.0025 ± 0.0025 cells per mm2 β-cell area). This equates to no detectable β-cell apoptosis in most pancreas samples. There were no differences in the frequency of β-cell apoptosis between the age-groups (P = 0.37). Of note, we did not observe any evidence for increased β-cell apoptosis in the youngest cases.
β-Cell replication
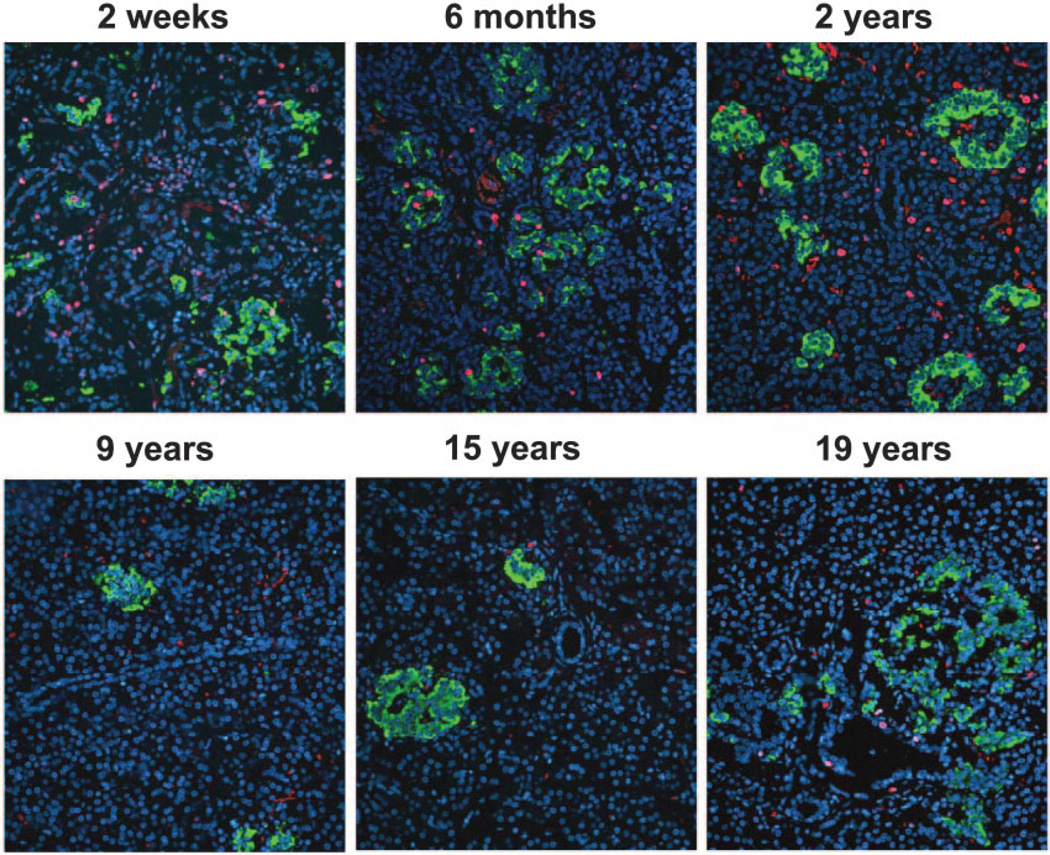
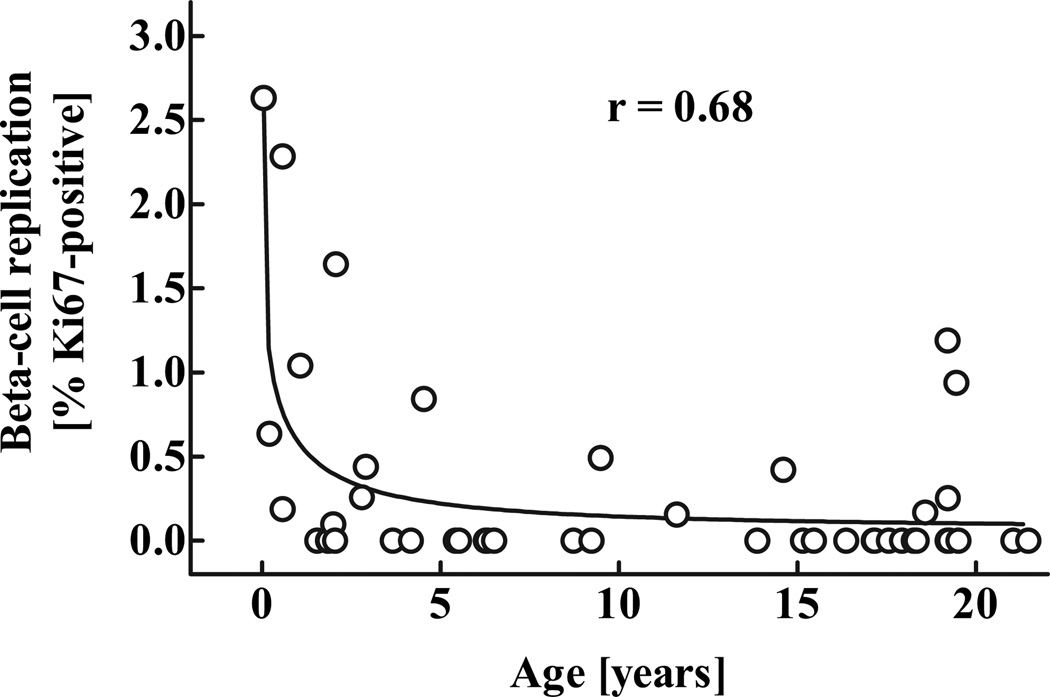
The frequency of β-cell replication was highest in the youngest case (2.6% β-cells positive for Ki67) and substantially decreased in a hyperbola-like fashion thereafter (Figs. 9 and 10). In the youngest cases, both scattered individual β-cells and small islets contained relatively few β-cells and had Ki67-positive nuclei at a much higher frequency than was present in older children or young adults. However, there was a large degree of variability in β-cell replication between individuals, especially in the oldest quintile (range: 0–1.2% β-cells positive for Ki67). Interestingly, the curve for the frequency of β-Cell apoptosis was very low in all age-groups (means ± SE: 0.0025 ± 0.0025 cells per mm2 β-cell area). This equates to no detectable β-cell apoptosis in most pancreas samples. There were no differences in the frequency of β-cell apoptosis between the age-groups (P = 0.37). Of note, we did not observe any evidence for increased β-cell apoptosis β-Cell apoptosis was very low in all age-groups (means ± SE: 0.0025 ± 0.0025 cells per mm2 β-cell area). This equates to no detectable β-cell apoptosis in most pancreas samples. There were no differences in the frequency of β-cell apoptosis between the age-groups (P = 0.37). Of note, we did not observe any evidence for increased β-cell apoptosis -cell replication seemed to follow a similar pattern as the calculated relative increase in β-cell mass in the respective age-groups (Fig. 8).
FIG. 9.
Representative pancreatic sections (same cases as in Fig. 2) stained for insulin (green), Ki67 (red), and 4′,6-diamidino-2-phenylindole dihydrochloride (DAPI) (blue) from six children aged 2 weeks to 19 years. Images were taken at 200 × magnification (20× objective).
FIG. 10.
Frequency of β-cell replication (percent β-cells positive for Ki67) in 46 children aged 2 weeks to 21 years. The r value was calculated using nonlinear regression analysis.
DISCUSSION
In the present studies, we sought to elucidate the extent, pattern, and predominant mechanisms of β-cell growth from birth to adulthood in humans. Based on a combination of abdominal CT scans and morphometric analysis of human pancreatic tissue, we report that 1) β-cell mass expands by severalfold from birth to adulthood; 2) this is accomplished by an increase in numbers of β-cells per islet with a concomitant expansion of islet size rather than an increase in numbers of islets; 3) the relative rate of β-cell formation is greatest in infancy and then declines from youth to adulthood, notably not increasing during adolescence when somatic growth accelerates; and 4) replication of existing β-cells is an important mechanism subserving the postnatal expansion of β-cell numbers, being most evident in infancy when β-cell numbers are increasing most rapidly.
As with all studies, the present study has important limitations. The barriers confronting those who seek to study growth of β-cell mass and β-cell turnover in human childhood are formidable and explain the relative scarcity of available data (22,23). Human pancreas in childhood is difficult to access. Pancreas obtained at autopsy might be influenced by the disease leading to death, by postmortem changes (particularly autolysis), and by ascertainment bias of cases attending a major tertiary medical center.
Finally, the variation in β-cell area and turnover between different pancreas samples is considerable, thereby necessitating a sufficient number of cases to be included in such studies. We sought to minimize these limitations by restricting pancreas to that with no autolysis and where possible to cases with relatively sudden death to avoid the confounding effects of a chronic final illness. By definition, these studies are cross-sectional, since there is no opportunity to measure β-cell mass (or turnover) in vivo in humans on multiple occasions. The normal growth pattern (height and weight; Fig. 8) in our group of cases suggest that the cases were for the most part representative of healthy children until death. Another limitation of these studies is the fact that we examined only the tail of the pancreas, not the whole pancreas. To the extent that the islet development and β-cell turnover in a sample of the tail of the pancreas is not representative of the whole organ, our studies are subject to bias. This limitation is unavoidable, since only the tail of the pancreas is removed at autopsy. A prior study in humans suggests that use of the tail of the pancreas only gives reasonable representation of the whole pancreas with regard to β-cell numbers, although that study was restricted to adults (24). To compensate for the lack of a measured pancreas volume to compute β-cell mass, we previously generated a population curve by CT scan of pancreas volume growth during childhood (21). Pancreatic growth was quite well predicted by the resulting equation although there is of course individual variation that increases after 10 years of age. By including a relatively large sample of autopsy pancreas cases (n = 46) and pancreas CT scans (n = 135), we have sought to limit the bias of these potential sampling errors.
In agreement with Kassem et al. (23), we observed a high frequency of β-cell replication in young children. We report that this is the period of most rapid expansion of β-cell numbers in human childhood, with the growth rate of β-cell numbers and β-cell replication declining after early childhood. In this regard, the postnatal expansion of β-cells in humans is seen to follow the same pattern as that seen in mice (25). The period of most rapid growth in β-cell mass is driven by increased numbers of β-cells per islet but not increased numbers of islets. Indeed, these data provide a cautionary note on the use of periductal islets or intraductal β-cells as a method to indirectly quantify the putative formation of new islets (26). We observe β-cells within exocrine ducts and in small clusters adjacent to ducts in infancy that appear to simply grow in number in parallel with the overall expansion of β-cell numbers in islets, apparently through the predominant mechanism of β-cell replication. Therefore, it is plausible that periductal islets observed in adult humans represent the periductal clusters of β-cells present at birth that subsequently expanded at this site through replication of β-cells. Of course it is not possible to rule out formation of new β-cells through transdifferentiation of periductal precursors in humans; but on the other hand, the appearance of periductal islets is insufficient evidence to support the existence of this alternative pathway. From a pragmatic point of view, the existence of an alternative pathway of β-cell formation independent of duplication of existing β-cells is attractive as a potential tool for β-cell regeneration. Patients with longstanding type 1 diabetes with minimal β-cells would be unlikely to benefit from a strategy dependent on fostering duplication of β-cells while they might be more readily amenable to a therapy that promoted β-cell formation from an alternative pathway such as from a stem cell pool.
β-Cell mass in individuals in each quintile after 5 years of age showed considerable variation between individuals, as previously noted in adult humans (27). Likewise, the frequency of β-cell replication was subject to great interindividual variation. In humans, this variation might reflect a sampling artifact based on the study of a portion of pancreas rather than the whole pancreas and the use of a population pancreas volume. Furthermore, the observed high variation in the frequency of β-cell replication might have been partly due to the limited number of β-cells counted for this quantification (678 cells per case). As such, it is important that we have relatively large groups in each quintile to generate the mean data for each group. Alternatively, it is possible that there is a wide range of growth rates of β-cell mass during childhood. This possibility is supported by similar variance in measured β-cell mass in adult rodents (28) where the whole pancreas is available.
Previous studies in rats and pigs have reported a wave of β-cell apoptosis after birth (29–31). In the present cohort, β-Cell apoptosis was very low in all age-groups (means ± SE: 0.0025 ± 0.0025 cells per mm2 β-cell area). This equates to no detectable β-cell apoptosis in most pancreas samples. There were no differences in the frequency of β-cell apoptosis between the age-groups (P = 0.37). Of note, we did not observe any evidence for increased β-cell apoptosis β-cell apoptosis was low in all cases studied, and we did not observe increased β-cell apoptosis in the youngest cases. This finding is consistent with previous studies in humans, where most remodeling of the endocrine pancreas was shown to occur before or around birth (32). Because the youngest case included in this study was 2 weeks old, this would have occurred before the observation period in the present study.
The incidence of both type 1 and type 2 diabetes is increased in adolescence (33,34). The incidence of type 1 diabetes is also increasing in early childhood (<3 years of age) (33). We report that β-cell mass increases by the greatest increment before 2 years of age (Fig. 8F) and precedes the corresponding greatest increase in growth of body weight (age 15–18 years; Fig. 8D), which coincides with increased insulin demand associated with puberty (35). The discordance in this pattern of growth is actually quite well illustrated in Fig. 8. Collectively, these observations imply that early childhood is characterized by a relative surplus of β-cells, but that by the time of puberty, β-cell numbers are more closely matched to their requirement, providing insight into the peak in incidence of both type 1 and type 2 diabetes in relation to puberty. Our stated hypothesis that there would be a secondary growth phase in β-cell mass in relation to puberty is therefore rejected.
Another implication of the rapid rate of β-cell replication during infancy is that it likely has a relatively major impact on the final adult β-cell mass. Recent genome-wide studies have reported several genes that are involved in cell cycle regulation are linked to risk for type 2 diabetes (36). Intrauterine growth retardation results in a decrease in β-cell mass and increased risk for diabetes (37,38). Collectively, these data suggest that the rapid period of increased β-cell mass during gestation and in infancy might be vulnerable to nutritional, environmental, and genetic factors that influence the ultimate adult β-cell mass and in turn the risk for subsequent development of diabetes.
We conclude that, in humans, recognizable islets form early in infancy from scattered β-cells present at birth. Thereafter, β-cell mass expands by severalfold by adulthood, this being accomplished through increased islet size (and β-cells per islet) rather than increased numbers of islets. The greatest rate of increase in β-cell mass is in infancy, with no obvious secondary phase of increased β-cell mass coincident with the accelerated rate of somatic growth of adolescence. The frequency of β-cell replication parallels the rate of increase in β-cell mass. These data support the notion that postnatal β-cell mass is dynamic, likely affected predominantly through β-cell replication and highly variable between individuals (39). Establishing the mechanisms that promote replication of β-cells in infancy may offer insights into therapeutic approaches to drive β-cell replication as a therapy in early diabetes. Establishing the mechanisms underlying the wide variance of β-cell growth rates between individuals may shed light on the predisposition to diabetes.
ACKNOWLEDGMENTS
These studies were supported by funding from the National Institutes of Health (DK059579, DK077967), the Juvenile Diabetes Research Foundation, the Larry L. Hill-blom Foundation, and the Deutsche Forschungsgemein-schaft (Me 2096/2-1).
Glossary
- CT
computed tomography
REFERENCES
- 1.Meier JJ, Butler PC. Insulin secretion. In: DeGroot LJ, Jameson JL, editors. Endocrinology. Philadelphia, PA: Elsevier Saunders; 2005. pp. 961–973. [Google Scholar]
- 2.Goodner CJ, Koerker DJ, Weigle DS, McCulloch DK. Decreased insulinand glucagon-pulse amplitude accompanying beta-cell deficiency induced by streptozocin in baboons. Diabetes. 1989;38:925–931. doi: 10.2337/diab.38.7.925. [DOI] [PubMed] [Google Scholar]
- 3.Kjems LL, Kirby BM, Welsh EM, Veldhuis JD, Straume M, McIntyre SS, Yang D, Lefebvre P, Butler PC. Decrease in beta-cell mass leads to impaired pulsatile insulin secretion, reduced postprandial hepatic insulin clearance, and relative hyperglucagonemia in the minipig. Diabetes. 2001;50:2001–2012. doi: 10.2337/diabetes.50.9.2001. [DOI] [PubMed] [Google Scholar]
- 4.Leahy JL, Bonner-Weir S, Weir GC. Abnormal glucose regulation of insulin secretion in models of reduced B-cell mass. Diabetes. 1984;33:667–673. doi: 10.2337/diab.33.7.667. [DOI] [PubMed] [Google Scholar]
- 5.Gepts W. Pathologic anatomy of the pancreas in juvenile diabetes mellitus. Diabetes. 1965;114:619–633. doi: 10.2337/diab.14.10.619. [DOI] [PubMed] [Google Scholar]
- 6.Pipeleers D, Ling Z. Pancreatic beta cells in insulin-dependent diabetes. Diabetes Metab Rev. 1992;8:209–227. doi: 10.1002/dmr.5610080303. [DOI] [PubMed] [Google Scholar]
- 7.Meier JJ, Bhushan A, Butler AE, Rizza RA, Butler PC. Sustained beta-cell apoptosis in patients with long-standing type 1 diabetes: indirect evidence for islet regeneration? Diabetologia. 2005;48:2221–2228. doi: 10.1007/s00125-005-1949-2. [DOI] [PubMed] [Google Scholar]
- 8.Butler AE, Janson J, Bonner-Weir S, Ritzel R, Rizza RA, Butler PC. Beta-cell deficit and increased beta-cell apoptosis in humans with type 2 diabetes. Diabetes. 2003;52:102–110. doi: 10.2337/diabetes.52.1.102. [DOI] [PubMed] [Google Scholar]
- 9.Robertson RP. Islet transplantation as a treatment for diabetes: a work in progress. N Engl J Med. 2004;350:694–705. doi: 10.1056/NEJMra032425. [DOI] [PubMed] [Google Scholar]
- 10.Robertson RP, Davis C, Larsen J, Stratta R, Sutherland DE. Pancreas and islet transplantation for patients with diabetes. Diabetes Care. 2000;23:112–116. doi: 10.2337/diacare.23.1.112. [DOI] [PubMed] [Google Scholar]
- 11.Ryan EA, Paty BW, Senior PA, Bigam D, Alfadhli E, Kneteman NM, Lakey JR, Shapiro AM. Five-year follow-up after clinical islet transplantation. Diabetes. 2005;54:2060–2069. doi: 10.2337/diabetes.54.7.2060. [DOI] [PubMed] [Google Scholar]
- 12.Meier JJ, Bhushan A, Butler PC. The potential for stem cell therapy in diabetes. Pediatr Res. 2006;59:65R–73R. doi: 10.1203/01.pdr.0000206857.38581.49. [DOI] [PubMed] [Google Scholar]
- 13.Segev H, Fishman B, Ziskind A, Shulman M, Itskovitz-Eldor J. Differentiation of human embryonic stem cells into insulin-producing clusters. Stem Cells. 2004;22:265–274. doi: 10.1634/stemcells.22-3-265. [DOI] [PubMed] [Google Scholar]
- 14.Brolen GK, Heins N, Edsbagge J, Semb H. Signals from the embryonic mouse pancreas induce differentiation of human embryonic stem cells into insulin-producing p-cell-like cells. Diabetes. 2005;54:2867–2874. doi: 10.2337/diabetes.54.10.2867. [DOI] [PubMed] [Google Scholar]
- 15.Kloppel G, Lohr M, Habich K, Oberholzer M, Heitz PU. Islet pathology and the pathogenesis of type 1 and type 2 diabetes mellitus revisited. Surv Synth Pathol Res. 1985;4:110–125. doi: 10.1159/000156969. [DOI] [PubMed] [Google Scholar]
- 16.Butler AE, Janson J, Soeller WC, Butler PC. Increased beta-cell apoptosis prevents adaptive increase in beta-cell mass in mouse model of type 2 diabetes: evidence for role of islet amyloid formation rather than direct action of amyloid. Diabetes. 2003;52:2304–2314. doi: 10.2337/diabetes.52.9.2304. [DOI] [PubMed] [Google Scholar]
- 17.Bonner-Weir S, Baxter LA, Schuppin GT, Smith FE. A second pathway for regeneration of adult exocrine and endocrine pancreas: a possible recapitulation of embryonic development. Diabetes. 1993;42:1715–1720. doi: 10.2337/diab.42.12.1715. [DOI] [PubMed] [Google Scholar]
- 18.Ianus A, Holz GG, Theise ND, Hussain MA. In vivo derivation of glucosecompetent pancreatic endocrine cells from bone marrow without evidence of cell fusion. J Clin Invest. 2003;111:843–850. doi: 10.1172/JCI16502. [DOI] [PMC free article] [PubMed] [Google Scholar]
- 19.Lechner A, Yang YG, Blacken RA, Wang L, Nolan AL, Habener JF. No evidence for significant transdifferentiation of bone marrow into pancreatic beta-cells in vivo. Diabetes. 2004;53:616–623. doi: 10.2337/diabetes.53.3.616. [DOI] [PubMed] [Google Scholar]
- 20.Butler AE, Huang A, Rao PN, Bhushan A, Hogan WJ, Rizza RA, Butler PC. Hematopoietic stem cells derived from adult donors are not a source of pancreatic beta-cells in adult nondiabetic humans. Diabetes. 2007;56:1810–1816. doi: 10.2337/db06-1385. [DOI] [PubMed] [Google Scholar]
- 21.Saisho Y, Butler AE, Meier JJ, Monchamp T, Allen-Auerbach M, Rizza RA, Butler PC. Pancreas volumes in humans from birth to age one hundred taking into account sex, obesity and presence of type 2 diabetes. ClinAnat. 2007;20:933–942. doi: 10.1002/ca.20543. [DOI] [PMC free article] [PubMed] [Google Scholar]
- 22.Ogilvie RF. A quantitative estimation of the pancreatic islet tissue. QJ Med. 1937;6:287–300. doi: 10.2337/diab.4.5.367. [DOI] [PubMed] [Google Scholar]
- 23.Kassem SA, Ariel I, Thornton PS, Scheimberg I, Glaser B. Beta-cell proliferation and apoptosis in the developing normal human pancreas and in hyperinsulinism of infancy. Diabetes. 2000;49:1325–1333. doi: 10.2337/diabetes.49.8.1325. [DOI] [PubMed] [Google Scholar]
- 24.Yoon KH, Ko SH, Cho JH, Lee JM, Ahn YB, Song KH, Yoo SJ, Kang MI, Cha BY, Lee KW, Son HY, Kang SK, Kim HS, Lee IK, Bonner-Weir S. Selective beta-cell loss and alpha-cell expansion in patients with type 2 diabetes mellitus in Korea. J Clin Endocrinol Metab. 2003;88:2300–2308. doi: 10.1210/jc.2002-020735. [DOI] [PubMed] [Google Scholar]
- 25.Georgia S, Bhushan A. Beta cell replication is the primary mechanism for maintaining postnatal beta cell mass. J Clin Invest. 2004;114:963–968. doi: 10.1172/JCI22098. [DOI] [PMC free article] [PubMed] [Google Scholar]
- 26.Bonner-Weir S. Beta-cell turnover: its assessment and implications. Diabetes. 2001;50(Suppl. 1):S20–S24. doi: 10.2337/diabetes.50.2007.s20. [DOI] [PubMed] [Google Scholar]
- 27.Ritzel RA, Butler AE, Rizza RA, Veldhuis JD, Butler PC. Relationship between beta-cell mass and fasting blood glucose concentration in humans. Diabetes Care. 2006;29:717–718. doi: 10.2337/diacare.29.03.06.dc05-1538. [DOI] [PubMed] [Google Scholar]
- 28.Matveyenko AV, Butler PC. Beta-cell deficit due to increased apoptosis in the human islet amyloid polypeptide transgenic (HIP) rat recapitulates the metabolic defects present in type 2 diabetes. Diabetes. 2006;55:2106–2114. doi: 10.2337/db05-1672. [DOI] [PubMed] [Google Scholar]
- 29.Scaglia L, Cahill CJ, Finegood DT, Bonner-Weir S. Apoptosis participates in the remodeling of the endocrine pancreas in the neonatal rat. Endocrinology. 1997;138:1736–1741. doi: 10.1210/endo.138.4.5069. [DOI] [PubMed] [Google Scholar]
- 30.Finegood DT, Scaglia L, Bonner-Weir S. Dynamics of beta-cell mass in the growing rat pancreas: estimation with a simple mathematical model. Diabetes. 1995;44:249–256. doi: 10.2337/diab.44.3.249. [DOI] [PubMed] [Google Scholar]
- 31.Bock T, Kyhnel A, Pakkenberg B, Buschard K. The postnatal growth of the beta-cell mass in pigs. J Endocrinol. 2003;179:245–252. doi: 10.1677/joe.0.1790245. [DOI] [PubMed] [Google Scholar]
- 33.Pundziute-Lycka A, Dahlquist G, Nystrom L, Arnqvist H, Bjork E, Blohme G, Bolinder J, Eriksson JW, Sundkvist G, Ostman J. The incidence of type I diabetes has not increased but shifted to a younger age at diagnosis in the 0–34 years group in Sweden 1983–1998. Diabetologia. 2002;45:783–791. doi: 10.1007/s00125-002-0845-2. [DOI] [PubMed] [Google Scholar]
- 34.Dabelea D, Hanson RL, Bennett PH, Roumain J, Knowler WC, Pettitt DJ. Increasing prevalence of type II diabetes in American Indian children. Diabetologia. 1998;41:904–910. doi: 10.1007/s001250051006. [DOI] [PubMed] [Google Scholar]
- 35.Moran A, Jacobs DR, Jr, Steinberger J, Hong CP, Prineas R, Luepker R, Sinaiko AR. Insulin resistance during puberty: results from clamp studies in 357 children. Diabetes. 1999;48:2039–2044. doi: 10.2337/diabetes.48.10.2039. [DOI] [PubMed] [Google Scholar]
- 36.Zeggini E, Weedon MN, Lindgren CM, Frayling TM, Elliott KS, Lango H, Timpson NJ, Perry JR, Rayner NW, Freathy RM, Barrett JC, Shields B, Morris AP, Ellard S, Groves CJ, Harries LW, Marchini JL, Owen KR, Knight B, Cardon LR, Walker M, Hitman GA, Morris AD, Doney AS. Wellcome Trust Case Control Consortium, McCarthy MI, Hattersley AT: Replication of genome-wide association signals in UK samples reveals risk loci for type 2 diabetes. Science. 2007;316:1336–1341. doi: 10.1126/science.1142364. [DOI] [PMC free article] [PubMed] [Google Scholar]
- 37.Harder T, Rodekamp E, Schellong K, Dudenhausen JW, Plagemann A. Birth weight and subsequent risk of type 2 diabetes: a meta-analysis. Am J Epidemiol. 2007;165:849–857. doi: 10.1093/aje/kwk071. [DOI] [PubMed] [Google Scholar]
- 38.Simmons RA, Templeton LJ, Gertz SJ. Intrauterine growth retardation leads to the development of type 2 diabetes in the rat. Diabetes. 2001;50:2279–2286. doi: 10.2337/diabetes.50.10.2279. [DOI] [PubMed] [Google Scholar]
- 39.Meier JJ, Butler AE, Galasso R, Rizza RA, Butler PC. Increased islet beta cell replication adjacent to intrapancreatic gastrinomas in humans. Diabetologia. 2006;49:2689–2696. doi: 10.1007/s00125-006-0410-5. [DOI] [PubMed] [Google Scholar]


