

Abstract
Objective
To compare, in mice, the accuracy of estimates of energy expenditure using an energy balance technique (TEEbal : food energy intake and body composition change) versus indirect calorimetry (TEEIC).
Subjects
In 32 male C57BL/6J mice energy expenditure was estimated using an energy balance (caloric intake minus change in body energy stores) method over a 37 day period. Energy expenditure was also measured in the same animals by indirect calorimetry. These measures were compared.
Results
The two methods were highly correlated (r2 = 0.87: TEEbal = 1.07 * TEEIC − 0.22, p < 0.0001). By Bland-Altman analysis, TEEbal estimates were slightly higher (4.6±1.5%; p < 0.05) than TEEIC estimates (Bias = 0.55 kcal/24h).
Conclusion
TEEbal can be performed in “home cages” and provides an accurate integrated long-term measurement of energy expenditure while minimizing potentially confounding stress that may accompany the use of indirect calorimetry systems. The technique can also be used to assess long term energy intake.
Keywords: Obesity, Indirect Calorimetry, Metabolism
Introduction
Changes in body mass and chemical composition in response to over- or under- feeding must conform to a biological restatement of the first law of thermodynamics:
| [Equation 1] |
Measurement of any two components allows calculation of the third. Each component can be directly measured, but experimental circumstances may favor indirect estimates because of a desire to obtain prolonged measures, the relative accuracies of the respective measurements, and the availability of suitable instrumentation.
The energy balance method (EBM) has been used in human studies to estimate energy expenditure (EE) by titrating energy intake (EI) to achieve stability of body weight and composition 1, 2. Conversely, measures of EE, by the “doubly labeled water” technique, have been used in conjunction with changes in body composition to estimate EI in human subjects3. Rodent models have been used to assess the relationship between food intake measures with body weight equilibrium using equations derived from the energy balance equation 4. Mathematical modeling based on the balance equation, using body weight and food intake measurements were recently shown to produce accurate estimates of long term changes in energy expenditure and fat oxidation 5. Here we describe the performance of an energy balance technique that can be used to measure long term energy expenditure (or intake) in mice. We measured energy intake and changes in body mass and composition over a 37-day period, and used these measurements to estimate total energy expenditure (TEEbal). These estimates of TEEbal were highly correlated with those obtained by indirect calorimetry (TEE IC ; r2 = 0.87: TEEbal = 1.07 * TEEIC − 0.22, p < 0.0001). The balance technique is particularly useful for long term measures of energy expenditure and does not require a calorimeter. This balance technique is accurate, can be used long term, is low cost and decreases the possible confound incurred by placing mice into new environments that modify behavior and energy expenditure.6
Materials & Methods
Experimental Design
Sixteen diet-induced obese (DIO – fed Research Diets, Inc. D12492i, 60% calories as fat = “HFD”), and sixteen control diet fed (Research Diets, Inc. D12450Bi, 10 % calories as fat = “CON”) C57BL/6J-male mice were obtained at 18 weeks of age from the Jackson Laboratory (Bar Harbor, ME). These animals had been fed these respective diets since 6 weeks of age. Individually housed animals from both diet groups were randomized to remain on the ad-lib diets (DIO-AL and CON-AL) or to be calorically restricted to decrease their body weight by ~20% over a 1–2 week period by twice daily feeding of reduced quantities (50% of ad-libitum intake) of their respective diets. After a 20 ±1% weight reduction, weight-reduced (DIO-WR and CON-WR) mice were provided calories sufficient to stabilize their weights for an additional 23 weeks. Nine weeks after initiation of the weight reduction protocol (Figure 1A, denoted day 0), body weights (daily for all mice) and food intake (FI; daily for WR and every two days for AL mice) were recorded for the next 93 days, except on days when mice were in the calorimeter. Metabolizable energy intake (MEI), defined as grams of food ingested per 24h (weighed using custom-made stainless steel feeding baskets that minimized spillage - Dieter Wenzel; Detmold, Germany) multiplied by the metabolizable energy for the respective diets (5.24 Kcal/g for high fat (HFD) and 3.85 Kcal/g for the control (CON) diet), was calculated from the FI measurements. The first day of this 93 day period is designated as day 0 (Figure 1A). The 93 days following day 0 are divided into 3 measurement periods (Figure 1A):
Figure 1.


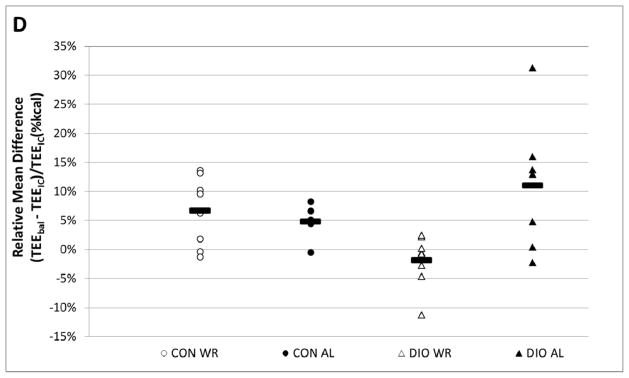

A. Body weights during experimental periods. TEEbal estimated using energy balance method and TEEIC determined using indirect calorimetry. During the 30 day interval shown, each mouse spent 72 hours in the calorimetry chamber; the last 48 hours of this period were used to estimate TEEIC. B. Regression analysis of total energy expenditure (TEE) by energy balance method (TEEbal) and indirect calorimetry (TEEIC). Dashed line is y = x. Four large symbols represent group means and error bars are SEM for both TEEbal (ordinate) and TEEIC (abscissa). C. Bland-Altman plot (aka “Tukey difference-mean plot”) of both methods. Solid black line represents “bias” (arithmetic mean of differences: TEEbal - TEEIC) and dashed black lines represent “bias” ± 1.96SD of differences =“limits of agreement” (LOA). D. Relative mean difference plot: (TEEbal - TEEIC)/TEEIC). Solid black bars are mean values for each group. E. Plot showing number of days of energy intake needed to achieve a specified accuracy true mean food intake.
TEE bal: A 37-day period used to estimate TEE using an energy balance method (days 0 – 37)
TEE IC: Each mouse underwent a 72 hour indirect calorimetry session (TEE calculated using last 48 hours). These studies were conducted over a 28 day period (days 37 – 65) in four cohorts of 7 or 8 mice. Body weights of mice were not measured during their time in the chambers; thus, we have excluded all body weight data obtained during this period (see Figure 1A ).”
All days excluding indirect calorimetry days (when MEI was not recorded) were used to determine – by autocorrelation and power analyses - the minimum number of days of FI required to estimate MEI to within various levels of accuracy.
One DIO-AL mouse died during the study and data from one CON-AL mouse were not included due to malfunction of the calorimetry chamber. Aspects of this study have been described previously 7. All protocols were approved by the Columbia University Institutional Animal Care and Use Committee.
On day 0, day 37, and following each 72-hour calorimetry period, body composition was determined using a Bruker Minispec mouse TD-NMR analyzer (Bruker Inc, Billerica MA) 8. All body composition measurements were made at 8–9 am, before weight reduced animals were fed.
Measures of Metabolizable Energy Intake (MEI) and Energy Expenditure (TEE)
MEI was recorded every two days for the ad libitum-fed mice. For WR mice, MEI was recorded daily and 1/3 and 2/3 of the daily food ration was provided at 8–8:30 am and 6:30–7 pm, respectively.
Energy expenditure was measured with a LabMaster-CaloSys-Calorimetry System (TSE Systems, Bad Homburg, Germany). Calibration of the system was performed as per the manufacturer’s guidelines. The rates of O2 consumption and CO2 production were measured every 14 minutes during a 72 hour period. In calculating TEE, potential confounds due to stress of being placed in calorimetry chambers was minimized by using data from only the final 48 hours of the 72 hour period 7.
Estimates of TEE using energy balance (TEEbal)
MEI and interim changes in body mass and composition were used to estimate TEE over a 37-day period (TEEbal) 1. Energy expenditure was calculated as MEI +/− the change in somatic energy stores 9, 10 (see equation 2 below). We assigned caloric equivalents for FM=9.4kcal/gm and FFM=1.0 kcal/gm gained or lost 9, 10.
Equation 2 (below) was used to calculate TEEbal:
| [Equation 2] |
TEEbal was compared to TEEIC – expressed as kcal per 24 hrs – on a per mouse basis (Figure 1B).
Determination of minimal duration of FI to accurately estimate MEI
In order to test the day-to-day independence of the MEI data collected over days 0 – 37 and days 67 – 104 (total of 65 days: Figure 1), a condition that must be fulfilled in order to perform a power calculation estimating the minimum duration of FI measurements required to obtain a specific level of accuracy of MEI, an autocorrelation analysis was conducted for each animal 11.
To determine the minimum number of days required to estimate an individual animal’s 24 hour food intake to within 5% and 10% of the mean MEI for all animals as a group, we used the relationship:
| [Equation 3] |
Where x̄ is the mean 24 hour food energy intake (over 65 days) of each of the 15 AL mice and y is a specified degree of error expressed as a percentage. The product of mean MEI for a mouse and the selected level of error (5% and 10% for each mouse) is related to an estimate of the 95 % confidence interval for the SEM ( ) of the mean MEI for each AL-fed mouse where σ is the standard deviation for MEI and n is the number of days of measured energy intake. x̄ and σ were estimated for each mouse using the entire 65 day period during which MEI was measured. Here we arbitrarily stipulated that the SEM for any mouse should be less than or equal to 5% or 10% of the mean (i.e. 0.05 or 0.10 * x̄) and then solved for the requisite n (number of days of food intake measurement) for each mouse. Mean ± SEM and confidence intervals were constructed for the estimates of n obtained for the 15 AL mice using both 5% and 10% error in equation above. By using Equation 3 and solving for all y% (assigning n in unit integers from n1…n67) a plot was constructed for 15 AL mice, indicating the number of days of energy intake needed to obtain a given level of accuracy of energy expenditure: Figure 1E).
Statistical Analysis
Data analysis was performed using JMP 8.0.2 Statistical Discovery Software (SAS Institute, Cary, NC). Student’s t-test for paired samples was used to assess differences in estimates of TEEbal and TEEIC.
Results
In this study, we describe an energy balance method using food intake and changes in body weight and composition to determine mean total 24 hour energy expenditure (TEEbal) and validate its use by comparing these results with by indirect calorimetry (TEEIC) (Figure 1A).
TEEIC vs. TEEbal: Correlation Analysis
Estimates of TEEIC and TEEbal (37 day measurement) were highly correlated (TEEbal = 1.07 * TEEIC − 0.22, r2 = 0.87; p < 0.0001 Figure 1B). No significant differences between TEEIC and TEEbal were identified by direct t-test comparison (p = 0.60) and by paired t-test analysis using only WR mice, whose food intake is the most precisely known since rations – that were completely consumed – were provided by us twice daily (p = 0.65).
TEEIC vs. TEEbal: Bland-Altman and Relative mean differences plots
A Bland-Altman plot (aka Tukey difference mean plot 12), a method used to assess the concordance between two methods measuring the same variable, indicates that TEEbal estimates are slightly but significantly higher (4.6±1.5%; p < 0.05) than TEEIC estimates (Bias = 0.55 kcal/24h; see solid black line Figure 1C) when including all groups of animals. A relative mean difference value for each mouse was calculated by dividing the difference between the methods (TEEbal - TEEIC) by TEEIC for each pair of measures (Figure 1D). Close agreement was found between estimates of TEEbal and TEEIC, in both absolute (mean difference of 0.56±0.18 kcal/24h; 95% CI: 0.2 to 0.9 kcal/24h; Figure 1C) and relative (mean difference of 4.9±1.4%; 95% CI: −1.9 to 9.3%; Figure 1D) terms.
Duration of MEI required
Temporal analyses revealed strong and significant (p<0.01) autocorrelation of daily energy intake in the WR but not the AL mice, presumably because, in the WR, food rations were adjusted daily in 0.1 g units based on the previous days ration and intercurrent changes in body weight. No autocorrelation was detected for AL mice (n = 15) - establishing the independence and randomness of the FI measurements in mice from these groups. Therefore, power calculations were conducted using Equation 3 on AL mice only. The average minimal days required for AL mice to fall within 10% and 5% of the mean was 4.3±0.5 (CI: 3.3 – 5.3) and 17.2±1.9 (CI: 13.1 – 21.4) days, respectively. Twenty one days of continuous energy intake measurements provide 95% confidence that the surrogate measure of energy intake will be within 5% of “true” mean energy intake for that animal and can be used in conjunction with intercurrent changes in body composition over the time period MEI was measured (using equation 2) to estimate TEEbal (Figure 1E).
Body weight and body composition used in TEEbal
During the 37-day TEEbal measurement, body weight increased slightly in DIO-AL (+0.6g), DIO-WR (+0.5g), and CON-AL (+0.4) but was unchanged in CON-WR mice. Most of the increased body weight was accounted for by increased fat mass. The changes in body composition fell within the range of the sensitivity of the NMR device. We have previously shown that NMR estimates of FFM and FM are virtually identical to chemical composition analysis (r2 = 0.99 for both FM and FFM; p < 0.05) and intra-individual within-day CV (4 measurements per mouse) were 2.8±2.7% (CI: 0.0–10.0) for FM and 2.2±1.0 (CI: 0.6–5.0)% for FFM 8.
Discussion
The strong correlation between TEEbal and TEEIC (r2 = 0.87; p < 0.0001) indicates that the TEEbal method – using energy intake and changes in somatic mass and composition - can provide a valid estimate of long term TEE (Figure 1B). The Bland-Altman plot - used to assess the degree of agreement between the two measures 13 - indicates that the methods are closely concordant. The two methods differ by only 0.55 kcal/24h (4.6±1.8%) (see bias; Figure 1C). Four out of seven DIOAL mice showed a difference between TEEbal and TEEIC greater than 10%, whereas only 2 mice from all other groups (total = 23) combined showed such a difference (Figure 1D). The larger differences seen in the DIO-AL group may be the result of the friability of the high fat diet - fragments of which are easily concealed in the bedding - potentially leading to overestimates of ad-libitum food intake. This problem is minimized when using less friable diets, and is reflected in the smaller range of relative mean differences seen in the CON diet fed groups of mice (Figure 1D). When the four DIO-AL mice that showed a greater than 10% difference between estimates of TEE are excluded from the analysis, the correlation between methods is improved (TEEbal = 0.91 * TEEIC + 1.22, r2 = 0.94; p < 0.0001), and the difference between methods is decreased (bias = 0.21 kcal/24h).
TEEbal has advantages over TEEIC. Indirect calorimetry systems require that mice be transferred from home cages to specialized units whose novelty can create stress and/or behavioral changes. Logistical considerations frequently limit the duration of calorimetry studies to 48–72 hours. Balance measurements can be conducted over extended periods of time with animals in their home cages. Long duration studies conducted in this way will detect subtle differences in energy expenditure not detectable by short term calorimetry. However, the balance technique cannot assess diurnal variations in energy expenditure or directly determine RQ (which could, however, be estimated from diet composition and changes in body composition).
The power analyses using AL fed mice only suggests that 21 of FI measurements will provide a measure of MEI to within +/− 5% of true mean 95% of the time (Figure 1E). This estimate is quite conservative and therefore shorter time periods may be acceptable depending on experimental requirements and the accuracy of FI measurements.
Additional considerations
Accuracy of body composition measures are critical for correctly estimating energy expenditure using TEEbal technique with these errors being amplified as the number of days of measured food intake decreases 8. The accuracy and precision of the Bruker Minispec TD NMR is sufficient to detect the changes in body composition observed in most of our cohort of mice (Table 1) 8. A consideration in assessing the general applicability of the current study is the relatively small change in body weight observed in many of the animals during the course of the TEEbal measurements. As a result, some of the changes in body composition (hence, somatic energy content) fell within the margin of error of the NMR. In studying animal during dynamic periods of weight change due to diet or other manipulations, this technique would be very apt, since the changes in somatic energy stores are likely to be relatively large 5. We used 37 days for the TEEbal calculation, a sufficiently long time period to accurately estimate energy intake since it is longer than the estimated 21 days calculated to to be within 5% of mean MEI (Figure 1E). Some of the discrepancies between TEEbal and TEEIC, especially in the DIO-AL group, may be a result of the overestimation of MEI due to the fragility of the HFD as mentioned above. Feeding strategies aimed at minimizing inaccuracies due to inadvertent loss of diet will diminish such confounds. Since suitable controls are generally studied in parallel, these effects are usually minimized in terms of their influence on inferences reached regarding the biology under study. An additional consideration is differences in the efficiency of extraction of calories from the diet. Fecal energy loss could have differed between the WR and AL groups; however, several studies have shown that there is no appreciable difference in the capacity of extraction of calories between WR and AL rodents 14–16. However, if animals ingesting diets of different compositions are compared, possible differences in the efficiency of caloric extraction would need to be measured and accounted for in relevant calculations. Likewise, loss of calories in the urine of diabetic or nephropathic animals would have to be included. For example, C57BL/6J can become transiently hyperglycemic when made obese 17. In the animals reported here, blood glucose concentrations did not exceed 125±3mg/dl, indicating that urinary glucose loss was not an issue. Ambient room temperature has large effects on energy expenditure in mice due to their high surface to volume ratio18 and should be considered when designing studies assessing energy expenditure and/or energy intake parameters.
Table 1.
Mean body weight and body composition (g±sem) at initial and final days of TEEbal period.
| Initial - Day 0
|
Final - Day 37
|
|||||
|---|---|---|---|---|---|---|
| BW (g) | FFM (g) | FM (g) | BW (g) | FFM (g) | FM (g) | |
|
|
|
|||||
| DIO AL | 49.0±0.9 | 23.5±0.4 | 16.1±1.0 | 49.6±1.2 | 23.5±0.6 | 16.7±0.9 |
| DIO WR | 33.6±1.1 | 19.7±0.2 | 6.6±0.7 | 34.1±1.1 | 20.1±0.3 | 7.1±0.7 |
| CON AL | 32.4±1.0 | 20.3±0.3 | 4.7±0.7 | 32.8±1.0 | 20.2±0.2 | 5.1±0.8 |
| CON WR | 21.7±0.5 | 14.7±0.3 | 1.6±0.1 | 21.7±0.5 | 14.8±0.3 | 1.7±0.1 |
Finally, indirect calorimetry - the nominal “gold standard” for measurement of energy expenditure – has technical limitations affecting both the sensitivity and accuracy of the instruments 19. Differences in estimated TEE observed between TEEbal and TEEIC are necessarily the product of aggregate errors in all measurements obtained to permit the comparison.
The approach described here can, of course, also be used to estimate long term spontaneous energy intake by using direct measures of TEE and body composition and solving Equation 2 for MEI. Serial measurements of TEE and body composition would be best, to control for intercurrent changes in both parameters due to growth. In humans, the determination of ad-libitum energy intake to the level of accuracy required to assess the relative contributions of energy intake and expenditure to weight change using currently available methods is sufficiently inaccurate 20 to render such measures of little help in assessing the subtle long term imbalances between energy intake and expenditure that account for most obesity in humans 21. By combining long term measurements of energy expenditure (differential rates of excretion of 2H2O and H218O) with precise measurements of body composition, the energy balance equation can be “solved” for energy intake 3, 22. This approach could be tested for accuracy by conducting such a study in a room calorimeter in conjunction with bomb calorimetry of a weighed diet.
Acknowledgments
Grants/Acknowledgements
This work was supported by National Institutes of Health Grants RO1-DK-066518, P30-DK-026687, ADA-1-08-RA-36, and a research grant from AstraZeneca. We thank Dr. Marc Reitman for comments on the manuscript.
Footnotes
The authors declare no conflict of interest.
References
- 1.Leibel RL, Rosenbaum M, Hirsch J. Changes in energy expenditure resulting from altered body weight. N Engl J Med. 1995;332(10):621–8. doi: 10.1056/NEJM199503093321001. [DOI] [PubMed] [Google Scholar]
- 2.Yang MU, Wang J, Pierson RM, Jr, Van Itallie TB. Estimation of composition of weight loss in man: a comparison of methods. J Appl Physiol. 1977;43(2):331–8. doi: 10.1152/jappl.1977.43.2.331. [DOI] [PubMed] [Google Scholar]
- 3.de Jonge L, DeLany JP, Nguyen T, Howard J, Hadley EC, Redman LM, et al. Validation study of energy expenditure and intake during calorie restriction using doubly labeled water and changes in body composition. Am J Clin Nutr. 2007;85(1):73–9. doi: 10.1093/ajcn/85.1.73. [DOI] [PMC free article] [PubMed] [Google Scholar]
- 4.Gettys TW, Mills S, Henricks DM. An evaluation of the relation between food consumption rate and equilibrium body-weight in male rats. Br J Nutr. 1988;60(1):151–60. doi: 10.1079/bjn19880084. [DOI] [PubMed] [Google Scholar]
- 5.Guo J, Hall KD. Estimating the continuous-time dynamics of energy and fat metabolism in mice. PLoS Comput Biol. 2009;5(9):e1000511. doi: 10.1371/journal.pcbi.1000511. [DOI] [PMC free article] [PubMed] [Google Scholar]
- 6.Arch JR, Hislop D, Wang SJ, Speakman JR. Some mathematical and technical issues in the measurement and interpretation of open-circuit indirect calorimetry in small animals. Int J Obes (Lond) 2006;30(9):1322–31. doi: 10.1038/sj.ijo.0803280. [DOI] [PubMed] [Google Scholar]
- 7.Ravussin Y, Gutman R, Diano S, Shanabrough M, Borok E, Sarman B, et al. Effects of Chronic Weight Perturbation on Energy Homeostasis and Brain Structure in Mice. Am J Physiol Regul Integr Comp Physiol. 2011 doi: 10.1152/ajpregu.00429.2010. [DOI] [PMC free article] [PubMed] [Google Scholar]
- 8.Halldorsdottir S, Carmody J, Boozer C, LeDuc CA, Leibel RL. Reproducibility and Accuracy of Body Composition Assessments in Mice by Dual Energy X-ray Absorptiometry and Time Domain Nuclear Magnetic Resonance. International Journal of Body Composition Research. 2009;7(4):147–154. [PMC free article] [PubMed] [Google Scholar]
- 9.Pullar JD, Webster AJ. The energy cost of fat and protein deposition in the rat. Br J Nutr. 1977;37(3):355–63. doi: 10.1079/bjn19770039. [DOI] [PubMed] [Google Scholar]
- 10.Schulz LO, Alger S, Harper I, Wilmore JH, Ravussin E. Energy expenditure of elite female runners measured by respiratory chamber and doubly labeled water. J Appl Physiol. 1992;72(1):23–8. doi: 10.1152/jappl.1992.72.1.23. [DOI] [PubMed] [Google Scholar]
- 11.Dutilleul P. Rhythms and Autocorrelation Analysis. Biological Rhythm Research. 1995;26(2):173–193. [Google Scholar]
- 12.Bland JM, Altman DG. Comparing methods of measurement: why plotting difference against standard method is misleading. Lancet. 1995;346(8982):1085–7. doi: 10.1016/s0140-6736(95)91748-9. [DOI] [PubMed] [Google Scholar]
- 13.Bland JM, Altman DG. Statistical methods for assessing agreement between two methods of clinical measurement. Lancet. 1986;1(8476):307–10. [PubMed] [Google Scholar]
- 14.Apfelbaum M. Adaptation to changes in caloric intake. Prog Food Nutr Sci. 1978;2(11–12):543–59. [PubMed] [Google Scholar]
- 15.Forsum E, Hillman PE, Nesheim MC. Effect of energy restriction on total heat production, basal metabolic rate, and specific dynamic action of food in rats. J Nutr. 1981;111(10):1691–7. doi: 10.1093/jn/111.10.1691. [DOI] [PubMed] [Google Scholar]
- 16.Rikke BA, Yerg JE, 3rd, Battaglia ME, Nagy TR, Allison DB, Johnson TE. Strain variation in the response of body temperature to dietary restriction. Mech Ageing Dev. 2003;124(5):663–78. doi: 10.1016/s0047-6374(03)00003-4. [DOI] [PubMed] [Google Scholar]
- 17.Surwit RS, Kuhn CM, Cochrane C, McCubbin JA, Feinglos MN. Diet-induced type II diabetes in C57BL/6J mice. Diabetes. 1988;37(9):1163–7. doi: 10.2337/diab.37.9.1163. [DOI] [PubMed] [Google Scholar]
- 18.Overton JM. Phenotyping small animals as models for the human metabolic syndrome: thermoneutrality matters. Int J Obes (Lond) 2010;34 (Suppl 2):S53–8. doi: 10.1038/ijo.2010.240. [DOI] [PubMed] [Google Scholar]
- 19.Levine JA. Measurement of energy expenditure. Public Health Nutr. 2005;8(7A):1123–32. doi: 10.1079/phn2005800. [DOI] [PubMed] [Google Scholar]
- 20.Schoeller DA. Limitations in the assessment of dietary energy intake by self-report. Metabolism. 1995;44(2 Suppl 2):18–22. doi: 10.1016/0026-0495(95)90204-x. [DOI] [PubMed] [Google Scholar]
- 21.Rosenbaum M, Leibel RL. Adaptive thermogenesis in humans. Int J Obes (Lond) 2010;34 (Suppl 1):S47–55. doi: 10.1038/ijo.2010.184. [DOI] [PMC free article] [PubMed] [Google Scholar]
- 22.Thomas DM, Schoeller DA, Redman LA, Martin CK, Levine JA, Heymsfield SB. A computational model to determine energy intake during weight loss. Am J Clin Nutr. 2010;92(6):1326–31. doi: 10.3945/ajcn.2010.29687. [DOI] [PMC free article] [PubMed] [Google Scholar]