

Summary
The ability of cells to sense geometrical/physical constraints of local environment is important for cell movements during development, immune surveillance, and in cancer invasion. In this paper, we quantify “front-rear” polarization – the crucial step in initiating cell migration – based on cytoskeleton and substrate adhesion anisotropy in micropatterned cells of well-defined shapes. We then show that the general viewpoint that asymmetric cell shape is one of the defining characteristics of polarized cells is incomplete. Specifically, we demonstrate that cells on circular micropatterned islands can exhibit asymmetric distribution of both filamentous actin (f-actin) and focal adhesions (FAs) as well as directional, lamellipodial-like ruffling activity. This asymmetry, however, is transient and persists only for the period of several hours during which actin filaments and adhesion structures reorganize into symmetric peripheral arrangement. Cells on asymmetric tear-drop shape islands also display polarized f-actin and FAs, but polarization axes are oriented towards the wide end of the islands. Polarization of actin filaments on tear-drop islands is short-term, while focal adhesions remain asymmetrically distributed for long times. From a practical perspective, circular cells constitute a convenient experimental system, in which phenomena related to cell polarization are “decoupled” from the effects of cells’ local curvature (constant along circular cell’s perimeter), while asymmetric (tear-drop) micropatterned cells standardize the organization of motility machinery of polarized/ moving cells. Both systems may prove useful for the design of diagnostic tools with which to probe and quantify ex vivo the motility/invasiveness status of cells from cancer patients.
Introduction
This paper describes the use of cell micropatterning to investigate reorganization and asymmetric distribution of cortical actin cytoskeleton and substrate/focal adhesions in circularly symmetric as well as asymmetrical cells. Numerous previous studies have shown that directional movement is initiated when a cell – either spontaneously or in response to an external cue – breaks its spatial symmetry (i.e. polarizes) and gives rise to morphologically, molecularly and functionally distinct “front” and “rear” regions 1–4. The maintenance of this front-rear polarization is required for a sustained or directional motility and is accomplished by various cytoskeletal components – e.g., actin filaments and microtubules (MTs) – performing various “dynamic” functions coordinated in space and time. Actin filaments push the “front” membrane to form a flat protrusion called lamellipodium 5–7 which adheres to the extracellular matrix (ECM) ligands, such as epitopes of fibronectin protein, via membrane integrin receptors forming discrete substrate adhesion sites (here, defined by the presence of vinculin and regardless of their size, referred to as ‘focal adhesions’ throughout this paper). 8 Concurrently, contractile acto-myosin bundles restrict the formation of protrusions and enable retraction of the cell’s “rear” 9. As a result of these events, cells moving in unconstrained fashion (e.g., on two-dimensional surfaces) display wide variation in their shapes and cytoskeleton organization making realiable quantification of cytoskeleton rearrangements and cell polarization a daunting task. In the latter context, localization of microtubule organizing center called centrosome in front of the nucleus and close to the leading edge is a commonly used indicator of cell polarization 10–12. However, translocation of centrosome is a cell-type-specific indicator and its importance in the motility process is controversial 10, 13–17. The primary response during initial steps of motility for all cell types is polarized extension of lamellipodial protrusion which may or may not be followed by centrosome translocation. Therefore, more universal measure of initial stages of cell movement could be the presence of lamellipodial actin (and/or proteins associated with lammelipodial actin filaments, such as cortactin18, Arp2/319, capping protein20, or focal adhesion protein vinculin 21) at the “front” of the moving cell. In spatially unconstrained/unpatterned cells, the perimeter regions with lammelipodia present or absent are identified by imaging cells stained with fluorescent phalloidin (to visualize actin filaments) followed by manual marking of the lamellipodia regions and computing the total length of lammelipodia vs. total cell perimeter 22, 23. This is a very time consuming and error-prone process. One of the aims of the present work is to facilitate the quantification of cell polarization status by analyzing the anisotropy of f-actin and substrate/ focal adhesions distributions in populations of micropatterned cells of precisely defined shapes.
Cell movements – both in tissues and in experimental systems – are guided by physical/ geometrical constraints of their local microenvironment 24–32. The conventional view of the relationship between microenvironmental cues, the cytoskeleton and directional motility is a linear one: namely, that external signals induce changes in cytoskeleton organization which in turn leads to cell polarization and directional motility 33–35. This viewpoint overlooks the fact that the shape of the cell feeds back into the organization of the cytoskeleton, cellular function and its responsiveness to signals. Soft-lithographic techniques enabling fabrication of substrates with cell-adhesive patterns commensurate with the dimensions of single cells [e.g., microcontact printing 36, 37, Wet Stamping, and Anisotropic Solid Microetching (ASoMic) 38–40], have enabled better understanding of how cell shape affects cytoskeleton organization/ dynamics and cell behavior (for review of applications, see 37, 39). In particular, patterns consisting of discontinuous cell-adhesive islands allow to control cell shape/geometry and to study the interplay between cell shape and cytoskeletal organization and/or function systematically and in quantitative detail. A number of studies have shown that changes in cell geometry/shape can alter spatial 41–48 and temporal 16, 32, 40, 43 organization of the cytoskeletal components involved in cell motility. For example, cells immobilized on circular microislands extend actin-rich lamellipodial protrusions and form substrate /focal adhesions symmetrically, around the entire perimeter of the cell 42, 43. In contrast, experiments with asymmetric microislands which mimic the typical shapes of unconstrained polarized and motile cells (e.g., tear-drop shape islands or patterns that allow cells to spread across adhesive and non-adhesive domains into tear-drop shapes) demonstrate that cells on such islands become “polarized” and extend the lamellipodium toward the island’s wider end 45, 49. Taken together, the studies with both unpatterned cells and cells on micropatterned islands indicate a strong correlation between asymmetric cell shapes and molecular/functional cell polarization.
By analyzing the temporal re-organization of actin filaments and focal adhesions and by quantifying their asymmetry/polarization in cells constrained on microislands of symmetric and asymmetric shapes, we have found that this conventional view is incomplete. Specifically, using population averaging and live cell imaging, we studied temporal re-organization of actin filaments and focal adhesions in cells on radially symmetric (circular) and asymmetric (tear-drop) microislands. We show that molecularly and functionally polarized cell state -- evidenced by asymmetric accumulation of actin filaments/focal adhesions and polarized lamellipodia-like ruffling activity-- can be captured in both types of cell shapes. The conclusion from these experiments is that shape asymmetry is not a prerequisite for molecular/functional asymmetry and polarization. At the same time, these polarization effects are only short-term and shape asymmetry alone cannot maintain complete polarization, (even though some components, such as FAs, remain asymmetrically distributed for long times). We believe this work has several practical implications: (i) for experimental scientists, circular cells constitute a unique and convenient experimental system, in which phenomena related to cell polarization are “decoupled” from the effects of cells’ local curvature (which is constant along circular cell’s perimeter); (ii) in cancer diagnostics, if validated, ‘designer’ cells of controlled shapes and polarization status may be developed into a diagnostic tool with which to probe and quantify motile/ invasive capabilities of cancer cells.
Results
On short time scales, micropatterned circular cells islands display asymmetric/ ‘polarized’ distribution of focal adhesions and actin filaments
We used reaction-diffusion microetching (ASoMic, for Anisotropic Solid Microetching) to generate arrays of symmetric and asymmetric cell-adhesive islands 50. This technique is particularly convenient because it yields adhesive microislands that are transparent and therefore compatible with various high-resolution, in-cell imaging modalities (e.g., fluorescence, TIRF, or confocal microsocopies) 39, 40. Figure 1A illustrates the patterning process in which a micropatterned hydrogel stamp (here, with circular features) is soaked in a solution of gold etchant and is applied onto a uniform, thin (~20 nm) layer of gold supported on glass (with a 5 nm Ti adhesion layer). Upon application, the stamp delivers (orange arrows, arrows shown only for the first row of circles) fresh etchant to the stamp-surface interface while removing the etching products into its bulk (violet arrows). As a result of this two-way reaction-diffusion process, the stamp “sinks” into gold (Au) layer to yield transparent microislands surrounded by opaque, unetched gold. Importantly, because the gold surface does not have to be protected during etching, its unetched portion can be subsequently functionalized with a self-assembled monolayer (SAM) of oligo(ethylene glycol) alkane thiols (here, HS-(CH2)11-(OCH2CH2)-OH, ProChimia Poland) known to resist cell and protein adhesion 51. After SAM formation is complete (~12 hrs), the islands are coated with an extracellular matrix protein fibronectin. Cells (here, B16F1 mouse melanoma, incubated with thymidine to inhibit cell division) are plated onto the substrate where they spread on the adhesive islands and assume their shapes (Fig. 1B). This procedure yields populations of “designer” cells termed so because of their well-defined shapes, minimal cell-to-cell heterogeneity (see Fig. 1C vs. Fig. 1D) and predictable/’designed’ organization of the cytoskeleton and cellular function.
Figure 1. Control of cell geometry on transparent microislands.

(A) Scheme of the reaction-diffusion microetching (see text for description). (B) An array of microetched circular islands. Left, bright field image (white = etched islands; dark = unetched gold); right, phase-contrast image showing that cells assume the shapes of the etched islands. (C) B16F1 mouse melanoma cells on unpatterned substrate display heterogeneous cell shapes and cytoskeletal organization (cells stained with fluorescent phalloidin to visualize actin filaments, image contrast-inverted). (D) B16F1 cells on micropatterned circular islands have identical shapes and display approximately uniform organization of actin cytoskeleton; 18 different cells are shown. Scale bars are, 80 μm for B and 40 μm for C, D.
Since reorganization of cytoskeletal components (here, focal adhesions, FA, and actin filaments, f-actin) in cells on micropatterned islands occurs over relatively long time-scales (hours), we first studied this process in time increments Δt = 30 min, and for times, t, from 30 min up to 12 hours. In doing so, we made use of the fact that identical shapes of the “designer” cells allow for overlaying and averaging f-actin/FA distributions from individual cells. Comparison of the “heat maps” thus obtained (Fig. 2A–8h) with the corresponding images of individual cells (Fig. 1D), demonstrates that this method “smoothes-out” the differences between individual cells and yields an “average” representation of the cytoskeletal structure.
Figure 2. Temporal reorganization of actin filaments and focal adhesions in cells cultured on circular micropatterned islands.

Single representative (black-and-white images, top row) and average (heat maps, bottom row, 25 cells; scale from 0 to 250, arbitrary intensity units) images of (A) actin filament (from fluorescent phalloidin staining) and (B) focal adhesion (vinculin, FA) distributions in B16F1 cells cultured on fibronectin-coated, circular microislands (diameter, 40 μm). Scale bar = 20 μm. (C) Scheme of circular cell. Polarization index (P) for f-actin is computed as distance (d) between the cell’s geometric center (GC) and center of mass (CoM) divided by cell’s radius. Front is defined as f-actin/FA rich region; back is the other end. (D) Quantification of the peripheral intensity levels (within 5-μm-thick peripheral region delineated in the 2h average image in A by the white annular rings). Red = actin; green = FA (vinculin). (E,F) Quantification of polarized actin and focal adhesion distributions (using images from A and B) by means of the polarization index P and Front/Back ratio F/B, respectively (cf. Experimental Procedures for details). Top and bottom of the box show 75th and 25th quartiles, respectively; whiskers indicate minimum and maximum values excluding outliers; circles show outliers, middle line is the median and cross is the mean. An asterisk (*) indicates statistically significant difference when compared to 2h-timepoint; ‘Pound’ symbol (#) indicates significant difference when compared with 3h-timepoint; ‘And’ symbol (&) indicated significant difference when compared with 4h-timepoint (p<0.05). Actin bundles and FAs in circular cells progressively and concurrently undergo reorganization from polarized distribution resembling moving cells to uniform peripheral organization of actin edge-bundles and focal adhesions.
In our experiments, we monitored this structure as a function of time by fixing the patterned cells at different times followed by immunofluorescence visualization (using confocal microscopy) of f-actin and FAs. For each condition considered, 25–50 cells were overlayed and the averages were taken pixel-by-pixel. The numbers of analyzed cells were chosen based on our recent findings (to be published separately) that the “noise” (i.e., standard deviation) in the cytoskeletal distributions in circular cells scales with the number of analyzed cells, N, as . Consequently, population averages derived from 25–50 cells approximate the “true” averages of infinite cell populations to within 15–20%.
Following the outlined methodology, we studied the evolution of f-actin/FA distributions in cells spread on circular islands of areas A = 1,256 μm2 equal to an average area of unpatterned B16F1 cells spread on fibronectin. The earliest time when most cells fully occupied the islands was t = 2 hrs (hence initial images shown in the Figures are those for 2 hrs) and by t = 8 hrs the cytoskeleton had reached a steady state that remained approximately unchanged up to t = 12 hrs. Because most of the f-actin/ focal adhesion interactions occur close to the cell-substrate interface, we used confocal microscopy to image cell regions within 360 nm from this interface. Based on the recent theoretical study by Novak et. al 52, we expected that f-actin and focal adhesions initially would be located exclusively around the cell’s center or uniformly distributed over the entire surface of the island and should gradually translocate toward and accumulate around cell’s perimeter. Instead, both the f-actin and FAs exhibited asymmetric/”polarized” initial distributions (Fig. 2A,B,D, 2 hrs) which “fanned out” into a centrosymmetric arrangement only at later times (Fig. 2A,B,D, 8 hrs).
Since individual cells were “polarized” in random directions, we constructed the cell overlays/”heat maps” by rotating cell images such that the highest levels of intensity were oriented in the same direction (cf. Experimental Procedures). We then used these averages to quantify the extent of asymmetry of f-actin by a polarization index, P, calculated by (i) locating the “center-of-mass”, COM, of each average image (where “mass” corresponds to fluorescence intensity at each pixel, see Fig. 2C and Experimental Procedures), (ii) determining the distance between the COM and the geometric center of the cell/island, and (iii) dividing the result by the island’s radius (here, 20 μm). In this way, the polarization index was P = 0 for circularly symmetric distributions and increased with increasing degree of asymmetry (0 < P < 1).
To quantify the asymmetry in the distribution of FAs located predominantly along cell perimeter, the cell was divided into “front” and “back” semicircles, and the front-to-back ratio, F/B, was calculated by dividing amount of peripheral FAs (proportional to integrated fluorescence intensity) in the cell’s front by the amount in the “back”. Using this measure, any ratio larger than 1 indicates asymmetric distribution of FAs (see Experimental Procedures for more details). 53 The plots in Fig. 2D,E show that the values of P and F/B decrease with time monotonically thus confirming gradual symmetrization of f-actin and FA distributions in circular cells.
Actin bundle cross-linker motor protein myosin IIA showed localization similar to that of f-actin (e.g., characteristic periodic/ punctuate labeling of bundles at actin-rich ‘front’ and at the perimeter bundle was observed; data not shown).
The combination of ASoMic’s optically transparent micropatterned islands and confocal imaging allowed resolving even small adhesion structures over entire dorsal surface very clearly. Interestingly, these adhesions appeared qualitatively different over different regions of the circular cells. (Fig 2B, t = 2 hrs). The actin-rich zone was flanked by large focal adhesions with almost no adhesions present between these large formations. In contrast, the actin-depleted cell region was adherent only by means of small uniformly distributed adhesions (22 out of 25 cells examined for t = 2 hrs displayed this particular adhesion pattern very clearly). At later times (Fig 2B, t = 8 hrs), the pattern evolved such that large adhesions were localized along the entire actin-rich cell perimeter whereas small adhesions were distributed uniformly over the actin-depleted cell interior.
Reorganization towards symmetric arrangement in circular cells was accompanied by increasing co-localization of f-actin and FAs (Fig. 3A,B). The degree of this co-localization can be quantified by a two-dimensional correlation coefficient (see Experimental Procedures), ranging from 0 (no spatial overlap) to values close to 1 (full overlap). Figure 3B shows that in polarized cells (at 2 hrs) the distributions of actin and focal adhesions are poorly correlated but the correlation increases as the cells “depolarize” (8–12h). The data for this 2D correlation coefficient fits an exponential dependence of the form y(t)= a(1– e x p– ( / tτ) ), with a characteristic time, τ ~ 100 minutes. Also, as the adhesions become smaller, their density and/or number increases as evidenced by significant increase in the total integrated intensity of focal adhesion marker vinculin (Fig. 3C, bottom). At the same time, the amount of actin polymer near the cell/substrate interface (Fig. 3C, top, solid red markers) remains roughly constant, although the total amount of actin in the cell increases approximately two-fold (Fig. 3C, top, open red markers).
Figure 3. Co-localization of actin filaments and focal adhesions in circular cells.
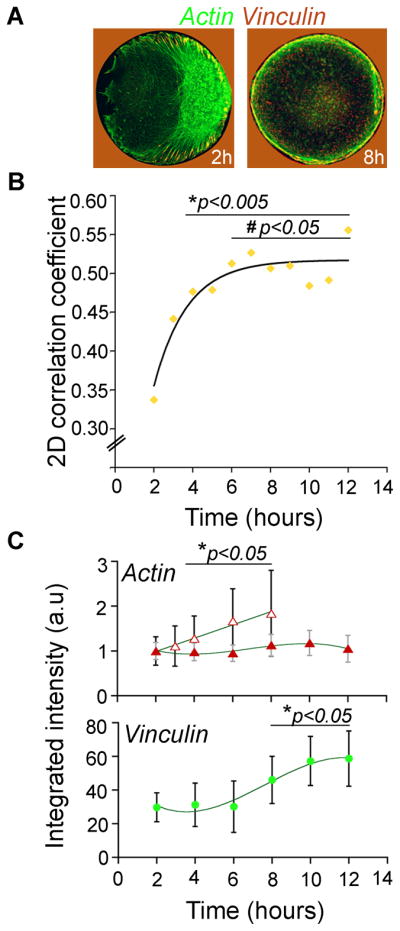
(A) Overlays of actin (green) and vinculin (red) 2 and 8-hr images showing extent of colocalization of the two structures (note that red background surrounding the islands/cells is due to the signal from gold, not from vinculin); island diameter, 40 μm. (B) Quantification of the colocalization of actin filaments and focal adhesions from 25 individual images (representative images also shown in Fig. 2A,B). Standard deviations are ~13–21% of the average values for 3–12 hrs, and ~30% for the 2-hr point. Statistical comparisons were carried out by using Analyse-It software package (ANOVA, Bonferoni post-hoc test); all subsequent points were compared to 2h-point (*p<0.005 for 4–12 hrs); or to 3-h-point (# p<0.05 for 6–12 hrs). (C) Quantification of integrated intensity levels of actin and vinculin images. Intensity levels reflect the total amount/area of focal adhesions. Data are represented as mean +/− standard deviation; *denotes p <0.05, all subsequent points were compared to the initial 2h-point.
We further studied how the transiently polarized circular cells arose by observing early stages ( 0–2 h, Fig. 4) of cell spreading (by fixing cells at different time points, as well as by live cell phase-contrast imaging) on the micropatterned islands. Initially (0–15 min), micropatterned cells, similarly to unconstrained cells, spread in a symmetric manner. Since the vast majority of the cells do not attach perfectly at the islands’ centers, one “side” of a cell reaches the edge of the island first and its expansion is then limited. Cell shape deforms generating two high curvature points that flank remaining protruding/spreading perimeter (lamellipodium). This remaining lamellipodium then collapses into an edge bundle resulting in crescent shape cells with high curvatures at far points. The two high curvature points sprout new protrusions which then extend along the rim of the island. Next, one of the two protrusions becomes dominant and drives further spreading (1–2 h). The dominant protrusion resembles the final active edge (2h, front) in that it displays frequent protrusion/retraction cycles and frequent centripetally flowing ruffles. Finally, the two protrusions at high curvature points meet to complete the spreading and occupation of the entire island. We conclude that polarized, circularly symmetric cell configuration seen at 2h is a result of early cell polarization (of non-circular cells) and subsequent asymmetric spreading.
Figure 4. Cell spreading on circular micropatterns at early times ( t = 0–2h).
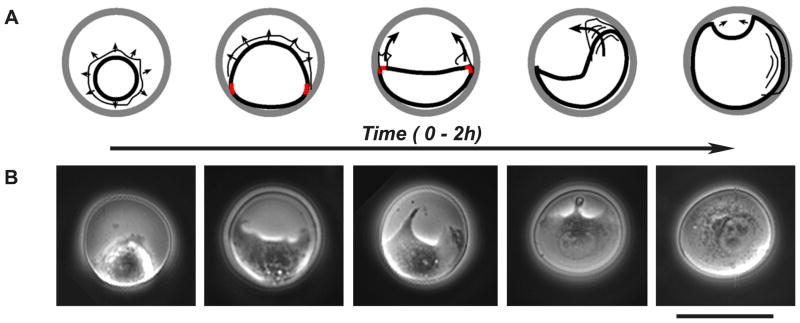
(A) Schemes depicting cell spreading on circular microislands (see text for detailed discussion). Thicker lines mark cell body; thinner lines outline protrusive lamellipodia; arrows indicate spreading/lamellipodia protrusion directions; wavy lines indicate ruffles; red marks indicate high-curvature points. (B) Microscopy images (phase-contrast) depicting the stages of cell spreading outlined in the schemes in A. Dark = unetched gold; grey = etched islands with cells. Scale bar is 40 μm.
Short term asymmetry of f-actin and long-term asymmetry of focal adhesions in asymmetric cells
Our findings with circular cells contrast with previous reports that emphasized the importance of asymmetric micropatterns in inducing cell polarization and directional cell motility. 49 This discrepancy prompted us to investigate reorganization of f-actin and FA structures in B16 cells on tear-drop islands (Fig. 5). Similar to circular cells, the initial (here, at t = 4h, the earliest time when majority of cells fully occupied tear-drop shape islands) distributions of f-actin and FAs in tear-drop cells were highly asymmetric. In contrast to circular cells, however, where asymmetric accumulation of f-actin/FAs was oriented to random directions, the convex wide end of the teardrops dictated the orientation of the polarization axis. Specifically, f-actin and FA marker vinculin concentrated at the convex, wider end of the island and at the high curvature ‘corners’ flanking the wide end (Fig. 5A,B). Vinculin was also present at the sharp “tip” at the opposite end of the cell, but was excluded from the concave side edges (Fig. 5B). With time, distribution of f-actin equalized along the island’s perimeter, and actin bundles along the side edges were reinforced leading to an almost uniform peripheral f-actin distribution (t = 6h). Furthermore, slight “backwards” polarization (e.g., toward pointed end) was observed at longer times (t = 8–24h) (Fig. 5A,D). These observations are quantified by the polarization index, Px for f-actin (Fig. 5C and Experimental Procedures) decreasing monotonically with time and becoming negative at t = 8–24 h (Fig. 5D). In contrast to the symmetrization of f-actin, the distribution of FAs quantified as Front/Back peripheral FA ratio, F/B, remained asymmetric up to t = 24h. These trends are shown in Fig. 5E which plot Px for f-actin and F/B for FAs as a function of time. In summary, asymmetric shape orients cell’s intrinsic “polarization”/asymmetry axis in short term. In the long run, however, f-actin and FAs reorganize independently from one another with only the latter remaining asymmetrically for longer times.
Figure 5. Temporal reorganization of actin filaments and focal adhesions in tear-drop cells.

Representative single (black-and-white images, top row) and average (heat maps, bottom row, 25 cells; scale from 0 to 250, arbitrary intensity units) images of (A) actin filament (from fluorescent phalloidin staining) and (B) focal adhesion (vinculin, FA) distributions in cells cultured on fibronectin-coated, tear-drop microislands (area, 1256 μm2). White lines in individual cell images in B show tear-drop shape of the adhesive islands. Scale bar = 20 μm. (C) Scheme of the tear-drop shape with the arrow indicating the x-direction along which polarization occurs and polarization index, Px is calculated. The regions indicated correspond to those in intensity scans in D: Red, back edges (b.e.) and the front; green, side corners (s.c.) and pointed end (also high curvature points that typically accumulate FAs). GC, geometric center of the cell; CoM, center of mass of f-actin or FAs; dx, distance between GM and CoM. Note that dx can have positive (4h, most f-actin towards wide end) or negative (24h, most f-actin towards pointed end) values (D) Quantification of the intensity within 5-μm-thick outer rims of average images shown in A and B. Angular distributions of actin (red) and FAs (green, vinculin). (E) Quantification of f-actin (using images from A, n = 25–50 cells) by means of the polarization index, Px where Px is computed as dx divided by radius, R, of circular cell of corresponding area (here, R=20 μm). (F) Quantification of FA distributions (using images from B) by means of Front/Back ratio of peripheral FAs. Top and bottom of the boxes show 75th and 25th quartiles, respectively; whiskers indicate minimum and maximum values; middle line is the median and cross is the mean. An asterisk (*) indicates statistically significant difference when compared to 0 for Px (p<0.05) or 1 for Front/Back ratio (p<0.001) (or symmetric distribution). Pound symbol (#) indicates significant (p<0.05) difference when compared with initial time-point (4h). Actin distribution is polarized and oriented towards wide end in short-term followed by actin rearrangement and “depolarization” (or slight polarization towards pointed end), while FA distributions remain asymmetric for long times.
“Polarized” cells on micropatterned islands display asymmetric membrane ruffling activity
The early “polarized” state of the cells on circular islands – in particular, a “crescent” of actin structures (filaments, bundles, and spots) flanked by formations of strong adhesions– resembles cytoskeletal organization in polarized, unconstrained B16 cells moving on un-patterned substrates. For this reason, throughout the paper we have termed the actin-rich region as a cell “front” and the opposite end, as “rear”. The similarity with migrating cells was further corroborated by high-resolution phase-contrast imaging of live cells and digital fluorescence imaging of GFP-actin expressing cells (see Supplementary Movies 1–3 Online). During ‘polarized’ stage (2–4h), circular cells were highly dynamic (Fig. 6) and displayed pronounced polarized membrane ruffling activity (ruffle frequency at the “front” was 1.12 ± 0.25 ruffles/min; n=11 cells; 263 min of observation) (Fig. 6A,B,C and Supplementary Movie 2 Online). Ruffles were identified by their dark appearance in phase contrast and by their centripetal movement towards cell’s center; in time-space plots known as kymographs, ruffles appear as slanted dark lines near cell periphery 54. This actively ruffling “front” region was coincident with GFP-actin-rich region of the perimeter (Fig. 6D “front,” and Supplementary Movie 1 Online). GFP-actin distribution was similar to that obtained from immunostaining experiments shown in Fig. 2. Polarized actin-rich region consisted of dynamic actin spots that were confined to a specific peripheral region by transverse actin bundles. In contrast, actin-depleted side of the perimeter displayed almost no ruffling activity (ruffle frequency was 0.11 ± 0.11 ruffles/min, Fig. 6A,B,C “rear”). At the wide end of the asymmetric cells (‘front’ for tear-drop), ruffles appeared with similar frequency (1.1 ± 0.14 ruffles/ min; n = 7 cells; 154 min) to that for circular cell ‘front’. Ruffling was less frequent at the pointed end of tear-drops (0.56 ± 0.44 ruffles/ min) and completely absent at the side edges (0.01 ± 0.04 ruffles/ min). Kymograph analysis also revealed that at the front of cells of both shapes, bursts of multiple closely spaced ruffles appeared (period ~ 4–5 minutes) followed by quiet periods. Retraction velocities for front ruffles were 2.4 ± 1.1 μm/min and 2.9 ± 1.5 μm/min for circular and tear-drop cells (n ~ 150 waves for each shape), respectively. These values are of the same order of magnitude as those reported in previous works with unconstrained cells 54–57. With time, ruffling activity gradually invades entire perimeter of circular cells, large centripetally flowing ruffles cease, but some small transverse ruffling always remains. For tear-drops, ruffles become smaller, but are still restricted to front/”wide” and back/”pointed” ends with no ruffles at the side edges. The fact that initial polarized ruffling activity is coincident with high concentration of actin filaments most likely signifies that the cell is attempting to move in a given direction, albeit non-productively because of the adhesion-resistant surroundings. In other words, cells on both types of islands initially behave as if “running on a treadmill”.
Figure 6. Time-lapse of membrane ruffling dynamics in live B16 cells on circular and teardrop shape islands.

(A) At 2h, circular (left) and tear-drop (right) shape cells display polarized/asymmetric ruffling activity--ruffling occurs predominantly at one end of the cell (here, termed “front”); ruffling activity is absent at the other end of the cell (“rear” for circles or “sides” for tear-drops, see also kymograph analysis in B). For circular cell, inset is an enlarged “front” region (indicated by white box) showing ruffles (black arrowheads); ruffles appear as dark wavy lines (low grey values). For tear-drop, expanded inset shows time-series of phase-contrast images (white arrowheads indicate appearance of two ruffles). See also Supplementary Movies 2–3 Online. Scale bar = 20 μm. (B, C) Ruffling activity quantified using kymograph analysis (see Materials and Methods). Kymographs (B) or time-space plots of intensity values in linear regions (shown as white lines in A) across the planes of the time-lapse stack. Images show typical kymograph plots for “front” and “rear” regions for circular cells (“sides” of tear-drops look similar to “rear” of circles). Ruffles are identified by dark appearance in phase-contrast (low grey values) and by their centripetal movement from the cell’s edge toward cell interior (indicated by slanted orientation of dark lines in the kymographs). Note numerous ruffles in “front” kymograph (black arrows point at individual ruffles) and their absence in “rear” kymograph. (C) Ruffles were enumerated from kymograph images of cells imaged 2–4 hrs after plating. “Front” regions display statistically significantly increased frequency of ruffles. Top and bottom of the box show 75th and 25th quartiles, respectively; whiskers indicate minimum and maximum values; circles show outliers, middle line is the median and cross is the mean. (n=11 cells; 263 minutes total observation for circles and n=7 cells, 154 min for tear-drops; *p <0.0001; Student’s t-test.) (D) The areas of polarized ruffling activity are coincident with polarized asymmetric accumulation of GFP-actin in transverse bundles and spots (2h). At 8h GFP-actin is symmetrically distributed. See also Supplementary Movie 1 Online. Scale bar = 20 μm.
Discussion
Cell polarization – that is, a spontaneous or externally induced symmetry breaking event 1–3 accompanied by molecular and functional differentiation between cell’s leading and rear edges – is crucial for directional cell motility 6, 58. Our results show that the molecular asymmetry (here, of f-actin and focal adhesion (FA) distributions) can be captured in cells on both symmetric and asymmetric micropatterned islands. On both types of islands, cells display anisotropic f-actin distributions (or “polarize”) in short term: on circular islands cells polarize in random directions, while on asymmetric islands cells preferably orient their axes of polarization toward the wide end. Asymmetric cell shape maintains only selected (e.g., FAs and not f-actin) cellular components polarized/ asymmetric in long term.
Our key observation – namely, that centrosymmetric peripheral distribution of actin filaments and focal adhesions is preceded by an asymmetric, “polarized” state of circular cells – cannot be fully explained by an existing model of cytoskeletal organization and evolution in micropatterned cells 52, but they are in line with a number of observations in unpatterned cells 59–61. The final, predominantly peripheral localization of large focal adhesions has been observed previously in cells constrained to regular shapes 42, 43, and has been modeled in a theoretical study by Novak et. al 52. In their paper, Novak and colleagues suggested a plausible explanation as to why the adhesions are localized at the periphery (or at the high-curvature points therein, such as the vertices of polygonal microislands). According to their explanation, the interior adhesions do not grow in size because associated actin filaments “pull” in different directions resulting in low net tensile force. Peripheral adhesions, in contrast, experience larger net forces as they are being pulled by actin filaments oriented towards the interior or along the cell perimeter. Since larger adhesions are needed to stabilize the actin network against these forces, adhesions tend to assemble more rapidly in the cell periphery rather than in the interior 52. While this model reproduces the steady-state distribution of actin filaments and focal adhesions, it does not incorporate experimental data on temporal reorganization and does not consider the time evolution of these cytoskeletal components. Instead, the model chooses an arbitrary initial condition with no actin filaments and high concentration of focal adhesions located near the geometric center of the cells. The model also proposes that focal adhesions translocate from the cell’s center to the periphery by treadmilling type of movement, a process which is expected to take several hours. 52 Our experimental observations agree with these predictions only in part. On one hand, we do observe similar steady-state distributions of actin/FAs, and the accumulation of focal adhesions in regions of high curvature (e.g., at the pointed end) and the “corners” of teardrop islands). On the other, the initial distributions on circular islands are asymmetric with concentration of f-actin/FAs at random angular locations along the microislands’ perimeters. The fact that such distributions appear at early time-points (i.e., at times much shorter than expected for Novak’s postulated treadmilling) indicates that symmetry breaking occurs during and is coupled to cell spreading, which is not considered in Novak’s analysis. Nevertheless, since Novak’s model is independent of initial conditions, it is still valuable in explaining why the initially asymmetric distribution ultimately evolves into a uniform, peripheral one. Initial appearance of adhesions in the periphery of circular cells (at 2h), however, is in agreement with a number of previous studies with unconstrained cells where nascent adhesions are formed underneath actin polymerization-driven lamellipodial protrusions at the cell rim. As polymerizing f-actin network moves or flows away from cell rim (in a process called retrograde actin flow), it slides over nascent adhesions and triggers their maturation into larger focal adhesions.59–61 It is plausible that what we see at 2h are these larger focal adhesions that eventually disperse centro-symmetrically.
The asymmetric actin/adhesion distribution in circular cells (t = 2h) is a result of early polarization 1, 3 (at t ~ 15–30 min) of non-circular cell and subsequent asymmetric spreading guided by the rim of the island (see Fig. 4). Cells that are initially asymmetrically positioned with respect to islands’ centers (here, t < 2 hrs) first contact one side of circular island’s perimeter. Since the other side continues to extend, this process results in deformed cell shape with two “flanking” points having slightly higher curvatures than rest of the perimeter. Further cell shape changes and extension of lamellipodial protrusions from these two points may be explained by the strong feedback mechanism that exists between the curvature of the membrane and actin polymerization 62, 63. In such a case, it is reasonable to expect that curvature-sensitive proteins (see review64) would accumulate at high-curvature regions generated by cell deformation. These proteins would also localize actin polymerization to these regions which, in turn, would further deform the membrane eventually leading to spreading/protrusion of the cell in the direction of the high curvature points. It is not clear, however, why one of the two protrusions eventually dominates.
Once the cell spreads and occupies the entire circular island and provided that there are no further asymmetry cues (e.g., geometric, like in the tear-drop-shapes; asymmetric ECM or chemoattractant) the asymmetric distribution of f-actin/ focal adhesions starts to decay.
While the actin/adhesion patterns in our immobilized cells are structurally and functionally similar to the moving cells, it must be pointed out that unconstrained, polarized mammalian cells typically display asymmetric shapes (e.g., fibroblasts have pronounced elongated tear-drop shapes while fish keratocytes, keratinocytes and B16F1 melanoma cells have fan-shapes with broad fronts). On the other hand, dynamic ruffling activity and ruffle centripetal flow (also called transversal membrane waves by others) 54–57 at the actin-rich region of the circular cells is indicative of dynamic protrusion (here, non-productive because of the cell confinement to the islands) characteristic of the polarized, directionally motile cells. This activity gives substance to the “cells-on-treadmills” terminology we have coined previously 39. The fact that circular cells display molecular polarization with structurally and functionally distinct cell “front” and “rear” may prove useful in quantitative examination of other front/rear molecular dynamics differences 65, 66, such as microtubule growth toward focal adhesions 40, 67. In this context, the unique advantage of circular cells is that the processes under study may be effectively “decoupled” from the effects of varying cell shape/curvature in asymmetric cells.
Conclusions
To summarize, the major conclusions of this work are two-fold: (i) asymmetric distributions of cytoskeleton/molecular components can be observed in cells with both symmetric and asymmetric shapes, and (ii) at the same time, the microislands by themselves – either asymmetric or symmetric – can maintain cell polarization only for relatively short times. The ability to take averages over populations of designer cells of identical shapes allows for quantitative analysis of the slow (hours) dynamic/reorganization cellular processes, and for the identification of various degrees of cell polarization/ molecular asymmetry (reflected by continuously varying polarization index, see Fig. 2E,F and 5E). In our system, these processes can be effectively decoupled from the effects of local curvature, which is constant for circular islands. In the future, it would be interesting to test whether the duration of the polarized state of cells on micropatterned islands correlates with the motility (and invasiveness) status of the immobilized cancer cells. If so, the arrays of symmetric and/or asymmetric microislands may prove useful in cancer diagnostics and screening of anti-cancer drug candidates targeting motile, metastatic cells.
Experimental Procedures
Reagents
For photolithography and preparation of the micropatterned gel stamps, we used the following reagents: NANO SU-8 2010 photoresist (Microchem, Newton, MA), poly (dimethyl siloxane) (PDMS) prepolymer (Sylgard 184 Silicone Elastomer; Dow Chemical Co; Midland, MI), high gel strength agarose (OmniPur, Darmstadt, Germany), KI/I2 based TFA type gold etchant (Transene Co., Inc., Danvers, MA); poly ethylene glycol (EG) terminated alkyl thiols HS(CH2)11(OCH2CH2)6 (ProChimia Surfaces, Gdansk, Poland). Fibronectin for cell adhesion and thymidine for cell synchronization was purchased from Sigma-Aldrich. For immunofluorescence staining for focal adhesions and actin detection, we used mouse monoclonal antibody to vinculin (clone hVIN-1 from AbcamInc., Cambridge, MA) and phalloidin-Alexa488 (Molecular probes/ Invitrogen), respectively. Secondary antibody conjugated to Rhodamine was from Jackson ImmunoResearch Laboratories, Inc. (West Grove, PA). Fetal bovine serum was from Atlanta Biologicals (Atlanta, GA). B16F1 mouse melanoma cell line and EGFP-β-actin expressing B16F1 cells 68 were a gift from Dr. C. Ballesterm (Weizmann Institute of Science, Rehovot, Israel).
Cell Geometry Control with Reaction-Diffusion Microetching
Real-size patterns were designed by using layout software CleWin (WieWeb software, Eschede, The Netherlands). Features were printed on transparency sheets by a commercial vendor (CAD/ Art Services, Inc., Bandon, OR) or replicated onto quartz masks (Bandwidth Foundry Pty Ltd, Australian Technology Park, Australia). The areas of the circular islands were 1256 μm2 corresponding to the average sizes of freely spreading B16 mouse melanoma cells. Tear-drop islands had the same area and length/width aspect ratio of 1.2. PDMS templates for the agarose stamps were fabricated by using standard photolithography/molding methods 37 as described previously 40, 69. Briefly, agarose stamps were prepared by casting hot, degassed 8 % w/v solution of high gel strength agarose (OmniPur, Darmstadt, Germany) in deionized water against oxidized poly (dimethyl siloxane) (PDMS) templates. Agarose stamps were soaked for ~ 15 minutes in a 20% solution of a gold etchant containing potassium iodide and iodine (KI/I2) complex (Gold Etchant TFA, Transene Co. Inc., Danvers, MA) in deionized water. In order to etch the patterns, stamps were placed for two minutes feature-side-down onto standard glass coverslips (# 1.5, 22 mm × 22 mm) covered with e-beam evaporated 20 nm-thick gold films supported by a 5 nm adhesion layer of titanium. Etched substrates were then incubated in 5 mM solution of hexa (ethylene glycol)-terminated alkyl thiol HS(CH2)11(OCH2CH2)6 (ProChimia, Gdansk, Poland) in ethanol for 2 hrs followed by thorough washing with ethanol and drying under a stream of nitrogen. Etched and protected substrates were coated with fibronectin (25μg/ml) for 1 hr at room temperature.
Cell Culture and Immunofluorescence Staining
B16F1 cell were routinely cultured in DMEM culture medium supplemented with 10% fetal bovine serum. In order to avoid overcrowding of the islands, division of B16F1 cells was inhibited and cell cycles synchronized by double thymidine block by culturing them in the presence of thymidine (2mM) for 18 hrs followed by 8 hrs in the absence of thymidine. Thymidine supplementation inhibited cell division and ensured one cell per island occupancy for most of the islands – at the same time, it did not affect morphology of either un-patterned or micropatterned cells. B16F1 cells were plated at a density of 10,000–20,000 cells/cm2 and cultured on the microetched substrates in full culture media supplemented with thymidine (2 mM) for time intervals ranging from 0.5–12 hrs at 30-minute increments. At indicated time points, cells were simultaneously fixed and permeabilized with 4% paraformaldehyde, 0.5% Triton-X-100 in PBS for 30 minutes at room temperature. Coverslips from earlier time points were transferred to PBS before immunostaining. Fixed coverslips were blocked with 1% BSA in PBS, focal adhesions were visualized by using primary antibody to vinculin (Abcam, Cambridge, MA; [hVIN-1] clone, cat# ab11194) and rhodamine-conjugated anti-mouse secondary antibody (Jackson ImmunoResearch, West Grove, PA; cat# 715-025-151); and actin filaments by staining with phalloidin-Alexa-488. Myosin IIA distribution was determined by immunostaining with primary antibody specific for myosin IIA isoform (Covance, Emeryville, CA; cat#PRB-440P) and appropriate secondary antibody.
Confocal Microscopy
For the analysis of actin/focal adhesions on the cell’s ventral surface, confocal images were obtained on Zeiss LSM 510 confocal microscope operated by Zeiss-imaging software using 60X magnification objective and with an additional 2.5X zoom. Single z-plane images (~0.36 micron thick) of the plane closest to the substratum at the level of well-defined focal adhesions were obtained for actin by exciting the sample with 488 nm laser line and for vinculin by exciting with 543 nm laser line. The signal generated by gold surrounding the islands (with 543 nm excitation) made the islands visible without the need for additional visualization/image processing. This gold signal was minimal for 488 nm excitation and did not affect imaging of focal adhesions or actin cytoskeleton in cells since the islands were not supported by gold. To ensure reliable quantification, all images were obtained with identical laser power and gain settings, at 12-bit depth, by using maximum number of scans (12) that allowed for obtaining images of optimal resolution and brightness with intensity levels below saturation levels.
Live cell imaging and kymograph analysis
Wide-field light microscopy (for live-cell phase-contrast imaging, GFP-actin dynamics imaging and also for fixed-cell imaging for determination of total polymer levels), was performed on an inverted microscope(Diaphot 300; Nikon) equipped with a Plan 63X objective and slow-scan cooled CCD camera (model CH350; Photometrics, Tucson, AZ) driven by MetaMorph® imaging software (Universal Imaging Corp., Worchester, PA). For live cell imaging, patterned glass slides were attached to 20-mm holes at the bottom of 35-mm plastic Petri dishes using vacuum grease. Culture medium was changed to Leibowitz-15 supplemented with 10% FBS. During imaging, temperature was held constant at 37°C by a combination of heating ring fitted to the plastic dishes and objective heater. The ruffling dynamics of B16 cells plated for 2–4 hours on substrates with circular or tear-drop shape islands was recorded by obtaining phase contrast images at constant time intervals ( t = 10 sec) for total time of 20–40 minutes for each cell. Kymograph analysis was carried out as previously described 54. Briefly, kymographs or time-space plots depicting intensity values in linear regions (1.5 μm-wide × 10 μm-long regions spawning 5 μm outside and 5 μm inside the circular or tear-drop islands; indicated by white lines in Fig. 6A) across the planes of the time-lapse stack were obtained using Metamorph software kymograph option. Three kymographs (regions were spaced about 1 μm apart) were generated for “front” (active/ actin-rich half) and “rear” (inactive half) of each circular cell. Similarly, two or three kymographs were generated for each “front” (or wide-end), “rear” (pointed end) or side edges of tear drop shape cells. Ruffles were identified by dark appearance in phase-contrast (low grey values) and their centripetal flow towards cell’s interior (slanted appearance of lines in kymographs) and ruffle frequency for “front” and “rear” of each cell was quantified as average of duplicate/ triplicate kymographs. Ruffle retraction velocities were quantified from kymographs as described previously. 54
Image Processing and Data Analysis
Population Averages of Micropatterned Cells
Image processing and analysis was performed according to the following automated procedure. First, the raw confocal images (file extension.lsm) were decoded and converted to format compatible with MATLAB by using bio-imaging software, BioImage Convert (Vision Research Lab; Santa Barbara, CA; http://vision.ece.ucsb.edu/download.html). All further image processing was done in MATLAB Version 7 (The MathWorks, Inc.). The individual images were trimmed down to the size of the patterned circle and the center-of-mass (COM) of the f-actin/FAs in each cell was calculated using the following equation: , where x and y are Cartesian coordinates within the cell and, I, is the intensity at each pixel (x,y). The vector connecting the geometric center of the circular island with the COM (i.e., vector of polarization direction) was then plotted, and the vectors of individual cells were then aligned to the horizontal right followed by overlaying the images and computing population averages. The averages were calculated by summing the intensities at each pixel position of aligned cells and dividing by the number of cells analyzed. For tear-drop shape cells, cells were rotated so that wide ends were directed to the right (as in the images in Fig. 5).
Intensity scans
Intensity scans were obtained from average images by summing up intensities from all pixels within 5-μm-thick peripheral rim (shown in Fig. 2) and plotting total intensities as a function of their position along the perimeter of the cell.
Polarization index and Front/ Back Ratio
To quantify the degree of f-actin asymmetry at each time point, we again used the concept of center of mass (COM) applied to average images. The coordinates of the COM for each average image were found by the same method as described above for individual cells. The polarization index, P, was calculated by dividing the distance, d, between COM and the geometric centre of the circle by the circle’s radius. In this way, for circular cells, P varied between 0 for radially symmetric distributions of actin/FAs to values approaching 1 for highly polarized distributions.
For tear-drop cells, polarization index (Px) was computed from x-axis components of polarization vectors as a distance between COM and cell’s geometric center (dx) and dividing this by the radius of a circle of the same area as tear-drop shape (here, R = 20 μm). This way, Px ranged from approximately -1.8 (for polarization toward the pointed end) to 0 (for symmetric distribution) to approximately 1 (polarization towards the wide end). Px was sufficient to describe the asymmetry of tear-drop cells because y-axis components were largely symmetric with respect to the island’s axis of symmetry.
The degree of asymmetry of focal adhesion distributions was quantified by the Front/Back ratio, F/B. The intensities of peripheral adhesions (within 5-μm-thick region along the island’s perimeter) at the cell front (perimeter region corresponding to θ = −90° to +90° in intensity scans) were summed up to give F and of the back (θ = −180° to −90° and 90° to +180°) to give B and the ratio of the two was obtained. Thus F/B = 1 indicates symmetric distribution and values different from 1 indicate asymmetric distributions.
2-D correlation coefficient
The 2-D correlation coefficient, r, was used to determine the degree of similarity between two images, A (here, actin) and B (here, focal adhesions). It ranged from −1 to 1, where r > 0 indicates positive correlation between the magnitude of the intensities of the two images; r < 0 indicates “anti-correlation”, where the low intensities of one image coincide with high intensities of the other image and vice versa. The images becoming increasingly similar to each other correspond to increasing values of r. This 2-D correlation coefficient is mathematically expressed as:
where ĪA and ĪB are average intensities of the image A (actin) and B (focal adhesions) respectively.
Statistical Analysis
Statistical analysis was performed using Analyse-It software package for Microscoft Excel using Analysis of Variance (ANOVA with Bonferoni post-hoc test) for comparisons of multiple groups against control group or Student’s t-test for comparisons of two groups. One sample t-test was used to compare the groups to a hypothetical mean of zero for f-actin or one for FAs (Px = 0 and F/B =1 indicate respective symmetric distributions). Results with p <0.05 were considered significantly different.
Supplementary Material
Acknowledgments
KKG was supported by Multidisciplinary Postdoctoral Fellowship awarded by Breast Cancer Research Program, Department of Defense (Award# W81XWH-05-1-0312). GM was supported by a Gates Fellowship. BAG received support from the Pew Scholars Program in the Biomedical Sciences, the Alfred P. Sloan Foundation, and award by National Institutes of Health/ National Cancer Institute (NIH/NCI) to Center of Cancer Nanotechnology Excellence (CCNE) at Northwestern University (Award # 1U54CA119341-01) and NIH Award # 1R21CA137707-01.
References
- 1.Sohrmann M, Peter M. Trends Cell Biol. 2003;13:526–533. doi: 10.1016/j.tcb.2003.08.006. [DOI] [PubMed] [Google Scholar]
- 2.Verkhovsky AB, Svitkina TM, Borisy GG. Curr Biol. 1999;9:11–20. doi: 10.1016/s0960-9822(99)80042-6. [DOI] [PubMed] [Google Scholar]
- 3.Wedlich-Soldner R, Li R. Nat Cell Biol. 2003;5:267–270. doi: 10.1038/ncb0403-267. [DOI] [PubMed] [Google Scholar]
- 4.Zigmond SH, Levitsky HI, Kreel BJ. J Cell Biol. 1981;89:585–592. doi: 10.1083/jcb.89.3.585. [DOI] [PMC free article] [PubMed] [Google Scholar]
- 5.Pollard TD, Borisy GG. Cell. 2003;112:453–465. doi: 10.1016/s0092-8674(03)00120-x. [DOI] [PubMed] [Google Scholar]
- 6.Ridley AJ, Schwartz MA, Burridge K, Firtel RA, Ginsberg MH, Borisy G, Parsons JT, Horwitz AR. Science. 2003;302:1704–1709. doi: 10.1126/science.1092053. [DOI] [PubMed] [Google Scholar]
- 7.Small JV, Rottner K, Kaverina I, Anderson KI. Biochim Biophys Acta. 1998;1404:271–281. doi: 10.1016/s0167-4889(98)00080-9. [DOI] [PubMed] [Google Scholar]
- 8.Bershadsky AD, Balaban NQ, Geiger B. Annu Rev Cell Dev Biol. 2003;19:677–695. doi: 10.1146/annurev.cellbio.19.111301.153011. [DOI] [PubMed] [Google Scholar]
- 9.Vicente-Manzanares M, Ma X, Adelstein RS, Horwitz AR. Nat Rev Mol Cell Biol. 2009;10:778–790. doi: 10.1038/nrm2786. [DOI] [PMC free article] [PubMed] [Google Scholar]
- 10.Schliwa M, Euteneuer U, Graf R, Ueda M. Biochem Soc Symp. 1999;65:223–231. [PubMed] [Google Scholar]
- 11.de Anda FC, Pollarolo G, Da Silva JS, Camoletto PG, Feiguin F, Dotti CG. Nature. 2005;436:704–708. doi: 10.1038/nature03811. [DOI] [PubMed] [Google Scholar]
- 12.Etienne-Manneville S, Hall A. Nature. 2003;421:753–756. doi: 10.1038/nature01423. [DOI] [PubMed] [Google Scholar]
- 13.Danowski BA, Khodjakov A, Wadsworth P. Cell Motil Cytoskeleton. 2001;50:59–68. doi: 10.1002/cm.1041. [DOI] [PubMed] [Google Scholar]
- 14.Sameshima M, Imai Y, Hashimoto Y. Cell Motil Cytoskeleton. 1988;9:111–116. doi: 10.1002/cm.970090203. [DOI] [PubMed] [Google Scholar]
- 15.Euteneuer U, Schliwa M. J Cell Biol. 1992;116:1157–1166. doi: 10.1083/jcb.116.5.1157. [DOI] [PMC free article] [PubMed] [Google Scholar]
- 16.Pouthas F, Girard P, Lecaudey V, Ly TB, Gilmour D, Boulin C, Pepperkok R, Reynaud EG. J Cell Sci. 2008;121:2406–2414. doi: 10.1242/jcs.026849. [DOI] [PubMed] [Google Scholar]
- 17.Uetrecht AC, Bear JE. Eur J Cell Biol. 2009;88:711–717. doi: 10.1016/j.ejcb.2009.08.001. [DOI] [PMC free article] [PubMed] [Google Scholar]
- 18.Weed SA, Karginov AV, Schafer DA, Weaver AM, Kinley AW, Cooper JA, Parsons JT. J Cell Biol. 2000;151:29–40. doi: 10.1083/jcb.151.1.29. [DOI] [PMC free article] [PubMed] [Google Scholar]
- 19.Svitkina TM, Borisy GG. J Cell Biol. 1999;145:1009–1026. doi: 10.1083/jcb.145.5.1009. [DOI] [PMC free article] [PubMed] [Google Scholar]
- 20.Wear MA, Cooper JA. Trends Biochem Sci. 2004;29:418–428. doi: 10.1016/j.tibs.2004.06.003. [DOI] [PubMed] [Google Scholar]
- 21.DeMali KA, Barlow CA, Burridge K. J Cell Biol. 2002;159:881–891. doi: 10.1083/jcb.200206043. [DOI] [PMC free article] [PubMed] [Google Scholar]
- 22.Mejillano MR, Kojima S, Applewhite DA, Gertler FB, Svitkina TM, Borisy GG. Cell. 2004;118:363–373. doi: 10.1016/j.cell.2004.07.019. [DOI] [PubMed] [Google Scholar]
- 23.Yang C, Czech L, Gerboth S, Kojima S, Scita G, Svitkina T. PLoS Biol. 2007;5:e317. doi: 10.1371/journal.pbio.0050317. [DOI] [PMC free article] [PubMed] [Google Scholar]
- 24.Vogel V, Sheetz M. Nat Rev Mol Cell Biol. 2006;7:265–275. doi: 10.1038/nrm1890. [DOI] [PubMed] [Google Scholar]
- 25.Nelson CM, Vanduijn MM, Inman JL, Fletcher DA, Bissell MJ. Science. 2006;314:298–300. doi: 10.1126/science.1131000. [DOI] [PMC free article] [PubMed] [Google Scholar]
- 26.Nelson CM, Tien J. Curr Opin Biotechnol. 2006;17:518–523. doi: 10.1016/j.copbio.2006.08.011. [DOI] [PubMed] [Google Scholar]
- 27.Condeelis J, Segall JE. Nat Rev Cancer. 2003;3:921–930. doi: 10.1038/nrc1231. [DOI] [PubMed] [Google Scholar]
- 28.Cahalan MD, Parker I, Wei SH, Miller MJ. Nat Rev Immunol. 2002;2:872–880. doi: 10.1038/nri935. [DOI] [PMC free article] [PubMed] [Google Scholar]
- 29.Sandulache VC, Parekh A, Dohar JE, Hebda PA. Tissue Eng. 2007;13:2791–2801. doi: 10.1089/ten.2006.0412. [DOI] [PubMed] [Google Scholar]
- 30.Francisco H, Yellen BB, Halverson DS, Friedman G, Gallo G. Biomaterials. 2007;28:3398–3407. doi: 10.1016/j.biomaterials.2007.04.015. [DOI] [PMC free article] [PubMed] [Google Scholar]
- 31.Mader CC, Hinchcliffe EH, Wang YL. Soft Matter. 2007;3:357–363. doi: 10.1039/b606590b. [DOI] [PubMed] [Google Scholar]
- 32.Mahmud G, Campbell CJ, Bishop KJM, Komarova YA, Chaga O, Soh S, Huda S, Kandere-Grzybowska K, Grzybowski BA. Nature Physics. 2009;5:606–612. [Google Scholar]
- 33.Chung CY, Funamoto S, Firtel RA. Trends Biochem Sci. 2001;26:557–566. doi: 10.1016/s0968-0004(01)01934-x. [DOI] [PubMed] [Google Scholar]
- 34.Weiner OD. Curr Opin Cell Biol. 2002;14:196–202. doi: 10.1016/s0955-0674(02)00310-1. [DOI] [PMC free article] [PubMed] [Google Scholar]
- 35.Janetopoulos C, Firtel RA. FEBS Lett. 2008;582:2075–2085. doi: 10.1016/j.febslet.2008.04.035. [DOI] [PMC free article] [PubMed] [Google Scholar]
- 36.Xia YN, Whitesides GM. Angew Chemie-Int Ed. 1998;37:551–575. doi: 10.1002/(SICI)1521-3773(19980316)37:5<550::AID-ANIE550>3.0.CO;2-G. [DOI] [PubMed] [Google Scholar]
- 37.Whitesides GM, Ostuni E, Takayama S, Jiang X, Ingber DE. Annu Rev Biomed Eng. 2001;3:335–373. doi: 10.1146/annurev.bioeng.3.1.335. [DOI] [PubMed] [Google Scholar]
- 38.Campbell CJ, Smoukov SK, Klajn R, Bishop KJM, Grzybowski BA. Langmuir. 2005;21:2637–2640. doi: 10.1021/la046942p. [DOI] [PubMed] [Google Scholar]
- 39.Kandere-Grzybowska K, Campbell CJ, Mahmud G, Komarova Y, Soh S, Grzybowski BA. Soft Matter. 2007;3:672–679. doi: 10.1039/b617308j. [DOI] [PubMed] [Google Scholar]
- 40.Kandere-Grzybowska K, Campbell C, Komarova Y, Grzybowski BA, Borisy GG. Nat Methods. 2005;2:739–741. doi: 10.1038/nmeth796. [DOI] [PubMed] [Google Scholar]
- 41.Brock A, Chang E, Ho CC, LeDuc P, Jiang X, Whitesides GM, Ingber DE. Langmuir. 2003;19:1611–1617. doi: 10.1021/la026394k. [DOI] [PubMed] [Google Scholar]
- 42.Ireland GW, Dopping-Hepenstal P, Jordan P, O’Neill C. J Cell Sci Suppl. 1987;8:19–33. doi: 10.1242/jcs.1987.supplement_8.2. [DOI] [PubMed] [Google Scholar]
- 43.Parker KK, Brock AL, Brangwynne C, Mannix RJ, Wang N, Ostuni E, Geisse NA, Adams JC, Whitesides GM, Ingber DE. Faseb J. 2002;16:1195–1204. doi: 10.1096/fj.02-0038com. [DOI] [PubMed] [Google Scholar]
- 44.Thery M, Pepin A, Dressaire E, Chen Y, Bornens M. Cell Motil Cytoskeleton. 2006;63:341–355. doi: 10.1002/cm.20126. [DOI] [PubMed] [Google Scholar]
- 45.Thery M, Racine V, Piel M, Pepin A, Dimitrov A, Chen Y, Sibarita JB, Bornens M. Proc Natl Acad Sci U S A. 2006;103:19771–19776. doi: 10.1073/pnas.0609267103. [DOI] [PMC free article] [PubMed] [Google Scholar]
- 46.Beningo KA, Dembo M, Wang YL. Proc Natl Acad Sci U S A. 2004;101:18024–18029. doi: 10.1073/pnas.0405747102. [DOI] [PMC free article] [PubMed] [Google Scholar]
- 47.Chen CS, Alonso JL, Ostuni E, Whitesides GM, Ingber DE. Biochem Biophys Res Commun. 2003;307:355–361. doi: 10.1016/s0006-291x(03)01165-3. [DOI] [PubMed] [Google Scholar]
- 48.James J, Goluch ED, Hu H, Liu C, Mrksich M. Cell Motil Cytoskeleton. 2008;65:841–852. doi: 10.1002/cm.20305. [DOI] [PMC free article] [PubMed] [Google Scholar]
- 49.Jiang X, Bruzewicz DA, Wong AP, Piel M, Whitesides GM. Proc Natl Acad Sci U S A. 2005;102:975–978. doi: 10.1073/pnas.0408954102. [DOI] [PMC free article] [PubMed] [Google Scholar]
- 50.Smoukov SK, Bishop KJM, Klajn R, Campbell CJ, Grzybowski BA. Advanced Materials. 2005;17:1361–1365. doi: 10.1002/adma.200402086. [DOI] [PubMed] [Google Scholar]
- 51.Witt D, Klajn R, Barski P, Grzybowski BA. Curr Org Chem. 2004;8:1763. [Google Scholar]
- 52.Novak IL, Slepchenko BM, Mogilner A, Loew LM. Phys Rev Lett. 2004;93:268109. doi: 10.1103/PhysRevLett.93.268109. [DOI] [PubMed] [Google Scholar]
- 53.For circular cells, for more complex shapes composed of regions of high and low curvatures, such as tear-drops shown in Fig. 5, Front/Back Ratio of pheripheral FAs, F/B, described the asymmetric distributions more precisely. For consistency, we use F/B for FAs throughout the paper..
- 54.Hinz B, Alt W, Johnen C, Herzog V, Kaiser HW. Exp Cell Res. 1999;251:234–243. doi: 10.1006/excr.1999.4541. [DOI] [PubMed] [Google Scholar]
- 55.Machacek M, Danuser G. Biophys J. 2006;90:1439–1452. doi: 10.1529/biophysj.105.070383. [DOI] [PMC free article] [PubMed] [Google Scholar]
- 56.Giannone G, Dubin-Thaler BJ, Rossier O, Cai Y, Chaga O, Jiang G, Beaver W, Dobereiner HG, Freund Y, Borisy G, Sheetz MP. Cell. 2007;128:561–575. doi: 10.1016/j.cell.2006.12.039. [DOI] [PMC free article] [PubMed] [Google Scholar]
- 57.Chen CH, Tsai FC, Wang CC, Lee CH. Physical Review Letters. 2009;103:238101. doi: 10.1103/PhysRevLett.103.238101. [DOI] [PubMed] [Google Scholar]
- 58.Lauffenburger DA, Horwitz AF. Cell. 1996;84:359–369. doi: 10.1016/s0092-8674(00)81280-5. [DOI] [PubMed] [Google Scholar]
- 59.Zaidel-Bar R, Ballestrem C, Kam Z, Geiger B. J Cell Sci. 2003;116:4605–4613. doi: 10.1242/jcs.00792. [DOI] [PubMed] [Google Scholar]
- 60.Hu K, Ji L, Applegate KT, Danuser G, Waterman-Storer CM. Science. 2007;315:111–115. doi: 10.1126/science.1135085. [DOI] [PubMed] [Google Scholar]
- 61.Alexandrova AY, Arnold K, Schaub S, Vasiliev JM, Meister JJ, Bershadsky AD, Verkhovsky AB. PLoS One. 2008;3:e3234. doi: 10.1371/journal.pone.0003234. [DOI] [PMC free article] [PubMed] [Google Scholar]
- 62.Gov NS, Gopinathan A. Biophys J. 2006;90:454–469. doi: 10.1529/biophysj.105.062224. [DOI] [PMC free article] [PubMed] [Google Scholar]
- 63.Shlomovitz R, Gov NS. Phys Rev Lett. 2007;98:168103. doi: 10.1103/PhysRevLett.98.168103. [DOI] [PubMed] [Google Scholar]
- 64.Scita G, Confalonieri S, Lappalainen P, Suetsugu S. Trends Cell Biol. 2008;18:52–60. doi: 10.1016/j.tcb.2007.12.002. [DOI] [PubMed] [Google Scholar]
- 65.Ballestrem C, Hinz B, Imhof BA, Wehrle-Haller B. J Cell Biol. 2001;155:1319–1332. doi: 10.1083/jcb.200107107. [DOI] [PMC free article] [PubMed] [Google Scholar]
- 66.Salaycik KJ, Fagerstrom CJ, Murthy K, Tulu US, Wadsworth P. J Cell Sci. 2005;118:4113–4122. doi: 10.1242/jcs.02531. [DOI] [PubMed] [Google Scholar]
- 67.Kaverina I, Rottner K, Small JV. J Cell Biol. 1998;142:181–190. doi: 10.1083/jcb.142.1.181. [DOI] [PMC free article] [PubMed] [Google Scholar]
- 68.Ballestrem C, Wehrle-Haller B, Imhof BA. J Cell Sci. 1998;111( Pt 12):1649–1658. doi: 10.1242/jcs.111.12.1649. [DOI] [PubMed] [Google Scholar]
- 69.Grzybowski BA. Chemistry in Motion: Reaction-Diffusion Systems for Micro-and Nanotechnology. John Wiley and Sons; 2009. [Google Scholar]
Associated Data
This section collects any data citations, data availability statements, or supplementary materials included in this article.