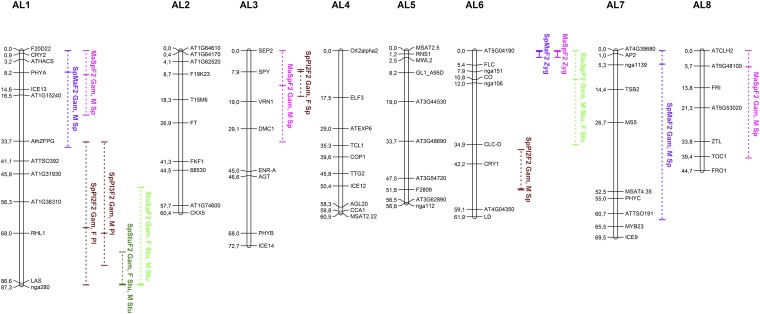
Figure 2.
Locations of TRD regions in A. lyrata crosses on a Sp × Ma map modified from Leppälä and Savolainen (2011). Vertical lines indicate regions with significant (P < 0.001) gametic (dashed line) or zygotic (solid line) TRD. Horizontal ticks mark the likelihood peaks of TRD within such regions. The text indicates which reciprocal progeny was involved and whether gametic (Gam) or zygotic (Zyg) TRD was inferred. With gametic TRD the parent (F, female; M, male) with most distorted allelic ratios and the preferentially transferred allele (e.g., Sp or Ma) is marked.

