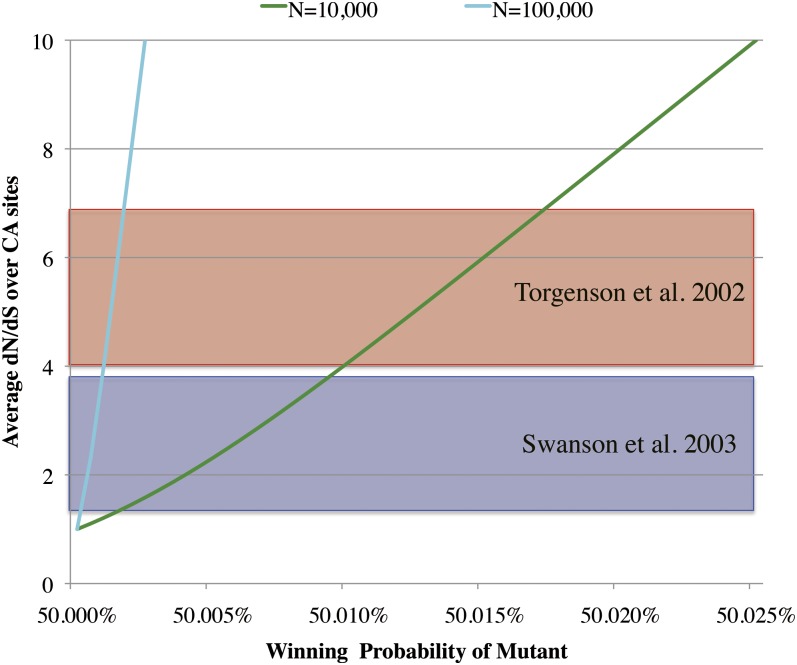
Figure 4.
Average dN/dS as a function of the winning probability of a mutant allele. The colored curves show the dependence of on the winning probability () of the mutant allele A, computed from Equation 17. The diploid population size (N) is set to be 10+4 (green line) and 10+5 (cyan line). Red and blue shaded areas represent the ranges of such dN/dS values obtained by Torgerson et al. (2002) and by Swanson et al. (2003), respectively.

