

Abstract
Hops (Humulus lupulus L.) are used in the brewing of beer, and hop extracts containing prenylated compounds such as xanthohumol and 8-prenylnaringenin are under investigation as dietary supplements for cancer chemoprevention and for the management of hot flashes in menopausal women. To facilitate clinical studies of hop safety and efficacy, a selective, sensitive, and fast ultra-high pressure liquid chromatography tandem mass spectrometry (UHPLC-MS-MS) method was developed and validated for the simultaneous determination of the hop prenylflavonoids xanthohumol, isoxanthohumol, 6-prenylnaringenin, and 8-prenylnaringenin in human serum. The analytical method requires 300 μL of human serum which is processed using liquid-liquid extraction. UHPLC separation was carried out in 2.5 min with gradient elution using a reversed phase column containing 1.6 μm packing material. Prenylflavonoids were measured using negative ion electrospray mass spectrometry with collision-induced dissociation and selected reaction monitoring. The method was validated and showed good accuracy and precision with a lower limit of quantitation (LLOQ) of 0.50 ng/mL for XN (1.4 nM) and 1.0 ng/mL for 6-PN (2.8 nM), XN and IX (2.9 nM) in serum for each analyte.
Introduction
Hops (Humulus lupulus L.) are used in the brewing industry as a preservative and as a flavoring agent for beer. Among the active constituents of hops, prenylated polyphenols have attracted the most interest due to their broad biological activities (1–2). Xanthohumol (XN), a prenylated chalcone, is abundant in hop cones (female inflorescences) and is under investigation as a cancer chemoprevention agent (3–5). Hop preparations containing the prenylflavonoids 8-prenylnaringenin (8-PN), 6-prenylnaringenin (6-PN) and isoxanthohumol (IX) are estrogenic (6–9) and are under investigation as alternatives to traditional hormone replacement therapy for the management of menopausal symptoms in women (10).
Since intramolecular cyclization and metabolic transformation can interconvert these hop prenylflavones (11), a selective and sensitive analytical method is needed for the measurement of all these species during a single analysis. Previous methods for the quantification of hop prenylflavonoids in plasma or serum have used immunoassay (12–13), high performance liquid chromatography with ultraviolet absorbance detection (LC–UV) (14), liquid chromatography–mass spectrometry (LC-MS) (15), or LC-tandem mass spectrometry (LC-MS-MS) (16). Immunoassays require extensive sample preparation to remove interfering, cross-reactive compounds and are unable to detect the low concentrations of prenylflavonoids often occurring in serum or plasma. LC-UV and LC-MS are suitable for the measurement of prenylflavonoids in serum or plasma at high concentrations, but lack sufficient sensitivity to measure prenylflavonoids at low concentrations such as those required for pharmacokinetics studies. Previously, we reported a LC-MS-MS assay for the measurement of XN, IX and 8-PN in human serum, but this assay did not include 6-PN and required more than 20 min per analysis (16).
In the current study, we developed an ultra-high pressure liquid chromatography-MS-MS (UHPLC-MS-MS) method for the simultaneous quantitation of 8-PN, 6-PN, IX, and XN in human serum. This simple method uses enzymatic hydrolysis followed by liquid-liquid extraction and a 2.5 min chromatographic separation using a sub 2 μm reversed-phase C18 column. The use of 8-isopentylnaringenin as an internal standard that closely resembles the analytes together with two SRM transitions (quantifier/qualifier) to monitor each analyte helped provide better selectivity, precision and accuracy than previous methods.
Experimental
Chemicals and Reagents
-
(a)
Acetonitrile. HPLC grade (Fisher, Rockford, IL)
-
(b)
Methanol. HPLC grade (Fisher, Rockford, IL)
-
(c)
Methyl-t-butyl ether. HPLC grade (Fisher, Rockford, IL)
-
(d)
Water. Milli-Q water purification system (Millipore, Billerica, MA)
-
(e)
Formic acid. ACS reagent grade (Sigma-Aldrich, St. Louis, MO)
-
(f)
β-Glucuronidase and sulfatase from Helix pomatia (Sigma-Aldrich, St. Louis, MO)
Reference Materials
Reference standards for 8-prenylnaringenin (8-PN), 6-prenylnaringenin (6-PN), isoxanthohumol (IX), xanthohumol (XN), and 8-pentylprenylnaringenin (IS) were obtained from the UIC/NIH Center for Botanical Dietary Supplements Research, Chicago, IL, USA (see structures in Figure 1). The purity of each reference standard was checked by qNMR.
Figure 1.
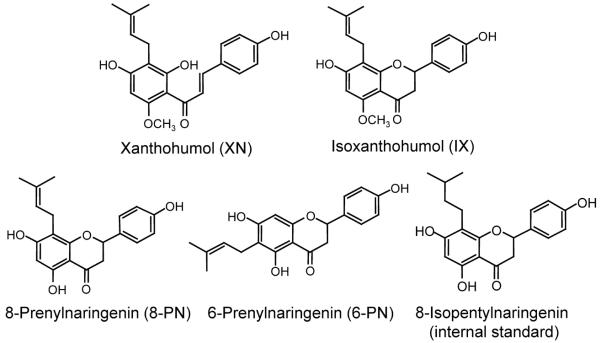
Structures of hop prenylflavonoids and internal standard.
Blank Serum
Blank serum matrix was obtained from Bioreclamation (Hicksville, NY). Serum samples from women who had been administered a single dose of an extract of hops were obtained from the UIC/NIH Center for Botanical Dietary Supplements Research. These serum samples contained no patient identifying information.
Apparatus
-
(a)
Vortex mixer, Type 37600 mixer, (Barnstead Thermolyne, Dubuque, IA)
-
(b)
Block heater, Thermomixer R, (Eppendorf, Hauppauge, NY)
-
(c)
Centrifuge, 5810R, (Eppendorf)
-
(d)
UHPLC system, (Shimadzu, Kyoto, Japan) Nexera UHPLC system consisting of two pumps, degasser, autosampler, column oven, and Shim-pack XR-ODS III C18 column (2.0 × 50 mm, 1.6 μm).
-
(e)
MS-MS, Shimadzu LCMS-8030 triple quadrupole mass spectrometer equipped with electrospray ionization.
-
(f)
HPLC system, Shimadzu LC-20AD equipped with two pumps, degasser, autosampler, UV absorbance detector, and Waters (Milford, MA) XTerra C18 column (2.1 × 100 mm, 3.5 μm).
Sample Preparation
Human serum samples from women participating in a phase I clinical trial of hops were collected and stored at −80 °C until analysis. After thawing and vortex mixing, 300 μL aliquots of serum were spiked with 300 μL of 8-isopentylnaringenin (IS) (20 ng/mL) in 100 mM sodium acetate (pH 5.0) as an internal standard and 60 μL of 50% aqueous methanol/water. The samples were extracted and processed as described below.
Preparation of the calibration curves
Calibration standards and quality control (QC) samples were prepared by mixing 60 μL of each standard or QC solution (in 50% aqueous methanol) with 300 μL blank serum and 300 μL of IS (20 ng/mL) in 100 mM sodium acetate (pH 5.0). The mixtures were extracted and processed as described below.
Hydrolysis
To quantify the total amount of each prenylflavonoid, enzymatic hydrolysis of conjugates was carried out. Serum samples (300 μL) were hydrolyzed using 15 units of sulfatase and 400 units of β-glucuronidase for 1 h at 37 °C followed by liquid-liquid extraction.
Extraction
Liquid-liquid extraction (LLE) of prenlyflavonoids from each sample was carried out twice using 2 mL portions of methyl-t-butyl ether. After centrifugation for 5 min at 4000 × g at 4 °C, the organic layers were removed, combined and evaporated to dryness under a stream of nitrogen. The residue was reconstituted in 100 μL of 70% aqueous methanol. For comparison, protein precipitation using 3-volumes of acetonitrile or solid phase extraction (Waters HLB Oasis, 3 cc, 60 mg) was also evaluated.
UHPLC
UHPLC separations were carried out using a 1.5 min linear gradient from 45–70% acetonitrile in 0.1% aqueous formic acid followed by a hold at 70% for 0.1 min. The UHPLC column was re-equilibrated at 45% acetonitrile for 0.9 min before the next injection. The total run time including equilibration was 2.5 min. The flow rate was 0.5 mL/min.
Tandem Mass Spectrometry
Mass spectrometer parameters were optimized using reference standards and flow injection. Positive ion and negative ion electrospray for the ionization of the prenylflavonoids were compared, and negative ion electrospray was selected for all subsequent experiments. Data were acquired using collision-induced dissociation and selected reaction monitoring (SRM) of two transitions (quantifier and qualifier) for each analyte as follows: m/z 353 to 119 and m/z 353 to 233 for IX and XN; and m/z 339 to 119 and m/z 339 to 219 for 8-PN and 6-PN. The SRM transition of m/z 341 to 119 was monitored for the IS, and the SRM dwell time was 20 ms/ion for all species. The DL temperature was 300°C, the spray voltage was 3500 V, the nebulizing gas flow was 3 L/min, and the drying gas flow was 20 L/min.
Selectivity and Specificity
The specificity of the assay was evaluated by analyzing 6 different lots of blank human serum to test for chromatographic interference. Any peak detected using SRM at the retention time of the corresponding analyte with an area greater than 20% (5% for the IS) of the analyte at the LLOQ was considered significant interference. The LLOQ was defined as a signal to noise ratio of 10.
Precision and Accuracy
The accuracy and precision of the assay were evaluated using 3 separate analyses on 3 consecutive days. Each set of analyses included a standard curve and five replicates of low (3 ng/mL), medium (50 ng/mL) and high (160 ng/mL) QC samples. The measured concentrations of the QC samples were determined based on the corresponding calibration curves. The accuracy of the assay was defined as the percent of the mean of multiple measurements of the 3 QC samples compared with the true value. The precision of the assay was defined as the coefficient of variation calculated from multiple measurements of the QC samples at 3 different concentrations.
Recovery
The recovery of each analyte at low (3 ng/mL) and high concentrations (160 ng/mL) was determined 3 times and was calculated by comparing the peak area ratios of the analyte/internal standard in the extracted samples with blank matrix spiked with analyte after extraction. Internal standards were post-spiked into both the extracted samples and the extracted matrix blanks.
Matrix effect
The potential for matrix effects was investigated by spiking extracted matrix blanks (obtained from 6 different lots of human serum) with analytes and the internal standard followed by UHPLC-MS-MS analysis. The percent coefficient of variation (%CV) was calculated for the peak area ratio of each analyte at each concentration across the lots of serum. Alternatively, matrix effects were evaluated using the method of post column infusion (17). Briefly, a 100 ng/mL solution of each analyte was constantly infused at 100 μL/min into a tee connecting the analytical column to the MS ion source. A pooled blank serum sample that had been prepared using liquid-liquid extraction was injected onto the column to test for any ion suppression or enhancement effects on the signals of the infused analytes.
Stability
Bench-top stabilities of the prenylflavonoids were examined using 3 replicates of QC samples at low and high concentrations that were stored at room temperature on the laboratory bench for 24 h. After sample preparation and analysis, the mean concentration of each analyte was calculated and compared with its nominal concentrations. Freeze-thaw stabilities were tested using 3 replicates of low and high QC samples by freezing the samples at −20°C followed by thawing at room temperature for three cycles. Stabilities in the autosampler were evaluated by re-injecting extracted low and high QC samples (3 replicates each) which had been stored in the autosampler at 4 °C for 24 h. The long-term storage stability of each analyte in human serum at −80 °C was examined for 60 days. The stabilities of stock solutions at 1 mg/mL in methanol stored at −20 °C were evaluated for up to 30 days. The previously stored solutions were compared with freshly made stock solutions. Five replicate injections of each analyte and their internal standards were made for each stock solution.
LC-UV
For comparison, human serum samples that had been prepared following the same procedure as described for UHPLC-MS-MS were analyzed using LC-UV. HPLC was carried out using a flow rate of 0.2 mL/min and a gradient from 0.1% aqueous formic acid to acetonitrile as follows: 0–3 min, 30% acetonitrile; 3–10 min, 30%–70% acetonitrile; and 10–20 min 30% acetonitrile. 8-PN, 6-PN and IX were monitored at 296 nm, and XN was measured at 368 nm.
Results and discussion
Sample preparation
Three extraction approaches were evaluated including LLE, protein precipitation by acetonitrile and solid-phase extraction. Among these, protein precipitation was the fastest, but the recoveries of the prenylflavonoids were lower than for the other approaches (85% compared with 93% using LLE). For the low QC standards, the recovery of prenylflavonoids using SPE (91%) was similar to LLE (93%) at low QC levels but was significantly lower at high QC levels (75% compared with 96% for LLE). Since LLE consistently produced the highest recoveries (93±5.7%) of prenylflavonoids from human serum at all concentration levels, LLE was selected for sample extraction.
UHPLC-MS-MS Optimization
Different organic solvents and modifiers were evaluated with respect to both sensitivity and chromatographic separation during UHPLC-MS-MS. Acetonitrile provided superior LLOQ values than did methanol and produced lower UHPLC backpressure. Adding 0.1% formic acid to the mobile phase was found to enhance ion abundance during positive ion electrospray. Using these optimized UHPLC-MS-MS parameters, baseline separation of all analytes was obtained in less than 2.5 min (Figure 2), which was almost 10-times faster than our previous LC-MS-MS method (16).
Figure 2.
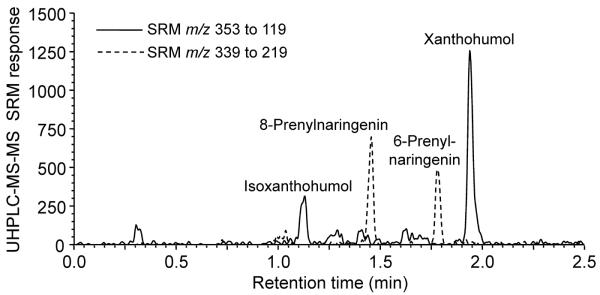
Negative ion electrospray UHPLC-MS-MS SRM chromatograms of 8-PN, 6-IX, and XN standards at 1.0 ng/mL in human serum which is the LLOQ for 8-PN, 6-PN and IX.
Although all of the prenylflavonoids could be ionized using positive ion or negative ion electrospray, negative ion mode provided 1.5-fold lower LLOQ values. The optimized ionization and MS-MS parameters are summarized in Table 1 for each analyte. Data were acquired by monitoring two SRM transitions (quantifier and qualifier) for each analyte, and no cross-talk between SRM channels was observed.
Table 1.
Parameters for negative ion electrospray LC-MS-MS analysis of hop prenylflavonoids and 8-isopentylnaringenin (IS) using collsion-induced dissociation and selected reaction monitoring.
| Analyte | Retention time (min) | Precursor (m/z) | Product (m/z) | Q1 bias | Collision energy (eV) | Q3 bias |
|---|---|---|---|---|---|---|
| 8-PN | 1.4 | 339 | 119 | 26 | 35 | 22 |
| 339 | 219 | 26 | 20 | 15 | ||
| 6-PN | 1.8 | 339 | 119 | 28 | 35 | 23 |
| 339 | 219 | 26 | 20 | 15 | ||
| IX | 1.1 | 353 | 119 | 28 | 25 | 24 |
| 353 | 233 | 28 | 25 | 20 | ||
| XN | 2.0 | 353 | 119 | 28 | 35 | 23 |
| 353 | 233 | 28 | 28 | 23 | ||
| IS | 1.6 | 341 | 119 | 28 | 34 | 23 |
Method Validation
The linearity of each calibration curve was excellent from 1 ng/mL to 500 ng/mL. The calibration curve for each analyte showed a coefficient of determination (R2) >0.997 with a %Bias within ±12.5% at all concentrations (Table 2). During the analysis of 6 different lots of blank human serum, no peaks were observed that could cause significant interference at the retention time of any analyte or internal standard.
Table 2.
Linearity, accuracy and precision of calibration standards (3 analytical runs).
| Std1 1 ng/mL |
Std2 5 ng/mL |
Std3 10 ng/mL |
Std4 50 ng/mL |
Std5 100 ng/mL |
Std6 250 ng/mL |
Std7 500 ng/mL |
Slope | R2 | |
|---|---|---|---|---|---|---|---|---|---|
| 8-PN | |||||||||
| Mean | 0.875 | 4.808 | 10.35 | 54.50 | 102.73 | 262.69 | 480.05 | 0.0554 | 0.9970 |
| S.D. | 0.013 | 0.209 | 0.23 | 0.76 | 4.73 | 10.87 | 12.41 | 0.0049 | 0.0026 |
| %CV | 1.45 | 4.34 | 2.24 | 1.39 | 4.60 | 4.14 | 2.58 | 8.78 | 0.26 |
| %Bias | −12.5 | −3.9 | 3.5 | 9.0 | 2.7 | 5.1 | −4.0 | ||
| 6-PN | |||||||||
| Mean | 0.904 | 5.100 | 10.86 | 50.21 | 94.86 | 264.32 | 489.75 | 0.0546 | 0.9978 |
| S.D. | 0.059 | 0.140 | 0.28 | 2.55 | 4.25 | 10.12 | 7.63 | 0.0058 | 0.0020 |
| %CV | 6.52 | 2.75 | 2.59 | 5.08 | 4.48 | 3.83 | 1.56 | 10.56 | 0.20 |
| %Bias | −9.6 | 2.0 | 8.6 | 0.4 | −5.2 | 5.7 | −2.1 | ||
| IX | |||||||||
| Mean | 0.917 | 4.808 | 10.09 | 54.02 | 102.02 | 261.72 | 482.42 | 0.0317 | 0.9980 |
| S.D. | 0.022 | 0.137 | 0.16 | 0.23 | 3.27 | 5.20 | 3.31 | 0.0047 | 0.0007 |
| %CV | 2.38 | 2.85 | 1.54 | 0.43 | 3.21 | 1.99 | 0.69 | 14.83 | 0.07 |
| %Bias | −8.4 | −3.9 | 0.9 | 8.1 | 2.0 | 4.6 | −3.6 | ||
| XN | |||||||||
| Mean | 0.910 | 5.079 | 9.928 | 51.40 | 103.27 | 265.04 | 480.29 | 0.2069 | 0.9973 |
| S.D. | 0.031 | 0.153 | 0.405 | 1.03 | 3.89 | 10.17 | 6.62 | 0.0168 | 0.0013 |
| %CV | 3.41 | 3.00 | 4.08 | 2.00 | 3.77 | 3.84 | 1.38 | 8.11 | 0.13 |
| %Bias | −9.1 | 1.5 | −0.8 | 2.8 | 3.3 | 6.0 | −4.0 | ||
Accuracy and precision were assessed over three days (Table 3). The intra-assay and inter-assay %CV were ≤15%, and the %Bias was <±13%. Overall, the %CV of the calculated concentrations from the 3 runs demonstrated excellent reproducibility. The lower limit of quantitation (LLOQ) for XN was 0.50 ng/mL (1.4 nM), and the LLOQ was 1 ng/mL for 6-PN, 8-PN (2.94 nM) and IX (2.82 nM) (Figure 2). The LLOQ for 6-PN, 8-PN and IX was different than that for XN, since only XN is a chalcone (Figure 1).
Table 3.
Intra-assay and inter-assay accuracy and precision for the quantitative analysis of 8PN, 6PN, XN, and IX using UHPLC-MS-MS.
| Analyte | Nominal value (ng/mL) | Measured value (ng/mL) | Intra day N=5 | Inter day N=15 | ||
|---|---|---|---|---|---|---|
|
| ||||||
| CV% | Accuracy | CV% | Accuracy | |||
| 8-PN | ||||||
| Low | 3 | 3.12 | 10.5 | 102 | 12.1 | 104 |
| Med | 50 | 51.6 | 4.7 | 101 | 7.8 | 103 |
| High | 160 | 156 | 5.3 | 95 | 6.2 | 97 |
| 6-PN | ||||||
| Low | 3 | 3.23 | 10.9 | 108 | 11.7 | 107 |
| Med | 50 | 48.7 | 4.7 | 96 | 7.8 | 97 |
| High | 160 | 163 | 5.3 | 103 | 4.4 | 101 |
| IX | ||||||
| Low | 3 | 3.42 | 12.9 | 103 | 13.5 | 113 |
| Med | 50 | 56.2 | 4.7 | 94 | 7.8 | 112 |
| High | 160 | 169 | 5.3 | 102 | 4.4 | 105 |
| XN | ||||||
| Low | 3 | 3.2 | 9.5 | 102 | 12.1 | 106 |
| Med | 50 | 52.9 | 4.7 | 99 | 7.8 | 105 |
| High | 160 | 152 | 5.3 | 93 | 4.4 | 95 |
All 4 analytes were stable on the bench-top (room temperature) for 24 h, during 3 freeze/thaw cycles, in the autosampler at 4 °C for 24 h, and during long-term storage for up to 60 days at −80 °C (Table 4). The stock solution in methanol was also stable (>92%) for up to 30 days. Samples containing low and high concentrations of glucuronic acid conjugates of XN and 8-PN were hydrolyzed enzymatically for 30 min, 1 h, 2 h, or 4 h. By monitoring the appearance of each aglycone and the disappearance of each glucuronide using UHPLC-MS-MS, incubation with deconjugating enzymes for 1 h at 37 °C was found to produce complete hydrolysis of the glucuronides. Although no sulfate conjugates of hop prenylflavonoids were detected in the human serum samples, sulfatase was included during enzymatic hydrolysis just in case.
Table 4.
Stability of hop prenylflavonoids during sample storage and handling.
| Storage condition | QC concentration (ng/mL) | Remaining % (±S.D.) |
|||
|---|---|---|---|---|---|
| 8-PN | 6-PN | IX | XN | ||
| Freeze/thaw 3 cycles | 3 | 95.7±5.6 | 90.4±4.1 | 94.7±6.3 | 100.0±12.3 |
| 160 | 103.2±12.1 | 94.6±11.9 | 99.9±2.2 | 96.4±2.2 | |
| Autosampler 4°C 24 h | 3 | 98.5±8.2 | 92.6±5.4 | 99.5±8.2 | 95.5±6.2 |
| 160 | 101.5±3.7 | 103.1±4.2 | 101.5±3.7 | 94.8±6.5 | |
| Bench top 24 h | 3 | 96.9±1.1 | 92.6±1.9 | 95.4±2.6 | 93.2±6.8 |
| 160 | 97.5±1.5 | 93.5±3.6 | 93.6±6.2 | 92.8±7.4 | |
| Long term −80°C 60 days | 3 | 93.5±2.5 | 94.3±6.0 | 91.5±3.7 | 94.5±2.9 |
| 160 | 94.8±3.8 | 95.2±8.2 | 90.5±8.6 | 91.3±5.6 | |
Possible matrix effects were investigated by calculating the %CV of the peak area ratio of the analyte/internal standard spiked at low and high concentrations into extracts of 6 lots of blank human serum. The %CV values were ≤ 9.5%, ≤ 10.8%, ≤ 8.2%, and ≤ 11.6% for 8-PN, 6-PN, IX, and XN, respectively. These results indicated that there was no significant matrix effect. Post-column infusion was also performed to check for any ionization suppression or enhancement caused by matrix components. No significant signal suppression/enhancement was observed at the retention time of each analyte (data not shown).
Comparison of UHPLC-MS-MS with LC-UV
To illustrate the utility of the new UHPLC-MS-MS method, LC-UV was used to analyze the same extracts of human serum spiked with hop prenylflavonoids. The LLOQ of the LC-UV approach was 100 ng/mL (294 nM for 8-PN and 6-PN; and 282 nM for XN and IX), which was 100-fold higher than that obtained using UHPLC-MS-MS. The linear range was 100 ng/mL to 5000 ng/mL. The LC-UV separation required 25 min (20 min plus column re-equilibration of 5 min), which was 10-fold slower than UHPLC-MS-MS.
LC-UV (Figure 3) and UHPLC-MS-MS (Figure 4) were then used to analyze an extract of human serum from a volunteer who had consumed capsules containing a hop extract standardized to 1.0 mg of 8-PN. Many peaks were detected during LC-UV analysis of the serum extract, and either no peaks eluted at the expected retention times of the hop prenylflavonoids or interfering substances with similar retention times prevented their measurement. In contrast, all 4 hop prenylflavonoids were detected during UHPLC-MS-MS (Figure 4), including XN (24.4 ng/mL; 68.8 nM), IX (32.0 ng/mL; 90.3 nM), 6-PN (7.47 ng/mL; 22.0 nM), and 8-PN (7.32 ng/mL; 21.5 nM). Chromatographic peak shape was excellent, and no interfering peaks were observed during UHPLC-MS-MS.
Figure 3.
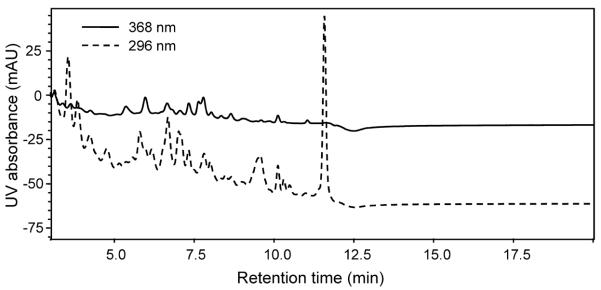
LC-UV measurement of prenylflavonoids in serum obtained from a volunteer 2 h after consumption of a hop extract standardized to 1 mg 8-PN. Although many peaks were detected, none corresponded to the retention times of XN, IX, 6-PN, or 8-PN. The solid line represents UV absorption at 368 nm (for XN), and the dashed line represents UV absorption at 296 nm (for IX, 6-PN and 8-PN).
Figure 4.

UHPLC-MS-MS chromatogram of the same human serum extract analyzed using LC-UV in Figure 3 that was obtained from a volunteer 2 h after consuming a hop extract standardized to 1 mg 8-PN. Unlike LC-UV, all 4 prenylflavonoids produced signals above the LLOQ during UHPLC-MS-MS (see text for measured concentrations).
Finally, the UHPLC-MS-MS method was used to analyze serum from 5 women who each consumed a single dose of a hop extract in a Phase I pharmacokinetics study. The time-concentration profile of 8-PN, 6-PN, IX, and XN in serum for the first 24 h following administration of the hop extract is shown in Figure 5. Except at baseline, all of the analytes were detected at levels above the LLOQ in each serum sample for up to 24 h.
Figure 5.

Concentration-time curves for the hop prenylflavonoids 8-PN, 6-PN, IX, and XN in human serum following oral administration of a hop extract standardized to 1.0 mg 8-PN and containing 5.2 mg 6-PN, 3.2 mg IX, and 85.2 mg XN. Each time point represents the mean concentration in serum samples from 5 women determined using UHPLC-MS-MS.
In conclusion, an analytical method was developed and validated based on UHPLC-MS-MS for the measurement of 4 hop prenylflavonoids in human serum. Compared with other existing methods, UHPLC-MS-MS significantly increases the speed and sensitivity of analysis while maintaining good accuracy and precision. The new UHPLC-MS-MS method was found to be suitable for the measurement of prenylflavonoids in the serum of human subjects from an on-going phase I clinical trial.
Acknowledgments
This research was supported by NIH grants P50 AT00155 and P50 AT00155-12S1 from the Office of Dietary Supplements and the National Center for Complementary and Alternative Medicine. We thank Shimadzu for providing the UHPLC-MS-MS system.
References
- 1.Stevens JF, Page JE. Phytochemistry. 2004;65:1317–1330. doi: 10.1016/j.phytochem.2004.04.025. [DOI] [PubMed] [Google Scholar]
- 2.Gerhäuser C. Eur. J. Cancer. 2005;41:1941–1954. doi: 10.1016/j.ejca.2005.04.012. [DOI] [PubMed] [Google Scholar]
- 3.Miranda C, Stevens J, Helmrich A, Henderson M, Rodriguez R, Yang YH, Deinzer M, Barnes D, Buhler D. Food Chem. Toxicol. 1999;37:271–285. doi: 10.1016/s0278-6915(99)00019-8. [DOI] [PubMed] [Google Scholar]
- 4.Miranda C, Aponso G, Stevens J, Deinzer M, Buhler D. Cancer Lett. 2000;149:21–29. doi: 10.1016/s0304-3835(99)00328-6. [DOI] [PubMed] [Google Scholar]
- 5.Gerhauser C, Alt A, Heiss E, Gamal-Eldeen A, Klimo K, Knauft J, Neumann I, Scherf HR, Frank N, Bartsch H. Mol. Cancer Ther. 2002;1:959–969. [PubMed] [Google Scholar]
- 6.Milligan S, Kalita J, Heyerick A, Rong H, De Cooman L, De Keukeleire D. J. Clin. Endocrinol. Metab. 1999;84:2249–2252. doi: 10.1210/jcem.84.6.5887. [DOI] [PubMed] [Google Scholar]
- 7.Milligan S, Kalita J, Pocock V, van De Kauter V, Stevens J, Deinzer M, Rong H, De Keukeleire D. J. Clin. Endocrinol. Metab. 2000;85:4912–4915. doi: 10.1210/jcem.85.12.7168. [DOI] [PubMed] [Google Scholar]
- 8.Liu J, Burdette JE, Xu H, Gu C, van Breemen RB, Bhat KPL, Booth N, Constantinou AI, Pezzuto JM, Fong HHS. J. Agric. Food Chem. 2001;49:2472–2479. doi: 10.1021/jf0014157. [DOI] [PubMed] [Google Scholar]
- 9.Chadwick LR, Nikolic D, Burdette JE, Overk CR, Bolton JL, van Breemen RB, Fröhlich R, Fong HHS, Farnsworth NR, Pauli GF. J. Nat. Prod. 2004;67:2024–2032. doi: 10.1021/np049783i. [DOI] [PMC free article] [PubMed] [Google Scholar]
- 10.Milligan S, Kalita J, Pocock V, Heyerick A, De Cooman L, Rong H, De Keukeleire D. Reproduction. 2002;123:235–242. [PubMed] [Google Scholar]
- 11.Nikolic D, Li Y, Chadwick LR, Pauli GF, van Breemen RB. J. Mass Spectrom. 2005;40:289–299. doi: 10.1002/jms.753. [DOI] [PubMed] [Google Scholar]
- 12.Wyns C, Derycke L, Soenen B, Bolca S, Deforce D, Bracke M, Heyerick A. Talanta. 2011;85:197–205. doi: 10.1016/j.talanta.2011.03.047. [DOI] [PubMed] [Google Scholar]
- 13.Schaefer O, Bohlmann R, Schleuning WD, Schulze-Forster K, Hümpel M. J. Agric. Food Chem. 2005;53:2881–2889. doi: 10.1021/jf047897u. [DOI] [PubMed] [Google Scholar]
- 14.Avula B, Ganzera M, Warnick JE, Feltenstein MW, Sufka KJ, Khan IA. J. Chromatogr. Sci. 2004;42:378–382. doi: 10.1093/chromsci/42.7.378. [DOI] [PubMed] [Google Scholar]
- 15.Wyns C, Bolca S, De Keukeleire D, Heyerick A. J. Chromatogr., B: Anal. Technol. Biomed. Life Sci. 2010;878:949–956. doi: 10.1016/j.jchromb.2010.02.022. [DOI] [PubMed] [Google Scholar]
- 16.Bolca S, Li J, Nikolic D, Roche N, Blondeel P, Possemiers S, De Keukeleire D, Bracke M, Heyerick A, van Breemen RB, Depypere H. Mol. Nutr. Food Res. 2010;54:S284–S294. doi: 10.1002/mnfr.200900519. [DOI] [PMC free article] [PubMed] [Google Scholar]
- 17.Bonfiglio R, King RC, Olah TV, Merkle K. Rapid Commun. Mass Spectrom. 1999;13:1175–1185. doi: 10.1002/(SICI)1097-0231(19990630)13:12<1175::AID-RCM639>3.0.CO;2-0. [DOI] [PubMed] [Google Scholar]