

Abstract
The human mitochondrial RNA polymerase (h-mtRNAP) serves as both the transcriptase for expression and the primase for replication of mitochondrial DNA. As such, the enzyme is of fundamental importance to cellular energy metabolism, and defects in its function may be related to human disease states. Here we describe in vitro analysis of the h-mtRNAP kinetic mechanism for single, correct nucleotide incorporation. This was made possible by the development of efficient methods for expression and purification of h-mtRNAP using a bacterial system and by utilization of assays that rely on simple, synthetic RNA/DNA scaffolds without the need for mitochondrial transcription accessory proteins. We find that h-mtRNAP accomplishes single-nucleotide incorporation by using the same core steps, including conformational change steps before and after chemistry, that are prototypical for most types of nucleic acid polymerases. The polymerase binds to scaffolds via a two-step mechanism consisting of a fast initial-encounter step followed by a much slower isomerization that leads to catalytic competence. A substantial solvent deuterium kinetic isotope effect was observed for the forward reaction, but none was detectable for the reverse reaction, suggesting that chemistry is at least partially rate-limiting in the forward direction but not in the reverse. h-mtRNAP appears to exercise much more stringent surveillance over base than over sugar in determining the correctness of a nucleotide. The utility of developing the robust in vitro assays described here and of establishing a baseline of kinetic performance for the wild-type enzyme is that biological questions concerning h-mtRNAP may now begin to be addressed.
Interest in mitochondrial molecular biology and biochemistry has increased over the past decade as data implicating mitochondrial dysfunction in a variety of human diseases and aging processes have accumulated.1–3 The range of pathologies now suspected of having a basis in altered mitochondrial function includes, among others, certain cancers, neurodegenerative disorders, muscular dystrophies, and cardiac diseases.1–8 Although our understanding of which specific defects in mitochondrial molecular biology give rise to particular disease states is improving,3–5,8 very little information about the influence of defective transcription of the mitochondrial genome on human health is available.9–11
The human mitochondrial RNA polymerase (h-mtRNAP, also known as POLRMT) produces RNA from the mitochondrial genome,12,13 with the help of several accessory proteins.12,13 The mitochondrial transcription accessory proteins best characterized to date are h-mtTFA, h-mtTFB2, and h-mtTERF.12,13 The human mitochondrial genome consists of only ~16.6 kb of DNA encoding 13 protein subunits, two rRNAs, and 22 tRNAs, all essential to the oxidative phosphorylation pathway, which produces nearly all cellular ATP.12–14 h-mtRNAP also serves as the primase for mitochondrial DNA replication.12,13,15
Although mitochondria are believed to be derived from an α-proteobacterium that took up residence in an early ancestor of current eukaryotic cells,14 mtRNAPs share no recognizable amino acid sequence similarity with multisubunit bacterial RNAPs.16,17 They do, however, share amino acid sequence similarity with the single-subunit T-odd bacteriophage class of RNAPs,16,17 of which T7 RNAP is the paradigm.18,19 The regions that are the most similar are clustered in a number of subdomains arranged colinearly over the carboxyl two-thirds of mtRNAP sequence.16,17 In all species, the mtRNAP is encoded by the nuclear genome and imported into mitochondria.14 Therefore, it appears that eukaryotes recruited a single-subunit phage DNA-directed RNA polymerase to transcribe their mitochondrial genomes.
As a starting point for understanding the enzymology of human mitochondrial transcription, we have examined the binding and catalytic properties of h-mtRNAP in the absence of accessory proteins. Several technical advances were required to allow the studies reported here. Obtaining h-mtRNAP in quantities sufficient for quantitative biochemical studies has been problematic.20–23 We have overcome this obstacle by developing an approach for expression at high levels in Escherichia coli, along with methods for purification that result in large yields of highly pure, catalytically active h-mtRNAP. In addition, we have developed robust, simple in vitro assays that permitted elucidation of the kinetic mechanism for the h-mtRNAP single-nucleotide incorporation cycle.
MATERIALS AND METHODS
Materials
RNA oligonucleotides were from Dharmacon Research, Inc. DNA oligonucleotides and DNA oligonucleotides containing 2-aminopurine were from Integrated DNA Technologies, Inc. 5′-Fluorescein-labeled DNA oligonucleotides were from Operon. Deep Vent DNA polymerase and restriction enzymes were from New England Biolabs, Inc. HerculaseII Fusion DNA polymerase was from Stratagene. EDTA-free protease tablets were from Roche. Difco-NZCYM was from BD Biosciences. T4 polynucleotide kinase was from USB. Ultrapure NTP solutions were from GE Healthcare. [α-32P]GTP (3000 Ci/mmol) and [α-32P]ATP (3000 Ci/mmol) were from Perkin-Elmer. [γ-32P]ATP (7000 Ci/mmol) was from MP Biomedical. D2O was from Isotec (Miamisburg, OH). Deuterated glycerol was from Cambridge Isotope Laboratories (Andover, MA). Poly(ethylenimine)cellulose TLC plates were from EM Science. Sodium pyrophosphate was from American Bioanalytical. Lithium chloride, sodium acetate, and urea were from Fisher. All other reagents were of the highest grade available from Sigma, Fisher, or VWR.
Construction of the pET26Ub-AflII Plasmid
An expression plasmid that contains a unique AflII restriction site at the 3′-end of the ubiquitin gene in pET26Ub24 was constructed for efficient cloning of the h-mtRNAP gene. Polymerase chain reaction (PCR) was performed using the pET26Ub24 plasmid as a template, oligonucleotides 1 and 2 (Table S1 of the Supporting Information), and Deep Vent DNA polymerase. The PCR product was then cloned into pET26Ub using NdeI and SacII sites. The final construct, the pET26Ub-AflII plasmid, was confirmed by sequencing at The Pennsylvania State University Nucleic Acid Sequencing Facility.
Construction of pET26Ub-h-mtRNAP Expression Plasmids
The gene encoding h-mtRNAP was amplified using a human cDNA clone (catalog no. TC124101, accession number NM_005035.2, OriGene Technologies) as a template, oligonucleotides 3 and 4 (Table S1 of the Supporting Information) and HerculaseII Fusion DNA polymerase. Identification of D1151 as a catalytically essential active site amino acid residue was achieved by primary amino acid sequence alignment with T7 RNAP. For D1151A h-mtRNAP, overlap extension PCR was performed. First, two PCR fragments were amplified using oligonucleotides 3 and 5 and oligonucleotides 6 and 4 (Table S1 of the Supporting Information) encoding point mutation D1151A. These two fragments were then used as templates for the amplification of a new fragment using oligonucleotides 3 and 4 (Table S1 of the Supporting Information). The PCR products of wild-type (WT) h-mtRNAP and D1151A h-mtRNAP were cloned into the pET26Ub-AflII plasmid using AflII and XhoI sites. The final constructs (pET26Ub-WT h-mtRNAP and pET26Ub-D1151A h-mtRNAP) were confirmed by sequencing at The Pennsylvania State University Nucleic Acid Sequencing Facility.
Expression and Purification of WT and D1151A h-mtRNAP
E. coli BL21(DE3)pCG1 cells24 were transformed with either pET26Ub-WT h-mtRNAP or pET26Ub-D1151A h-mtRNAP for protein expression. BL21(DE3)pCG1 cells containing the pET26Ub-h-mtRNAP plasmid were grown in 100 mL of medium (NZCYM) supplemented with kanamycin (25 μg/mL), chloramphenicol (20 μg/mL), and dextrose (0.4%) at 37 °C until an OD600 of 1.0 was reached. This culture was then used to inoculate 4 L of K25, C20-supplemented medium, to an OD600 of 0.1. The cells were grown at 37 °C to an OD600 of 0.8–1.0 and then cooled to 25 °C. Protein expression was induced via addition of isopropyl β-D-thiogalactopyranoside (IPTG, 0.5 mM) and grown at 25 °C for 4 h. The cells were harvested by centrifugation and then frozen and stored at −80 °C until they were used. Frozen cells were thawed and suspended in lysis buffer [50 mM Tris-HCl (pH 8.0), 200 mM NaCl, 20% glycerol, 10 mM BME, 0.1% NP-40, and protease inhibitors] to a concentration of 4 mL/g of cell paste. The cell suspension was lysed by being passed through a French press (SLM-AMINCO). Lysates were clarified by centrifugation for 30 min at 25000 rpm (75000g) and 4 °C, and the clarified lysate was decanted and precipitated with ammonium sulfate to a final concentration of 40%. The ammonium sulfate-precipitated material was suspended in 10 mM CAPS (pH 10.0), 20% glycerol, 10 mM BME, 0.1% NP-40, 500 mM NaCl, and protease inhibitors, and polyethyleneimine (PEI) was slowly added to the solution to a final concentration of 0.25% (v/v) to precipitate nucleic acids. The PEI supernatant was decanted and then diluted into 50 mM Tris-HCl (pH 7.5), 20% glycerol, 10 mM BME, and 0.1% NP40 to a final NaCl concentration of 200 mM. The diluted PEI supernatant was loaded onto a phosphocellulose (P-11) column (Whatman) at a flow rate of 2 mL/min (approximately 1 mL of bed volume/25 mg of total protein) equilibrated with buffer A [50 mM Tris-HCl (pH 8.0), 20% glycerol, 10 mM BME, and 0.1% NP-40] containing 200 mM NaCl. After being loaded, the column was washed with 2 column volumes of buffer A containing 200 mM NaCl. The column was then washed a second time with 2 column volumes of buffer A containing 350 mM NaCl. Protein was eluted from the phosphocellulose column with buffer A containing 1 M NaCl. Fractions (5 mL) were collected and assayed for purity by sodium dodecyl sulfate–polyacrylamide gel electrophoresis (SDS–PAGE). Fractions with the highest purity were pooled and dialyzed with three changes of buffer A containing 100 mM NaCl (molecular weight cutoff of 24000). The dialyzed sample was loaded through a Q-Sepharose (GE Healthcare) column (1 mL of bed volume/25 mg of protein) at 1 mL/min connected in tandem to a SP-Sepharose (GE Healthcare) column (1 mL of bed volume/25 mg of protein) equilibrated with buffer A containing 100 mM NaCl. After being loaded, the columns were washed with 4 column volumes of buffer A containing 100 mM NaCl. After being washed, the SP-Sepharose column was disconnected from the Q-Sepharose column and subsequently washed with 2 column volumes of buffer A containing 100 mM NaCl. Protein was eluted from the SP-Sepharose column with buffer A containing 500 mM NaCl. Fractions (0.5 mL) were collected and assayed for purity by SDS–PAGE. The protein concentration was determined by measuring the absorbance at 280 nm by using a Nanodrop spectrophotometer and using a calculated molar extinction coefficient of 137740 M−1 cm−1. h-mtRNAP was then concentrated to 4–8 mg/mL (30–60 μM) using Vivaspin concentrators (Sartorius). Purified, concentrated protein was aliquoted and frozen at −80 °C until it was used. Typical h-mtRNAP yields were 1 mg/5 g of E. coli cells, which can be produced from 1 L of culture. h-mtRNAP with comparable activity and purity can be obtained from Enzymax (Lexington, KY).
Poly(rG)-Specific Activity Assays
Reaction mixtures contained 10 mM Tris (pH 8.0), 10 mM MgCl2, 1 mM DTT, poly(dG/dC) (100 μM dGMP/dCMP), 500 μM GTP, 0.2 μCi/μL [α-32P]GTP, and 50 ng of purified RNAP in a final reaction volume of 50 μL. Reactions were initiated by addition of h-mtRNAP, mixtures incubated at 30 °C for 5 min, and reactions quenched with 50 mM EDTA. The amount of GMP incorporated was determined by the DE81 filter binding method.
Product Analysis via DE81 Filter Binding
Five microliters of the quenched reaction mixture was spotted onto DE81 filter paper disks and dried completely. The disks were washed three times for 10 min in 250 mL of 5% dibasic sodium phosphate and rinsed in absolute ethanol. Bound radioactivity was quantitated by liquid scintillation counting in 5 mL of Ecoscint scintillation fluid (National Diagnostics).
Purification of RNA and DNA Oligonucleotides
RNA and DNA oligonucleotides were purified by denaturing PAGE as described previously.25 Concentrations were determined by measuring the absorbance at 260 nm using a Nanodrop spectrophotometer and using the appropriate calculated extinction coefficient.
Nucleic Acid Scaffold Substrates
RNA-primed DNA templates were produced by annealing 10–20 μM RNA primer and DNA template oligonucleotides in T10E1 [10 mM Tris (pH 8.0) and 1 mM EDTA] in a Progene Thermocycler (Techne). Annealing reaction mixtures were heated to 90 °C for 1 min and slowly cooled (5 °C/min) to 10 °C. RNA primers were 12 or 13 nucleotides (nt) long. DNA templates were 18 nt long. Annealed scaffolds contained 8 or 9 bp of the RNA/DNA heteroduplex. Specific scaffolds are described in the figure legends.
5′-32P Labeling of RNA Oligonucleotides
RNA oligonucleotides were end-labeled by using [γ-32P]ATP and T4 polynucleotide kinase from USB. Reaction mixtures, with a typical volume of 100 μL, contained 1 μM [γ-32P]ATP, 100 μM RNA oligonucleotide, 1× kinase buffer, and 0.4 unit/μL T4 polynucleotide kinase. Reaction mixtures were incubated at 37 °C for 60 min and then held at 65 °C for 10 min to heat inactivate T4 polynucleotide kinase.
Bench Top Primer Extension Assays
Reaction buffer (RB) consisted of 1× MTCN (50 mM MES, 25 mM Tris, 25 mM CAPS, and 50 mM NaCl) (pH 7.5), 10 mM MgCl2, and 1 mM DTT. To this were added various concentrations of NTP, nucleic acid scaffolds containing 5′-32P-labeled RNA oligonucleotide, and h-mtRNAP. Reactions were quenched by addition of EDTA to a final concentration of 50 mM. Specific concentrations of NTP, scaffold, and h-mtRNAP, along with any deviations from those given above, are indicated in the figure legends. For all reaction mixtures in this study with a final NTP concentration of >1 mM, the amount of free Mg2+ was kept constant by increasing the concentration of MgCl2 to 10 mM with a NTP concentration of >1 mM. h-mtRNAP was diluted immediately prior to use in enzyme dilution buffer (EDB), which consisted of 10 mM Tris (pH 8.0), 1 mM DTT, and 20% glycerol. The volume of h-mtRNAP added to any reaction mixture was always smaller than or equal to one-tenth of the total volume. All reactions were performed at 30 °C. Products were analyzed by denaturing PAGE as described below and quantitated by phosphor-imaging (GE).
Product Analysis via Denaturing PAGE
An equal volume of loading buffer, 5 μL (70% formamide, 0.025% bromophenol blue, and 0.025% xylene cyanol), was added to 5 μL of quenched reaction mixtures and heated to 70 °C for 2–5 min prior to 5 μL being loaded on a denaturing 23% polyacrylamide gel containing 1× TBE (89 mM Tris base, 89 mM boric acid, and 2 mM EDTA) and 7 M urea. Electrophoresis was performed in 1× TBE at 90 W. Gels were visualized using a PhosphorImager (GE) and quantified using ImageQuant (GE).
Rapid Chemical-Quench-Flow Primer Extension Assays
Rapid mixing/quenching experiments were performed by using a model RQF-3 chemical-quench-flow apparatus (KinTek Corp., Austin, TX) equipped with a water bath. All reactions were performed at 30 °C. h-mtRNAP was diluted immediately prior to use in EDB. The volume of h-mtRNAP added to any reaction mixture was always equal to one-twentieth of the total reaction volume. We performed reactions by incubating in most cases 0.25 μM h-mtRNAP with 0.2 μM nucleic acid scaffold containing 5′-32P-labeled RNA oligonucleotide in RB at room temperature for 3 min, equilibrating the mixture at 30 °C, and then rapidly mixing it with NTP in a solution containing RB. Reactions were quenched by addition of either EDTA to a final concentration of 0.3 M or HCl to a final concentration of 1 M. For HCl-quenched reactions, the solution was immediately neutralized by addition of KOH and Tris to final concentrations of 1 M and 300 mM, respectively. Products were analyzed by denaturing PAGE. Product formation was plotted as a function of time and fit to a single-exponential equation (eq 1):
| (1) |
where A is the amplitude, kobs is the observed rate constant, and C is the end point. Values for kpol, the maximal rate constant for single-nucleotide incorporation, and Kd,app, the apparent dissociation constant for NTP, were obtained by first determining kobs by using eq 1 for a range of NTP concentrations and then fitting plots of kobs dependence on NTP concentration to a hyperbolic equation (eq 2):
| (2) |
Trypsin Cleavage Reactions
Reaction mixtures (20 μL) contained RB, 50 μM ATP, 4.5 μM nucleic acid scaffold, and 3 μM RNAP (~0.3 μg/μL). Reactions were performed via incubation of RNAP in the absence or presence of scaffold at room temperature for 10 min, and then ATP or buffer was added for 1 min, at which point the reaction was initiated by the addition of trypsin (final concentration of 0.001 μg/μL), the mixture incubated for 5 min at room temperature, and then the reaction quenched by addition of 10 mM PMSF (final concentration) and 1× SDS–PAGE buffer (final concentration). Reaction mixtures were immediately held at 90 °C for 5 min prior to 20 μL of them being loaded on an 8% SDS–PAGE gel. Electrophoresis was performed in 1× SDS–PAGE buffer at 40 mA, and gels were stained with Coomassie blue.
Stopped-Flow Fluorescence Anisotropy h-mtRNAP– RNA/DNA Scaffold Binding Assays
Stopped-flow fluorescence anisotropy assays for observing time-dependent h-mtRNAP– nucleic acid scaffold binding were conducted with a model SF-2001 stopped-flow apparatus (Kintek Corp.) equipped with a water bath. All reactions were conducted at 30 °C. Assays were performed by rapidly mixing 10 nM RNA/DNA scaffold having 5′-fluorescein-labeled DNA with a range of concentrations of h-mtRNAP in RB and monitoring the increase in fluorescence anisotropy as a function of time. Excitation light with a wavelength of 490 nm passed through a vertical polarizer into the observation cell. Emitted light passed through vertical or horizontal polarizers arranged in T-format and then through 529 nm bandpass emission filters (FF01-529/24-25, Semrock, Rochester, NY) prior to photomultiplier tube detection. Fluorescence anisotropy (A) was calculated with KinTek stopped-flow software using the following equation (eq 3):
| (3) |
where Ipar and Iperp are the intensities of parallel and perpendicular polarized emission light during the approach to equilibrium, respectively. Twenty fluorescence anisotropy traces for each h-mtRNAP concentration were averaged to maximize the signal-to-noise ratio. The observed increase in fluorescence anisotropy as a function of time was fit to single-exponential equation (eq 1), yielding an observed rate constant, kobs, for binding. kobs values were plotted as a function of h-mtRNAP concentration and fit to the following linear equation, yielding estimates for kon and koff (eq 4):
| (4) |
where kon is the pseudo-first-order rate constant for h-mtRNAP– scaffold association and koff is the second-order rate constant for dissociation.
Stopped-Flow Nucleotide Incorporation Assays
Stopped-flow pre-steady-state nucleotide incorporation assays were performed using the KinTek stopped-flow apparatus described above. All reactions were conducted at 30 °C. h-mtRNAP was diluted immediately prior to use in EDB. The volume of h-mtRNAP added to any reaction mixture was always equal to one-twentieth of the total reaction volume. We performed reactions by incubating in most cases 0.25 μM h-mtRNAP with 0.2 μM RNA/DNA scaffold having a DNA template with 2-aminopurine (2AP) at the +1 templating position26 in RB at room temperature for 3 min, allowing equilibration to 30 °C, and then rapidly mixing the sample with NTP in a solution containing RB. The excitation wavelength was 313 nm. Fluorescence emission was monitored by using a 370 nm cut-on filter (model E370LP, Chroma Technology Corp., Rockingham, VT). For each experiment, at least four fluorescence traces were averaged. Relative fluorescence was plotted as a function of time and fit to a single-exponential equation (eq 1).
Pulse-Quench/Pulse-Chase-Quench Assays
Product formation in a pulse–quench assay design, similar to that described above for rapid chemical-quench-flow primer extension assays, was compared to product formation in a pulse-chase-quench assay design. All assays were conducted in the KinTek rapid chemical-quench-flow apparatus described above. In pulse-quench assays, 1.5 μM h-mtRNAP was mixed with 1 μM unlabeled RNA/DNA scaffold in RB at room temperature for 3 min to form h-mtRNAP–scaffold complexes, equilibrated to 30 °C, rapidly mixed with 100 μM [α-32P]ATP in a solution containing RB, quenched in 1 N HCl at various time points, and neutralized. In pulse-chase-quench assays, 1.5 μM h-mtRNAP was mixed with 1 μM unlabeled RNA/DNA scaffold in RB at room temperature for 3 min to form complexes, equilibrated to 30 °C, and rapidly mixed with 100 μM [α-32P]ATP in a solution containing RB. After various time intervals, a large excess of unlabeled ATP and MgCl2 (15 mM) was added, reaction mixtures were incubated for 30 s, reactions were then quenched in 1 N HCl, and mixtures were neutralized. For both types of assays, reaction products were analyzed by using Tris-Tricine SDS–PAGE.
Product Analysis via Tris-Tricine SDS–PAGE
An equal volume of loading buffer, 5 μL (70% formamide, 0.025% bromophenol blue, and 0.025% xylene cyanol), was added to 5 μL of the quenched reaction mixtures and 5 μL loaded on a 17.5% Tris-Tricine SDS–polyacrylamide gel. Gels contained 17.5% acrylamide, 0.5% bisacrylamide, 0.7 M Tris-HCl (pH 8.5), 0.07% SDS, and 7% glycerol. The cathode buffer (upper chamber) contained 0.1 M Tris base, 0.1 M Tricine, and 0.1% (w/v) SDS; the anode buffer contained 0.2 M Tris-HCl (pH 8.9). Electrophoresis was performed for 3 h at 80 W. Gels were visualized using a PhosphorImager (GE) and quantified using ImageQuant (GE).
Solvent Deuterium Kinetic Isotope Effect
Experiments were performed essentially as described above for the rapid chemical-quench-flow primer extension assays and stopped-flow nucleotide incorporation assays except enzyme, substrates, and buffers were prepared in 100% D2O. The pD was used instead of pH for solutions in D2O and was adjusted according to the relationship pD = pH + 0.4.27 Deuterated glycerol was used in preparation of EDB.
Pyrophosphorolysis Assays
The h-mtRNAP reverse reaction (pyrophosphorolysis) was performed by using the rapid chemical-quench-flow apparatus. h-mtRNAP (1 μM) was mixed with unlabeled nucleic acid scaffold (0.5 μM) in the presence of 0.45 μM [α-32P]ATP in RB for 5 min to form complexes containing primer RNA elongated by one [α-32P]AMP. This was then rapidly mixed with various concentrations of unlabeled inorganic pyrophosphate (PPi) and 500 μM unlabeled ATP. Reactions were quenched at various time points by addition of 0.3 M EDTA. Products were analyzed using Tris-Tricine SDS–PAGE. The amount of [α-32P]ATP produced by removal of [α-32P]AMP from the 3′-terminus of primer RNA was plotted as a function of time and fit to eq 1, yielding an observed rate constant, kobs, for pyrophosphorolysis. kobs values for different PPi concentrations were plotted and fit to eq 2 (with kpyro replacing kpol) to determine kpyro, the maximal rate constant for h-mtRNAP pyrophosphorolysis, and Kd,app, the apparent dissociation constant for PPi.
Pyrophosphate Exchange Assays
h-mtRNAP pyrophosphate exchange reactions were performed using the rapid chemical-quench-flow apparatus. h-mtRNAP (1 μM) was mixed with unlabeled RNA/DNA scaffold (2.5 μM) in RB for 5 min at room temperature to form complexes. This was then rapidly mixed with 1000 μM PPi and 100 μM [γ-32P]ATP in RB. Reactions were quenched at various time points by addition of 0.3 M EDTA. Products were analyzed using thin layer chromatography. The amount of [γ-32P]PPi produced was plotted as a function of time and fit to a single-exponential equation followed by a line (eq 5):
| (5) |
where A is the amplitude of the exponential phase, kobs is the observed rate constant of the exponential phase, V is the rate of the linear phase, and C is the end point.
Product Analysis via Thin Layer Chromatography
Quenched reaction mixtures were spotted onto polyethyleneimine-cellulose thin layer chromatography (TLC) plates and dried. TLC plates were developed in 1 M LiCl until the solvent front resolved 4 cm from the origin, at which point the buffer was removed and replaced with 1.5 M LiCl, 0.2 M sodium acetate, and 4 M urea. The TLC plate was developed to completion, dried, and exposed to a PhosphorImager screen (GE). Reaction products were quantified using ImageQuant (GE).
Data Analysis
Kinetic data were fit by nonlinear regression using KaleidaGraph (Synergy Software, Reading, PA).
Kinetic Simulation
Kinetic simulations were performed using KinTekSim version 2.03 (KinTek Corp.). All rate constants were determined experimentally, except where noted. The agreement between the experimental data and kinetic simulations was determined by visual inspection.
RESULTS
Active h-mtRNAP Can Be Produced in and Purified from E. coli
The h-mtRNAP gene was expressed in E. coli as a fusion protein with Saccharomyces cerevisiae ubiquitin (Figure 1a). The S. cerevisiae ubiquitin-specific protease was coexpressed, allowing for co- and/or post-translational cleavage of ubiquitin from the fusion protein. Fusion to ubiquitin results in high levels of expression of soluble fusion protein (Figure 1b, lane I). Site-specific cleavage by the ubiquitin protease produces h-mtRNAP with an authentic (postimport) N-terminus. Expression of a ubiquitin–target fusion protein followed by specific intracellular cleavage has been advantageous for other proteins that were problematic because of low expression levels, poor solubility, or difficulty in obtaining a precise N-terminus other than methionine.24,28,29
Figure 1.

Active h-mtRNAP can be purified from E. coli. (a) pET26Ub-h-mtRNAP expression plasmid. This system results in production of a ubiquitin–h-mtRNAP fusion protein that is co- and/or post-translationally processed by a ubiquitin protease that is constitutively expressed from a second plasmid. The ubiquitin–h-mtRNAP gene fusion is shown relative to the T7 RNAP promoter and multiple cloning region (MCR). The last seven amino acid residues of ubiquitin and first four of h-mtRNAP are shown beneath the nucleotide sequence. Locations of restriction sites are indicated and italicized. (b) Expression and purification of h-mtRNAP. Coomassie-stained SDS–PAGE gel (10%) of bacterial cell lysates before induction (UI) and after induction (I) and of the final purified enzymes. Wild-type (WT) h-mtRNAP and a catalytically inactive mutant (D1151A) are shown (5 μg each). (c) Poly(rG)-specific activity assays of purified h-mtRNAP. Reaction mixtures contained poly(dG/dC) (100 μM dGMP/dCMP), GTP (500 μM), [α-32P]GTP (0.2 μCi/μL), and purified h-mtRNAP (50 ng) in a final reaction volume of 50 μL. Reactions were initiated by addition of h-mtRNAP, mixtures incubated for 5 min at 30 °C, and reactions quenched by addition of EDTA (50 mM). The amount of GMP incorporated was determined by the DE81 filter binding method. All reactant concentrations described here and in subsequent figures are final concentrations unless otherwise noted.
A vulnerability of h-mtRNAP during purification from E. coli is proteolytic degradation. An additional problem is a tendency for the protein to bind tightly to nucleic acids, leading to large reductions in yield. The purification protocol was optimized to avoid these difficulties so that a maximal amount h-mtRNAP could be obtained (Figure 1b, lane WT) that is essentially free of contaminating nuclease and phosphatase activities (Figure S1 of the Supporting Information).
Specific activity assays relying on poly(dG/dC) to template incorporation of GMP were utilized to assess the catalytic activity of purified h-mtRNAP (Figure 1c). The specific activity of wild-type (WT) h-mtRNAP was 1900 ± 200 pmol of GMP incorporated min−1 μg−1. To rule out the possibility that nucleotide incorporation activity might be due to the presence of a contaminating nucleic acid polymerase, we produced an h-mtRNAP variant, D1151A, having a catalytically essential active site Asp changed to Ala. The catalytically essential Asp was identified on the basis of amino acid sequence alignments with T7 RNAP (data not shown). Purification of the D1151A variant (Figure 1b) resulted in an h-mtRNAP with essentially no catalytic activity (<5 ± 1 pmol min−1 μg−1) (Figure 1c), confirming that nucleotide incorporation activity in the WT preparation was provided by h-mtRNAP.
h-mtRNAP Uses an RNA-Primed, DNA-Template Scaffold for Nucleotide Incorporation
We sought to develop simple, in vitro RNA elongation assays for analysis of the kinetics of incorporation of nucleotides by h-mtRNAP, without the need for accessory mitochondrial transcription proteins. Because of the evolutionary relatedness between h-mtRNAP and phage T7 RNAP,16,17 a small, synthetic RNA/DNA scaffold known to be efficiently utilized as a primed template for RNA elongation by T7 RNAP30 was chosen for testing with h-mtRNAP. This scaffold consisted of an annealed 12 nt RNA primer and an 18 nt DNA template forming an 8 bp duplex with a 4 nt 5′-RNA overhang and a 10 nt single-stranded DNA with T as the first templating base (Figure 2a).
Figure 2.
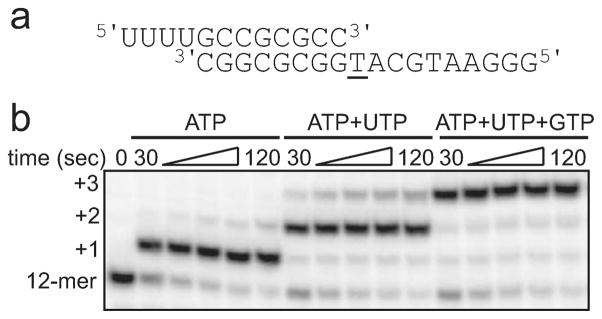
h-mtRNAP uses a synthetic RNA-primed, DNA-template scaffold for RNA elongation. (a) The 8 bp duplex scaffold. This scaffold consisted of a 12 nt RNA annealed to an 18 nt DNA forming a 8 bp duplex region with a 4 nt 5′-RNA overhang and a 10 nt single-stranded DNA template. The first templating base is underlined in this and subsequent scaffold diagrams. (b) Incorporation of single and multiple nucleotides by h-mtRNAP. h-mtRNAP (1 μM) was incubated with an 8 bp scaffold (0.1 μM) and either ATP, ATP, and UTP or ATP, UTP, and GTP (500 μM each) at 30 °C for various amounts of time, and reactions were quenched by addition of EDTA (50 mM). Reaction products containing 32P-labeled RNA shown in this and subsequent figures were resolved by denaturing PAGE and visualized by phosphorimaging unless otherwise noted. The 32P-labeled RNA primer was readily extended to n + 1, n + 2, and n + 3 by h-mtRNAP.
When h-mtRNAP was combined with an 8 bp scaffold and supplied with ATP, nearly all RNA primer was rapidly elongated by one nucleotide (Figure 2b). When h-mtRNAP–scaffold complexes were supplied with ATP and UTP or ATP, UTP, and GTP, the RNA primer was rapidly elongated by two or three nucleotides, respectively (Figure 2b). This demonstrated the catalytic competence of h-mtRNAP–8 bp scaffold complexes.
h-mtRNAP Forms More Stable Complexes with 9 bp Duplex Scaffolds
The establishment of stable h-mtRNAP– nucleic acid scaffold complexes is a desirable property for mechanistic studies of nucleotide incorporation. Therefore, complex stability before nucleotide incorporation was examined with the assay design shown in Figure S2a of the Supporting Information. The amount of product formed reports on the amount of active complex remaining in solution. The rate constant for complex dissociation can be measured by plotting the amount of product formed as a function of time after addition of trap. h-mtRNAP–8 bp scaffold complexes before nucleotide incorporation exhibited low stability, with a kdissoc of ≥0.15 s−1 and a complex half-life of ≤5 s (Figure S2b,c of the Supporting Information). Complex stability after nucleotide incorporation was assessed with the assay design shown in Figure S2d of the Supporting Information. Stability after incorporation was much greater than before, by at least 2 orders of magnitude, with a complex half-life of ~350 s (Figure S2e,f of the Supporting Information).
It was unclear whether a nucleotide incorporation event, the length of the scaffold RNA primer, or the length of the scaffold RNA/DNA duplex was the major determinant for the increased stability of the h-mtRNAP–scaffold complex after nucleotide incorporation. Therefore, h-mtRNAP–scaffold complex stability assays were performed with a scaffold that contained an RNA primer that was longer by one nucleotide at the 3′-terminus relative to the 8 bp scaffold, thus providing a 9 bp duplex (Figure 3a). In addition, h-mtRNAP–scaffold complex stability assays were performed with a scaffold that contained an RNA primer that was longer by one nucleotide at the 5′-terminus, providing 8 bp of duplex (Figure S3a of the Supporting Information). Complex stability with the 9 bp scaffold (Figure 3a) before nucleotide incorporation was investigated with the experimental design shown in Figure 3b. The stability of h-mtRNAP–9 bp scaffold complexes before nucleotide incorporation was high (kdissoc = 0.0014 s−1; half-life = 495 s) (Figure 3c), similar to that with the 8 bp scaffold after nucleotide incorporation (Figure S2e,f of the Supporting Information). Complex stability with the scaffold that contained a 13 nt RNA but only 8 bp of duplex was low (kdissoc ≥ 0.15 s−1; half-life ≤ 5 s) (Figure S3c of the Supporting Information), similar to that with the 12 nt RNA 8 bp scaffold (Figure S2a–c of the Supporting Information).
Figure 3.
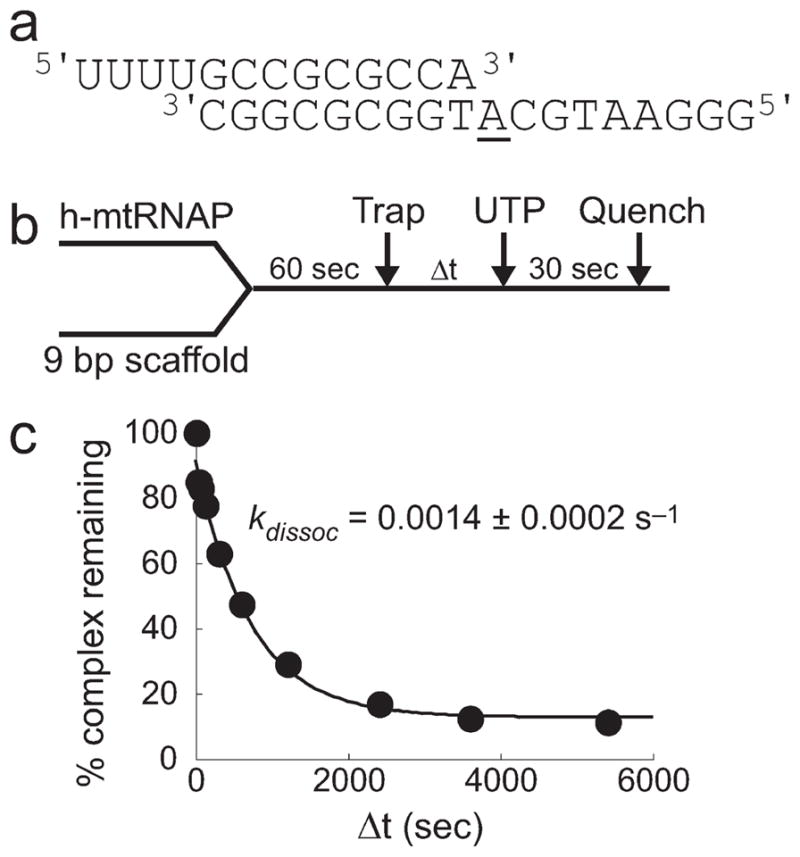
h-mtRNAP–RNA/DNA scaffold complexes require 9 bp of duplex for high complex stability. (a) The 9 bp duplex scaffold. This scaffold consisted of a 13 nt RNA annealed to an 18 nt DNA forming a 9 bp duplex region with a 4 nt 5′-RNA overhang and a 9 nt single-stranded DNA template. (b) Experimental design. h-mtRNAP (1 μM) was incubated with a 9 bp scaffold (0.1 μM) for 60 s. Heparin trap (100 μM) was added. UTP (500 μM) was added after varying amounts of time. Reactions proceeded for 30 s and were quenched by addition of EDTA (50 mM). (c) Kinetics of h-mtRNAP–9 bp RNA/DNA scaffold complexes before nucleotide incorporation. Phosphorimages were quantitated, and the percentage of complex remaining was plotted as a function of time. The data were fit to a single-exponential equation (eq 1), yielding a kdissoc of 0.0014 ± 0.0002 s−1 and a complex half-life of 500 s, approximately 2 orders of magnitude greater than those of h-mtRNAP–8 bp scaffold complexes before nucleotide incorporation and comparable to those of h-mtRNAP–8 bp scaffold complexes after nucleotide incorporation.
In summary, h-mtRNAP can readily utilize 8 bp scaffolds for RNA elongation, but complexes before nucleotide incorporation exhibit low stability. In contrast, h-mtRNAP complexes with 9 bp scaffolds are quite stable before nucleotide incorporation. These data indicate that RNA/DNA duplex length is a major determinant of the stability of h-mtRNAP–nucleic acid scaffold complexes, rather than completion of a nucleotide incorporation event or RNA primer length per se. Despite the stability differences for h-mtRNAP–scaffold complexes, no differences in trypsin cleavage patterns were observed for h-mtRNAP whether it was free in solution, complexed with an 8 or 9 bp scaffold, or complexed with a scaffold after nucleotide incorporation (Figure S4a of the Supporting Information).
h-mtRNAP–9 bp Scaffold Complexes Are Catalytically Competent and Exhibit a Pre-Steady-State Burst of Nucleotide Incorporation
The ability of stable h-mtRNAP–9 bp scaffold complexes to elongate RNA was examined in more detail. Nucleotide incorporation in the presence of heparin trap was assessed (Figure S5a of the Supporting Information). h-mtRNAP was incubated with an excess of 9 bp scaffold for a time sufficient to assemble polymerase–scaffold complexes, followed by addition of heparin trap and the first correct nucleotide. The addition of heparin trap permits only the active h-mtRNAP–scaffold complexes formed initially to produce RNA product. Complexes under these conditions were catalytically competent. This behavior was utilized to titrate h-mtRNAP active sites in preparations of this polymerase. The y-intercepts from linear fits to time courses indicated that at least 60% of h-mtRNAP was catalytically active.
Evaluation of RNA elongation in a chemical-quench-flow apparatus revealed that h-mtRNAP–9 bp scaffold complexes exhibit a pre-steady-state burst of nucleotide incorporation (Figure S5b of the Supporting Information). h-mtRNAP was incubated with an excess of scaffold to assemble complexes, and these were rapidly mixed with nucleotide substrate for various amounts of time and then quenched. The data were fit to a single-exponential equation followed by a linear phase resulting in an observed rate constant for the burst phase (kb) of 10 ± 1 s−1 with an amplitude of 0.08 ± 0.01 μM.
The findings that h-mtRNAP forms stable complexes with 9 bp RNA/DNA scaffolds and that these complexes are competent to rapidly elongate RNA under various assay conditions indicated that this system is suitable for more detailed analysis of the h-mtRNAP single-nucleotide addition cycle.
h-mtRNAP Binds to 9 bp Duplex RNA/DNA Scaffolds via a Two-Step Mechanism
Fluorescein at the 5′-terminus of scaffold DNA permitted fluorescence anisotropy to be used to study the kinetics of binding of h-mtRNAP to the scaffold. Various concentrations of h-mtRNAP were rapidly mixed with fluorescent scaffold in a stopped-flow apparatus. The intensity of polarized fluorescence emission parallel and perpendicular to polarized excitation light was monitored simultaneously in T-format. Fluorescence anisotropy was computed using eq 3. Twenty traces were averaged in each assay to maximize the signal-to-noise ratio, resulting in fluorescence anisotropy time courses such as that shown in Figure 4a. Time courses were fit to a single-exponential equation (eq 1) to yield values for the observed rate constant, kobs, for the change in fluorescence anisotropy as binding of h-mtRNAP to scaffold occurred over time. kobs values from at least three independent assays were averaged for each h-mtRNAP concentration. The average kobs values were plotted as a function of h-mtRNAP concentration and fit to eq 4, yielding estimates of kon and koff (Figure 4b). These experiments indicated that binding of h-mtRNAP to the 9 bp scaffold is likely diffusion-limited (kon ~ 1000 μM−1 s−1).
Figure 4.
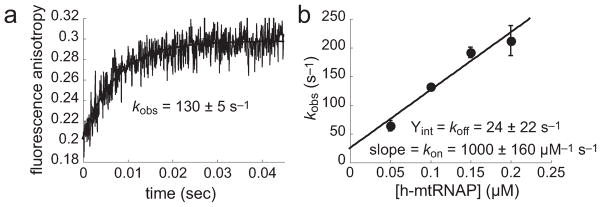
Binding of h-mtRNAP to the 9 bp RNA/DNA scaffold is fast. (a) Fluorescence anisotropy. Binding of h-mtRNAP to the 9 bp RNA/DNA scaffold was examined by observing the change in fluorescence anisotropy as a function of time. The 9 bp scaffold (Figure 3a) (0.1 μM) with 5′-fluorescein-labeled DNA was rapidly mixed in a stopped-flow apparatus with h-mtRNAP (0.05, 0.10, 0.15, or 0.20 μM). The trace shown represents the change in fluorescence anisotropy (eq 3) obtained by averaging 20 individual stopped-flow shots (illustrated are representative data using 0.10 μM h-mtRNAP). The solid line is the fit of data to a single-exponential equation (eq 1), providing an estimate of kobs (130 ± 5 s−1) for the change in fluorescence anisotropy, which reports the change in mass as a function of time. (b) Estimates of kon and koff. kobs values (average of at least three independent experiments for each h-mtRNAP concentration) were plotted as a function of h-mtRNAP concentration and fit to a straight line (eq 4). The slope of the straight line fit provides an estimate of kon (1000 ± 160 μM −1 s−1), and the y-intercept provides an estimate of koff (24 ± 22 s−1). Error bars are standard deviations.
We also used a scaffold containing the fluorescent reporter 2-aminopurine (2AP) in the template as another approach to monitor binding of h-mtRNAP to the 9 bp scaffold. h-mtRNAP was rapidly mixed with 2AP-containing scaffold in a stopped-flow apparatus and changes in fluorescence emission monitored over time (Figure S6a of the Supporting Information). A decrease in 2AP fluorescence emission was observed on a time scale approximately 3 orders of magnitude slower than that for initial binding (Figure S6b,c of the Supporting Information). Fit of these data to a single-exponential equation (eq 1) yielded kobs values of 0.21 and 0.23 ± 0.01 s−1 with 2-fold different scaffold concentrations. The lack of concentration dependence implied the occurrence of a first-order event such as an isomerization after initial binding of the scaffold to h-mtRNAP.
To further investigate the possibility of a slower, first-order event after initial binding and to determine the extent to which such an event contributes to formation of a productive h-mtRNAP–9 bp scaffold complex, we utilized the assay design shown in Figure 5a in a chemical-quench-flow apparatus. In this experiment, two different concentrations of h-mtRNAP were rapidly mixed with scaffold containing 32P-labeled RNA and ATP followed by quenching at various times. AMP incorporation reports on the kinetics of formation of the catalytically competent h-mtRNAP–scaffold complex. The amount of AMP incorporated was plotted as a function of time and fit to a single-exponential equation (eq 1), yielding kobs values (Figure 5b) equivalent to those found in the stopped-flow experiment. As with the stopped-flow 2AP binding assay described above (Figure S6b of the Supporting Information), this chemical-quench-flow assay demonstrated a lack of concentration dependence and is consistent with an isomerization event after initial binding, limiting production of the catalytically competent h-mtRNAP–scaffold complex.
Figure 5.
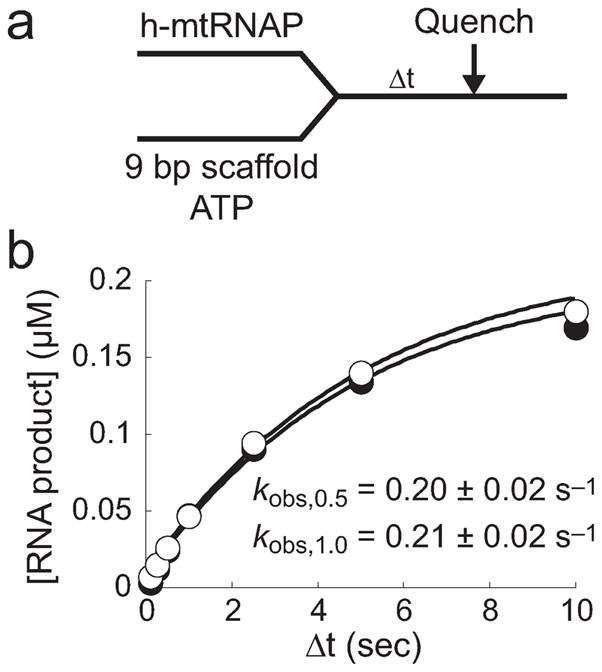
Formation of catalytically competent h-mtRNAP–9 bp RNA/DNA scaffold complexes is slow. (a) Experimental design. h-mtRNAP (0.5 or 1 μM) was rapidly mixed with a 5′-32P-labeled RNA/DNA 9 bp 2AP scaffold (Figure S6a of the Supporting Information) (0.25 μM) and ATP (500 μM) using a chemical-quench-flow process. The reaction was quenched at various times by addition of EDTA (300 mM). (b) Kinetics of formation of catalytically competent complexes. In this assay, binding of h-mtRNAP to the 9 bp 2AP scaffold was reported by single-nucleotide incorporation, a measure of functional complexes. The amount of product formed was plotted as a function of time, and the data were fit to a single-exponential equation (eq 1), yielding kobs values of 0.20 ± 0.02 and 0.21 ± 0.02 s−1 for 0.5 (●) and 1 μM (○) h-mtRNAP assays, respectively. The absence of the dependence of kobs on h-mtRNAP concentration suggests that a slow first-order event occurs after initial binding, before complexes can elongate RNA. The finding that kobs values from these assays were the same as those observed for the change in fluorescence upon interaction of h-mtRNAP with the 9 bp 2AP scaffold from stopped-flow assays (Figure S6 of the Supporting Information) suggests that the latter was also reporting on the slow isomerization leading to formation of an incorporation-competent functional complex.
Results summarized in Figures 4 and 5 and Figure S6 of the Supporting Information suggest that h-mtRNAP binds initially to the 9 bp scaffold very rapidly and this initial binding is followed by a much slower reorganization of this complex for acquisition of catalytic competence.
Estimates of kpol and Kd,app for Single-Nucleotide Incorporation Can Be Determined Equivalently with Radioisotope-Based or Fluorescence-Based Approaches
The 2AP-containing 9 bp scaffold shown in Figure S6a of the Supporting Information was used in nearly all subsequent kinetic assays so that experiments could be conducted in either the chemical-quench-flow (with 5′-32P-labeled scaffold RNA) or stopped-flow (RNA without a radiolabel) instruments. The dependence of the pre-steady-state rate constant for correct nucleotide incorporation on nucleotide substrate concentration was examined for h-mtRNAP using both methods (Figure 6). Observed rate constants for incorporation over a range of nucleotide concentrations were fit to a hyperbolic model (eq 2), yielding estimates of the kinetic parameters kpol, the maximal rate constant for nucleotide incorporation, and Kd,app, the apparent dissociation constant for the nucleotide substrate.
Figure 6.

Measurement of pre-steady-state kinetics of h-mtRNAP correct single-nucleotide incorporation by chemical-quench-flow and stopped-flow methods. (a) Chemical-quench-flow data. h-mtRNAP (0.125 μM) was incubated with 5′-32P-labeled RNA/DNA 9 bp 2AP scaffold (Figure S6a of the Supporting Information) (0.1 μM) for 3 min and then rapidly mixed with ATP (25, 50, 100, 250, or 500 μM) using a chemical-quench-flow method. Reactions were quenched at various times with EDTA (300 mM). The amount of RNA product was plotted as a function of time and fit to a single-exponential equation (eq 1), yielding kobs values of 10 ± 1, 17 ± 3, 23 ± 2, 28 ± 4, and 35 ± 6 s−1 for 25 (●), 50 (○), 100 (■), 250 (□), and 500 μM ATP (▲), respectively. (b) Estimation of kpol and Kd,app from chemical-quench-flow assays. kobs values were plotted as a function of ATP concentration and fit to a hyperbola (eq 2), yielding a kpol of 40 ± 2 s−1 and a Kd,app of 70 ± 10 μM. (c) Stopped-flow fluorescence. Use of the 9 bp scaffold containing 2AP (Figure S6a of the Supporting Information) permitted evaluation of the kinetics of single-nucleotide incorporation by a second method, measurement of fluorescence changes in a stopped flow. h-mtRNAP (0.125 μM) was incubated with 9 bp 2AP scaffold (0.1 μM) for 3 min and then rapidly mixed with ATP (30, 60, 100, 200, 300, or 600 μM) using a stopped-flow method. The observed change in fluorescence emission was measured (traces shown represent an average of approximately five shots) and fit to a single-exponential equation (eq 1), yielding kobs values of 10 ± 1, 16 ± 1, 22 ± 1, 29 ± 1, 33 ± 2, and 36 ± 2 s−1 for 30, 60, 100, 200, 300, and 600 μM ATP, respectively. (d) Estimation of kpol and Kd,app from stopped-flow assays. kobs values were plotted as a function of ATP concentration and fit to a hyperbola (eq 2), yielding a kpol of 40 ± 1 s−1 and a Kd,app of 90 ± 5 μM. The kinetic parameters for single-nucleotide incorporation by chemical-quench-flow and stopped-flow methods are in agreement.
From the chemical-quench-flow experiment (Figure 6a,b), the kpol value was 40 ± 2 s−1 and the Kd,app value for ATP was 70 ± 10 μM. In the stopped-flow experiments (Figure 6c,d), these values were 40 ± 1 s−1 and 90 ± 5 μM, respectively. Therefore, values determined by chemical-quench-flow and stopped-flow methods are in agreement.
A Solvent Deuterium Kinetic Isotope Effect on the Rate Constant for Single-Nucleotide Incorporation Is Observed
To begin to identify the rate-limiting steps for incorporation of nucleotides by h-mtRNAP, we evaluated the reaction for the presence of a solvent deuterium kinetic isotope effect (SDKIE). In the presence of solvent D2O, all exchangeable protons will be replaced with deuterons, including sites on the enzyme and substrate. Isotopic replacement that involves a chemical bond that is broken or formed in the rate-limiting step will lead to a kinetic isotope effect. In polymerase reactions, this includes abstraction of the proton from the 3′-hydroxyl of the terminal nucleotide of the RNA primer to activate the attacking nucleophile. In addition, it has been shown that polymerases make use of an active site amino acid residue that functions as a general acid to protonate the pyrophosphate leaving group.31 Therefore, during polymerase catalysis, two exchangeable protons are transferred in the transition state26 and replacement of protons with deuterons will result in a SDKIE if phosphoryl transfer is rate-limiting. Estimates of kobs for AMP incorporation at near-saturating ATP concentrations were obtained in H2O and in D2O in the chemical-quench-flow experiments (Figure 7a,b). The kobs in H2O was found to be 42 ± 2 s−1, a value consistent with kpol values in Figure 6. The kobs in D2O was 13 ± 1 s−1. Therefore, a first estimate of the SDKIE from chemical-quench-flow assays was 3.2.
Figure 7.

Solvent deuterium kinetic isotope effect (SDKIE) on pre-steady-state h-mtRNAP AMP incorporation. (a and b) Chemical-quench-flow assays in H2O or D2O. h-mtRNAP (0.125 μM) was incubated with 5′-32P-labeled RNA/DNA 9 bp 2AP scaffold (Figure S6a of the Supporting Information) (0.1 μM) for 3 min and then rapidly mixed with a near-saturating concentration of ATP (500 μM) using a chemical-quench-flow method. Reactions were quenched at various times with EDTA (300 mM). The amount of RNA product was plotted as a function of time and fit to a single-exponential equation (eq 1), yielding kobs values of 42 ± 2 s−1 in H2O (a) and 13 ± 1 s−1 in D2O (b). The SDKIE was approximately 3.3. (c) Stopped-flow assays in D2O. h-mtRNAP (0.125 μM) was incubated with 9 bp 2AP scaffold (0.1 μM) for 3 min and then rapidly mixed with ATP (25, 50, 100, 200, and 500 μM) using a stopped-flow method. The observed change in fluorescence emission was measured (each an average of approximately five shots) and fit to a single-exponential equation (eq 1), yielding kobs values of 2 ± 0.1, 4 ± 0.1, 6 ± 0.1, 8 ± 0.1, and 10 ± 0.2 s−1 for 25, 50, 100, 200, and 500 μM ATP, respectively. (d) Estimation of kpol and Kd,app in D2O from stopped-flow assays. kobs values were plotted as a function of ATP concentration and fit to a hyperbola (eq 2), yielding a kpol of 12 ± 1 s−1 and a Kd,app of 100 ± 10 μM. Comparison with the kpol value in H2O (Figure 6d) indicates a SDKIE of approximately 3.3. A SDKIE on Kd,app was not observed. Estimates of the SDKIE on the rate constant for single-nucleotide incorporation from chemical-quench-flow and stopped-flow assays are in agreement.
Because data summarized in Figure 6 validated the use of the stopped-flow assay to determine h-mtRNAP nucleotide incorporation kinetic parameters, the stopped-flow assay was used to determine kpol and Kd,app for incorporation of AMP in D2O (Figure 7c,d). These values were 12 ± 1 s−1 and 100 ± 10 μM, respectively. This kpol value is consistent with the kobs value shown in Figure 7b from the chemical-quench-flow assay. Comparing these values in D2O to those summarized in Figure 6 in H2O indicates a SDKIE of 3.3 on kpol. This finding of a substantial SDKIE on kpol suggests that chemistry is at least partially rate-limiting for the h-mtRNAP nucleotide incorporation reaction. A SDKIE was not observed on Kd,app.
More Nucleotide Incorporation Is Observed in Pulse-Chase-Quench Assays Than in Pulse-Quench Assays
To further identify rate-limiting steps for nucleotide incorporation, we performed pulse-chase-quench and pulse-quench experiments for correct nucleotide incorporation using the chemical-quench-flow apparatus. The purpose of this experimental comparison was to seek evidence of the existence of an isomerized ternary complex prior to the chemistry step. The experiment evaluates the kinetics of incorporation of an α-32P-labeled nucleotide into an unlabeled nucleic acid scaffold. The experimental design is depicted in Figure 8a. Reactants are mixed, and at various times after mixing, reactions are either quenched (pulse-quench) or chased (pulse-chase-quench) with an excess of unlabeled nucleotide for a time sufficient for incorporation of any trapped, labeled nucleotide to proceed to product and then quenched. The key underlying principle is that the chase portion of the pulse-chase-quench assay permits completion of product formation by ternary complexes that are otherwise not observed (destroyed) by the quench in a pulse-quench assay. h-mtRNAP–9 bp scaffold complexes were either rapidly mixed with 100 μM [α-32P]ATP and quenched at various time points (pulse-quench) or mixed with 100 μM [α-32P]ATP, chased after various periods of time with a large excess of unlabeled ATP and MgCl2 (both at 15 mM), incubated for 30 s, and then quenched (pulse-chase-quench) (Figure 8a). A representative phosphorimage of a Tris-Tricine SDS–PAGE gel used to separate products from a pulse-chase-quench reaction is shown in Figure 8b. Reaction products were quantitated and these values plotted as a function of time (Figure 8c). Solid lines, added to help visualize differences in product formation over time, are fits to a single-exponential model (eq 1). The amplitude of product formation in pulse-chase-quench reactions was approximately 30% larger than with the pulse-quench assay design. More product formation under pulse-chase-quench conditions reveals the presence of an isomerized ternary complex and the occurrence of a kinetically significant conformational rearrangement immediately prior to chemistry.32 The larger end point amplitude further reveals the presence of a conformational rearrangement that functions as a “kinetic roadblock” after chemistry.32,33 These findings along with the SDKIE on nucleotide incorporation (Figure 7) indicate that chemistry is bracketed before and after by conformational rearrangements and that the three steps are co-rate-limiting for nucleotide incorporation.
Figure 8.

Larger pool of ternary complexes captured in pulse-chase-quench assays than in pulse-quench assays. (a) Experimental design. For pulse-quench assays, h-mtRNAP (1.5 μM) was incubated with 9 bp 2AP scaffold (Figure S6a of the Supporting Information) (1 μM) for 60 s and then rapidly mixed with [α-32P]ATP (100 μM) using a chemical-quench-flow assay. Reactions were quenched at various times with HCl (1 N) and immediately neutralized to pH 7. For pulse-chase-quench assays, h-mtRNAP (1.5 μM) was incubated with 9 bp 2AP scaffold (1 μM) for 60 s, rapidly mixed with [α-32P]ATP (100 μM), and chased after various periods of time with unlabeled ATP and MgCl2 (15 mM each) using a chemical-quench-flow assay. Chased reactions were allowed to proceed for an additional 30 s, quenched with HCl (1 N), and immediately neutralized to pH 7. (b) Tris-Tricine SDS–PAGE of the pulse-chase-quench assay. Reaction products were resolved by Tris-Tricine SDS–PAGE and visualized by phosphorimaging. A representative gel from a pulse-chase-quench assay is shown. (c) Larger amplitude under pulse-chase-quench conditions. Quantitated 14-mer RNA product was plotted as a function of time revealing capture of a larger pool of ternary complexes in pulse-chase-quench assays.
Rates of Successive Nucleotide Additions Are Not Substantially Limited by the Rates of Intervening Events
An experiment that aimed to qualitatively assess the cumulative rate of events intervening between successive nucleotide incorporations by h-mtRNAP in a different sequence context is summarized in Figure S7 of the Supporting Information. In this assay, the first two correct nucleotides (UTP and GTP) were supplied to h-mtRNAP–scaffold complexes (using the 9 bp scaffold shown in Figure 3a) by rapid mixing in the chemical-quench-flow assay, followed by quenching at various time points. The gel image in Figure S7b of the Supporting Information illustrates the increase in the level of RNA extended by one nucleotide early in the time course followed by a decrease in the level of this RNA as it gives rise to RNA extended by two nucleotides later in the reaction. Concentrations of RNA products were plotted as a function of time (Figure S7c of the Supporting Information). The solid lines are from simulation of two sequential nucleotide incorporations assuming successive rate constants of 17.5 and 12.5 s−1. The simulation accounts well for the kinetics of RNA elongation reported above (Figure 6). This result suggests the qualitative conclusion that sequence context and events after nucleotide incorporation, such as translocation, do not substantially alter the kinetics of nucleotide addition.
The h-mtRNAP Reverse Reaction is Rate-Limited by a Conformational Change
The kinetic parameters for the h-mtRNAP reverse reaction, pyrophosphorolysis, were estimated in chemical-quench-flow assays with the experimental design summarized in Figure 9a. h-mtRNAP was incubated with 9 bp scaffold and a stoichiometric amount of [α-32P]ATP for 5 min to allow production of h-mtRNAP–scaffold product complexes. These were then rapidly mixed with PPi and unlabeled ATP. The presence of unlabeled ATP prevents the reaction from reaching a premature equilibrium resulting from reincorporation of liberated [α-32P]ATP. Reactions were quenched at various times by addition of EDTA. Reaction products were resolved by Tris-Tricine SDS–PAGE and visualized by phosphorimaging (Figure 9b). The amount of [α-32P]ATP product released by pyrophosphorolysis was plotted as a function of time. Shown in Figure 9c are representative data for a reaction mixture containing 1000 μM PPi. The solid line is the fit of data to a single-exponential equation (eq 1), yielding an observed rate constant, kobs, for pyrophosphorolysis of 1.5 ± 0.2 s−1. kobs values were determined over a range of PPi concentrations. The kobs values were plotted as a function of PPi concentration and fit to a hyperbola (eq 2, with kpyro in place of kpol) (Figure 9d), which provided estimates for kpyro, the maximal rate constant for pyrophosphorolysis, of 2.5 ± 0.2 s−1 and Kd,app, the apparent dissociation constant for PPi, of 710 ± 160 μM.
Figure 9.

Characterization of h-mtRNAP-catalyzed pyrophosphorolysis. (a) Experimental design. h-mtRNAP (1 μM) was incubated with 9 bp 2AP scaffold (Figure S6a of the Supporting Information) (0.5 μM) and [α-32P]ATP (0.45 μM) for 5 min and then rapidly mixed with NaPPi (50–3000 μM) and unlabeled ATP (500 μM) using a chemical-quench-flow assay. Reactions were quenched at various times with EDTA (300 mM). (b) Tris-Tricine SDS–PAGE of pyrophosphorolysis reaction products. Reaction products were resolved by Tris-Tricine SDS–PAGE and visualized by phosphorimaging. (c) Kinetics of h-mtRNAP-catalyzed pyrophosphorolysis. The amount of [α-32P]ATP product was plotted as a function of time and fit to a single-exponential equation (eq 1), yielding a kobs of 1.5 ± 0.2 s−1 for a representative reaction mixture containing 1000 μM PPi. (d) Estimation of the kinetic parameters kpyro and Kd,app. kobs values were plotted as a function of PPi concentration and fit to a hyperbola (eq 2), yielding a kpyro of 2.5 ± 0.2 s−1 and a Kd,app of 700 ± 150 μM. (e) Lack of observable SDKIE on h-mtRNAP-catalyzed pyrophosphorolysis. The kinetics of single-turnover pyrophosphorolysis with 1000 μM PPi were determined in D2O. The amount of [α-32P]ATP product was plotted as a function of time and fit to a single-exponential equation (eq 1), yielding a kobs 1.2 ± 0.2 s−1 in D2O. This value is essentially indistinguishable from the kobs value in H2O shown above in panel c, indicating the absence of an observable SDKIE on the h-mtRNAP-catalyzed pyrophosphorolysis reaction.
An observed rate constant for pyrophosphorolysis in D2O was obtained at a high PPi concentration (1000 μM) to allow examination for a SDKIE on the h-mtRNAP reverse reaction (Figure 9e). Data were collected exactly as in the assay shown in Figure 9c except in D2O. Comparison of the observed rate constants for pyrophosphorolysis in H2O (1.5 ± 0.2 s−1) and D2O (1.2 ± 0.2 s−1) shows no difference within experimental error. A SDKIE on the rate constant for pyrophosphorolysis was therefore not observed, suggesting that chemistry is not rate-limiting in the h-mtRNAP reverse reaction. This implies the existence of a slow conformational change step before chemistry in the reverse direction (after chemistry in the forward direction), a finding consistent with conclusions from pulse-chase-quench and pulse-quench assays (Figure 8).
A pyrophosphate exchange assay with the experimental design illustrated in Figure 10a was utilized to gain additional insight into events in the reverse reaction pathway. This assay can be used to identify the complex from which PPi dissociates, because the product complex is formed in the presence of PPi.34,35 h-mtRNAP was incubated with 9 bp scaffold to form stable h-mtRNAP–scaffold complexes, and these were rapidly mixed with unlabeled PPi and [γ-32P]ATP. Reactions were quenched at various times by addition of EDTA. The reaction product, [γ-32P]PPi, was resolved from [γ-32P]ATP by thin-layer chromatography and visualized by phosphorimaging (Figure 10b). The amount of [γ-32P]PPi product was plotted as a function of time (Figure 10c). The solid line is the fit of data to a single-exponential equation followed by a line (eq 5). A burst of [γ-32P]PPi product was produced with the amplitude and rate constant reporting on the concentration of h-mtRNAP–scaffold complexes formed in the reaction initially and the observed rate constant for nucleotide incorporation, respectively. The rate constant of the slower, linear phase of [γ-32P]PPi production is similar to the observed rate constant for pyrophosphorolysis (Figure 9). This indicates that the reverse reaction must traverse a slow, rate-limiting step during each cycle of AMP incorporation and PPi release, with PPi dissociating from a complex that has undergone a conformational change after forward reaction chemistry. This finding combined with the absence of a detectable SDKIE on pyrophosphorolysis (Figure 9) leads again to the conclusion that a conformational-change step exists before chemistry in the reverse direction that is rate-limiting for h-mtRNAP pyrophosphorolysis.
Figure 10.

Pyrophosphate exchange suggests that a slow conformational change must be traversed in the h-mtRNAP pyrophosphorolysis reaction. (a) Experimental design. h-mtRNAP (1 μM) was incubated with 9 bp 2AP scaffold (Figure S6a of the Supporting Information) (2.5 μM) for 60 s and then rapidly mixed with [γ-32P]ATP (100 μM) and PPi (1000 μM) using a chemical-quench-flow method. Reactions were quenched at various times with EDTA (300 mM). (b) Thin-layer chromatography of pyrophosphate exchange reaction products. Pro-duct, [γ-32P]PPi, was resolved from substrate, [γ-32P]ATP, by thin-layer chromatography and visualized by phosphorimaging. (c) Burst followed by slow linear production of [γ-32P]PPi. The amount of [γ-32P]PPi product was plotted as a function of time and fit to a single-exponential equation followed by a line (eq 5), yielding a rate constant for the burst phase (kb) of 16 ± 3 s−1 and an amplitude of 0.68 ± 0.06 μM. The steady-state rate constant (kss) was 1.1 ± 0.1 s−1, calculated by dividing the slope (rate) of the linear phase, 0.83 ± 0.01 μM s−1, by the burst amplitude. The linear production of [γ-32P]PPi after the initial burst indicates that pyrophosphorolysis must traverse a rate-limiting step during each cycle of AMP incorporation and PPi release in this assay. The lack of a SDKIE on pyrophosphorolysis (Figure 9) suggests that a conformational change is rate-limiting.
h-mtRNAP Exercises More Stringent Surveillance over the Correct Base Than over the Correct Sugar during Nucleotide Selection
Values of kpol and Kd,app were obtained for h-mtRNAP misincorporation of a nucleotide with an incorrect base (GTP) (Figure 11a,b) or an incorrect sugar (2′-dATP) (Figure 11c,d) with templating base T. The kinetic parameters for GMP misincorporation were 0.04 ± 0.002 s−1 and 2000 ± 200 μM (kpol and Kd,app, respectively). These values are 1000-fold lower than the kpol value and 20-fold greater than the Kd,app value for correct AMP incorporation. The specificity constant, kpol/Kd,app, for correct AMP incorporation is 0.4 μM−1 s−1, and that for GMP misincorporation is 0.00002 μM−1 s−1, suggesting a GMP misincorporation frequency of approximately 1 in 20000 under saturating nucleotide conditions. The kinetic parameters for 2′-dAMP incorporation were 0.07 ± 0.007 s−1 and 200 ± 40 μM (kpol and Kd,app, respectively), yielding a specificity constant of 0.0004 μM−1 s−1 and suggesting an error frequency for 2′-dAMP misincorporation of approximately 1 in 1000, again under saturating nucleotide conditions. Therefore, h-mtRNAP appears to exercise more stringent surveillance over the base of the incoming nucleotide than over the sugar.
Figure 11.

Pre-steady-state kinetics of incorrect nucleotide incorporation by h-mtRNAP. (a) GMP misincorporation. h-mtRNAP (0.5 μM) was incubated with 5′-32P-labeled RNA/DNA 9 bp 2AP scaffold (Figure S6a of the Supporting Information) (0.1 μM) for 3 min and then rapidly mixed with GTP (250, 500, 1000, 2500, or 5000 μM) using a chemical-quench-flow assay. Reactions were quenched at various times with EDTA (300 mM). The amount of RNA product was plotted as a function of time and fit to a single-exponential equation (eq 1), yielding kobs values of 0.0047 ± 0.0005, 0.0081 ± 0.0002, 0.012 ± 0.004, 0.023 ± 0.002, and 0.026 ± 0.002 s−1 for 250 (●), 500 (○), 1000 (■), 2500 (□), and 5000 μM GTP (▲), respectively. (b) kpol and Kd,app for GMP misincorporation. kobs values were plotted as a function of GTP concentration and fit to a hyperbola (eq 2), yielding a kpol of 0.040 ± 0.002 s−1 and a Kd,app of 2000 ± 200 μM. (c) 2′-dAMP misincorporation. h-mtRNAP (0.25 μM) was incubated with 9 bp 2AP scaffold (0.125 μM) for 3 min and then rapidly mixed with 2′-dATP (50, 100, 250, or 500 μM) using a stopped-flow assay. The observed change in fluorescence emission was measured and fit to a single-exponential equation (eq 1), yielding kobs values of 0.016 ± 0.002, 0.027 ± 0.004, 0.048 ± 0.004, and 0.051 ± 0.005 s−1 for 50, 100, 250, and 500 μM 2′-dATP, respectively. (d) kpol and Kd,app for 2′-dAMP misincorporation. kobs values were plotted as a function of 2′-dATP concentration and fit to a hyperbola (eq 2), yielding a kpol of 0.070 ± 0.007 s−1 and a Kd,app of 200 ± 40 μM.
h-mtRNAP–8 bp and –9 bp Scaffold Complexes Exhibit Similar Kinetics for Single-Nucleotide Incorporation
Nine-base pair scaffolds were used throughout this study to examine the binding and catalytic behavior of h-mtRNAP because binary complexes with these scaffolds were very stable. However, robust use of the 8 bp scaffold for RNA elongation (Figure 2) motivated assessment of the kinetic parameters kpol and Kd,app for single-nucleotide incorporation for correct ATP, incorrect base GTP, and incorrect sugar 2′-dATP substrates. These data are summarized in Figure S8 of the Supporting Information. Corresponding data for the 9 bp scaffold are shown in Figure 6 (ATP) and Figure 11 (GTP and 2′-dATP). On the basis of comparison of specificity constants, kpol/Kd,app, the kinetics of nucleotide incorporation differed by 3-fold for correct ATP (0.4 μM−1 s−1 for the 9 bp scaffold and 1.5 μM−1 s−1 for the 8 bp scaffold) and were essentially identical for the two scaffolds for GTP and 2′-dATP misincorporation. This finding leads to the conclusion that the 8 bp scaffold is also suitable for evaluation of the kinetics of nucleotide incorporation by h-mtRNAP.
The Kinetic Mechanism for h-mtRNAP Single-Nucleotide Addition Consists of Eight Steps
Experimental data described above identified eight steps in the kinetic mechanism for single-nucleotide addition by h-mtRNAP using the 9 bp RNA/DNA scaffold (Scheme 1). Step 1 is initial-encounter binding of h-mtRNAP to scaffold. Step 2 is a subsequent, slower isomerization, leading to a catalytically competent binary complex. Step 3 is binding of the nucleotide to form ternary complexes. Step 4 is a conformational rearrangement of this complex before chemistry. Step 5 is chemistry. Step 6 is a conformational rearrangement of the product complex. Step 7 is PPi release. Step 8 is dissociation of h-mtRNAP from the scaffold having the RNA primer elongated by one nucleotide. The eight-step mechanism was simulated via a computer using experimentally determined kinetic values as constraints, which allowed limits to be placed on kinetic parameters that could not be directly measured empirically. Experimentally determined kinetic data used as constraints in simulations included the forward and reverse rate constants for steps 1 and 2 (Figures 3–5 and Figure S6 of the Supporting Information), kpol and Kd,app values for AMP incorporation (Figure 6), the SDKIE on nucleotide incorporation of 3.3 (Figure 7), 70:30 partitioning of product in pulse-chase-quench versus pulse-quench assays (Figure 8), the kobs value for the second of two sequential nucleotide incorporations (Figure S7 of the Supporting Information), kpyro and Kd,app values for pyrophosphorolysis (Figure 9), and the SDKIE of ~1 for pyrophosphorolysis (Figure 9). The forward rate constant for step 3 and the reverse rate constant for step 7 were assumed to be 10 μM−1 s−1. Simulation of the eight-step mechanism with this constraining information placed limits on values for the rate constants for step 4, the prechemistry conformational rearrangement, within 2-fold of values shown in Scheme 1, and for step 5, chemistry, within 10-fold, without significantly affecting the goodness of fit of the simulation of the mechanism to experimental data. Simulation of the entire mechanism with the kinetic values shown in Scheme 1 recapitulates all of the experimental data described in this report.
Scheme 1. Kinetic Mechanism for Single-Nucleotide Incorporation by h-mtRNAPa.
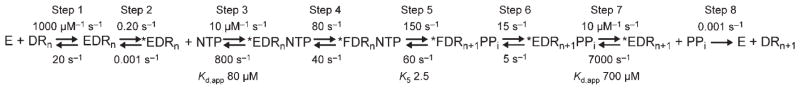
a We propose the following kinetic mechanism for the single-nucleotide-addition cycle of h-mtRNAP (E) on the 9 bp duplex primed template (DRn). Primed template binds to h-mtRNAP (step 1). This complex (EDRn) isomerizes (step 2) into a stable, catalytically competent conformation (*EDRn). Nucleotide (NTP) binds (step 3) to form a ternary complex (*EDRnNTP). This complex undergoes a conformational change (step 4) to form a complex (*FDRnNTP) that is competent for nucleotidyl transfer. Catalysis occurs (step 5), producing a ternary product complex (*FDRn+1PPi); this complex undergoes a second conformational change (step 6) to form a ternary product complex (*EDRn+1PPi) from which PPi can dissociate (step 7). After dissociation of PPi, a h-mtRNAP–RNA/DNA product complex (*EDRn+1) that is competent for the next cycle of nucleotide incorporation remains. Recycling of h-mtRNAP is therefore limited by dissociation (step 8) from the product complex (DRn+1). This mechanism and the corresponding kinetic constants are sufficient to account for all of the data presented here.
DISCUSSION
Here we describe a kinetic mechanism for the h-mtRNAP single-nucleotide-addition cycle. Elucidation of this mechanism was made possible by development of methods for purification of large quantities of active h-mtRNAP and for quantitative in vitro assessment of h-mtRNAP promoter-independent nucleotide addition. Obtaining a detailed understanding of the kinetics of h-mtRNAP nucleotide incorporation was motivated by the desire to establish a baseline of kinetic information about the wild-type polymerase so that the biochemical performance of mutant forms can be evaluated in vitro, leading to insight into questions of interest about the biological functions of h-mtRNAP.
Successful purification of large amounts of active h-mtRNAP expressed in E. coli (Figure 1 and Figure S1 of the Supporting Information) relies on avoidance of several potential pitfalls. h-mtRNAP has a strong tendency to form insoluble aggregates in bacterial cells. Most of the soluble fraction of the polymerase binds irreversibly to nucleic acids if standard procedures for purification of nucleic acid polymerases are utilized during and immediately after cell lysis. h-mtRNAP is susceptible to proteolytic degradation and requires the presence of protease inhibitors throughout the purification procedure. Contaminating DNases and RNases will copurify with h-mtRNAP if specific measures are not taken to avoid this in the late stages of purification. The methods described here overcome these difficulties. In addition, we recently showed that h-mtRNAP expressed and purified with this approach accomplishes in vitro mitochondrial promoter-dependent transcription with the help of transcription accessory proteins, demonstrating biochemically relevant activity.36
h-mtRNAP readily uses small, synthetic RNA/DNA scaffolds as substrates for nucleotide addition. These scaffolds were shown to be utilized by T7 RNAP for promoter-independent RNA elongation.30 Our reasoning for testing T7 RNAP scaffolds with h-mtRNAP was based on the evolutionary relatedness between these single-subunit DdRps.16,17 Complexes between h-mtRNAP and 8 bp duplex scaffolds exhibited low stability, whereas complexes with 9 bp duplex scaffolds were approximately 100-fold more stable (Figure 3). McAllister and co-workers observed that T7 RNAP prefers scaffolds with 8 bp of RNA/DNA duplex and that this duplex length corresponds to the size of the transcription bubble for that polymerase.30 Whether 9 bp of RNA/DNA duplex relates to the size of the h-mtRNAP transcription bubble is unknown but will be of interest in future investigations.
Formation of stable h-mtRNAP–RNA/DNA scaffold complexes and subsequent RNA elongation when they are supplied with a nucleotide substrate do not require help from mitochondrial transcription accessory proteins. This permitted the kinetic mechanism for the h-mtRNAP single-nucleotide-addition cycle to be evaluated under simple in vitro conditions, leading to the mechanism shown in Scheme 1.
h-mtRNAP binds to RNA/DNA scaffolds by a two-step mechanism, with a very fast initial-encounter step (Figure 4 and Scheme 1, step 1) followed by a second step that is 3 orders of magnitude slower (Figure 5, Figure S6 of the Supporting Information, and Scheme 1, step 2) and that culminates with complexes that are catalytically competent. The fact that the kinetics of activation are first-order suggests the possibility of conformational isomerization following initial binding (Scheme 1, step 2). However, a change in the pattern of cleavage in limited trypsin digests for h-mtRNAP whether free in solution or bound to a scaffold in the presence or absence of a nucleotide substrate was not observed (Figure S4 of the Supporting Information). In contrast, large conformational rearrangements are well-documented for T7 RNAP in the transition from initiation to elongation state, and these can be revealed by trypsin digestion (refs 30 and 37 and Figure S4 of the Supporting Information). The lack of changes in the trypsin digest pattern in h-mtRNAP does not necessarily mean that conformational differences do not exist before and after binding. This may reflect the fact that sites cleaved by trypsin are the same in uncomplexed and complexed h-mtRNAP. Sequence alignments demonstrated that the conformation-discriminating trypsin cleavage sites in T7 RNAP are not present in h-mtRNAP (data not shown). Therefore, insight into the nature of conformational rearrangements in h-mtRNAP as it binds to the nucleic acid and accomplishes nucleotide incorporation awaits further experimental inquiry.
Formation of stable h-mtRNAP–RNA/DNA scaffold complexes permitted evaluation of the pre-steady-state kinetics of h-mtRNAP nucleotide incorporation. Equivalent values for kpol, the maximal rate constant for nucleotide addition, and Kd,app, the apparent dissociation constant for ATP, were determined in radioisotope-based assays in a chemical-quench-flow apparatus and in 2-aminopurine fluorescence-based assays in a stopped-flow apparatus (Figure 6). This validates the stopped-flow assay for use in kinetic measurements of h-mtRNAP nucleotide incorporation and is consistent with recent reports by Castro et al.26,31 and Patel and co-workers38 that stopped-flow fluorescence assays can be used to measure the nucleotide incorporation kinetics of DdRps. The values estimated for kpol and Kd,app are similar in magnitude, within approximately 5-fold, to those reported for a range of DdRps and RdRps.34,39–41 In addition, it has been noted that the specificity constant, kpol/Kd,app, usually tends toward unity for RNA polymerases.34,39 The value determined for h-mtRNAP, 0.4 μM−1 s−1, is consistent with that broad finding.
An important functional requirement of h-mtRNAP is that it possesses sufficient processivity to fulfill one of its tasks of producing near-full-genome-length transcripts. Simple estimations that take into account the maximal rate constant for single-nucleotide incorporation, the binary complex half-life, the apparent dissociation constant for nucleotide, reported mitochondrial NTP concentrations,42,43 and a mitochondrial genome size of 16.6 kb suggest that h-mtRNAP, by itself, lacks the necessary processivity to have the majority of RNAs produced be 16 kb in length. Interestingly, a recent report by Minczuk et al. identified a protein, termed transcription elongation factor of mitochondria (TEFM), that interacts with h-mtRNAP, influences the production of promoter-distal mitochondrial transcripts, and stimulates the production of longer RNAs by h-mtRNAP in vitro.44 It will be interesting to examine the influence of TEFM on h-mtRNAP kinetic parameters, fidelity, and processivity in assays of the design described in this report, as these will permit evaluation of the influence of this factor on individual mechanistic steps.
The h-mtRNAP single-nucleotide incorporation reaction exhibited a solvent deuterium kinetic isotope effect (SDKIE) of approximately 3.3 (Figure 7), indicating that chemistry is at least partially rate-limiting. The pulse-chase-quench and pulse-quench assays summarized in Figure 8 reveal that co-rate-limiting conformational changes exist both before and after chemistry. The chase of the pulse-chase-quench assay provides time for ternary complexes that are present prior to chemistry to complete product formation.32 If there was not a kinetically significant conformational rearrangement before chemistry, product formation as a function of time observed in pulse-chase-quench and pulse-quench assays would be the same. The finding that the end point of product formation is higher in pulse-chase-quench than in pulse-quench assays is made possible by a (co)-rate-limiting conformational rearrangement immediately after chemistry that causes product formed during the chase to accumulate.32 Similar phenomena were observed in the kinetic mechanism for the Klenow fragment of DNA polymerase I,32 and Sulfolobus solfataricus P2 DNA polymerase B1.33 Conversely, a very fast, non-rate-limiting step immediately after chemistry would prevent accumulation of product during the chase because product would be removed as quickly as it formed. This would render a postchemistry conformational step, if one existed, kinetically invisible. An area of long-standing debate in nucleic acid polymerase enzymology has surrounded which steps are rate-limiting and can therefore serve as fidelity checkpoints, during nucleotide addition.45–48 Observation of a significant SDKIE and identification of kinetically significant pre- and postchemistry conformational rearrangements for h-mtRNAP suggest that chemistry and the conformational changes that bracket it may participate in correct nucleotide incorporation surveillance (see also below with regard to nucleotide incorporation with the incorrect base or sugar).
Evaluation of the reverse reaction, pyrophosphorolysis (Figure 9), yielded estimates for kpyro, the maximal rate constant for pyrophosphorolysis, of 2.5 ± 0.2 s−1 and Kd,app, the apparent dissociation constant for PPi, of 710 ± 160 μM. The value for the specificity constant (kpyro/Kd,app) for h-mtRNAP correct-nucleotide pyrophosphorolysis, 0.004 μM−1 s−1, is within 1 order of magnitude of the values reported for most other nucleic acid polymerases where measured.32,35,39,49 A long-standing question has involved whether nucleic acid polymerases that lack dedicated error-correction domains utilize pyrophosphorolysis to remove a misincorporated nucleotide. This is of particular interest in the case of h-mtRNAP because production of defective transcripts may directly impact energy metabolism, but resolution of this question awaits further study.
The h-mtRNAP pyrophosphorolysis reaction did not exhibit a SDKIE (Figure 9), indicating that chemistry is not rate-limiting in the reverse reaction and suggesting the presence of a rate-limiting conformational-change step in the reverse reaction pathway. Additional evidence of this rate-limiting conformational-change step was provided by pyrophosphate exchange assays (Figure 10), which suggested that PPi dissociated from a complex that had undergone a conformational change in the forward direction (Scheme 1, steps 6 and 7).
h-mtRNAP exhibited approximately 100-fold more stringent surveillance for the correct base than for the correct sugar when selecting a nucleotide for incorporation, based on comparison of specificity constants (kpol/Kd,app) for the misincorporation events we examined (Figure 11). Stronger selection against an incorrect base than an incorrect sugar has been observed for other RNA polymerases.34,50–53 The finding for h-mtRNAP of an only 2-fold increase in Kd,app but a 500-fold decrease in kpol for incorporation of a nucleotide with an incorrect sugar (2′-dAMP templated by T) suggests that little selection against incorrect sugar occurs during ground-state binding, the main determinant of Kd,app, and rather that the majority of selection against an incorrect sugar occurs in steps that comprise kpol, primarily the conformational-change steps that bracket chemistry and chemistry itself. In contrast, the finding that Kd,app was increased 20-fold and kpol was decreased 1000-fold for h-mtRNAP incorporation of a nucleotide with an incorrect base (GMP templated by T) suggests that both Kd,app and kpol events are used to discriminate against an incorrect base. The ability of h-mtRNAP to use ground-state binding for selection against incorrect bases suggests that binding is not solely determined by the triphosphate moiety of the incoming nucleotide, in contrast to what has been found for some other polymerases, most notably viral RdRps, which have a distinct conserved motif F that is used to recognize the triphosphate moiety of the incoming nucleotide.54–56 Further studies will be needed to elucidate the precise mechanism for h-mtRNAP nucleotide incorporation fidelity.
Experiments described in this report define the eight-step minimal kinetic mechanism for h-mtRNAP single-nucleotide addition shown in Scheme 1. Simulation of this mechanism with the kinetic values indicated is consistent with all of the experimental outcomes described in this report. The mechanism is similar in principle to those proposed for numerous nucleic acid polymerases, although the kinetic importance of individual steps varies in different systems.32–35,39,57
The utility of the methods described here and of the estimates of parameters for the minimal kinetic mechanism for nucleotide incorporation is that they will permit hypotheses about the biological roles of h-mtRNAP to begin to be evaluated, particularly with regard to mutant forms of h-mtRNAP. An extensive literature exists indicating a role in various disease states for the mitochondrial DNA replicating polymerase, Pol γ.8,58–60 Single-nucleotide polymorphisms (SNPs) exist in the Pol γ coding sequence,8,58–60 and some of these modulate Pol γ catalytic function61–64 and/or are linked to specific human pathologies.8,58–60 In addition, Pol γ has been demonstrated to be an off target for antiviral nucleoside analogues administered to patients testing positive for the human immunodeficiency virus.65–67 The sensitivity of human health to Pol γ functional integrity argues for the need to understand the biological roles of h-mtRNAP, for which investigations of this nature are almost completely lacking.
The work described here is of practical importance for several reasons. Efficient methods for obtaining large quantities of h-mtRNAP purified to homogeneity have been established. This has allowed the development of quantitative in vitro assays for the biochemical behavior of h-mtRNAP. Adaptation of T7 RNAP RNA/DNA scaffolds to h-mtRNAP promoter-independent assays for nucleotide incorporation and baseline mechanistic data obtained from such assays now make feasible high-resolution, high-throughput kinetic examination of h-mtRNAP under a variety of experimental conditions. Quantitative characterization of the binding and reaction kinetics of h-mtRNAP nucleotide incorporation in a minimal in vitro assay system provides a baseline of information for understanding the contributions of the mitochondrial transcription accessory proteins to RNA synthesis. It also permits evaluation of the biochemical performance of mutant forms of h-mtRNAP that are present in the human population and that may be linked to disease states. Finally, it is now possible to test the hypothesis that h-mtRNAP is an accidental and unwanted target for synthetic nucleoside analogues that cause host morbidity when used as therapeutic agents. The methodological advances and mechanistic data described in this report will help to allow investigations into the biochemical and biological roles of h-mtRNAP function in human health and disease.
Supplementary Material
Acknowledgments
Funding Sources
This work was supported in part by the Berg Endowment of the Eberly College of Science.
We thank members of our laboratory for comments on the manuscript.
ABBREVIATIONS
- h-mtRNAP
human mitochondrial RNA polymerase
- RNAP
RNA polymerase
- mt
mitochondrial
- ATD
amino-terminal domain
- PEI
polyethyleneimine
- nt
nucleotide
Footnotes
Supporting Information. Table S1 and Figures S1–S8. This material is available free of charge via the Internet at http://pubs.acs.org.
References
- 1.Wallace DC. A mitochondrial paradigm of metabolic and degenerative diseases, aging, and cancer: A dawn for evolutionary medicine. Annu Rev Genet. 2005;39:359–407. doi: 10.1146/annurev.genet.39.110304.095751. [DOI] [PMC free article] [PubMed] [Google Scholar]
- 2.Wallace DC. Mitochondria as chi. Genetics. 2008;179:727–735. doi: 10.1534/genetics.104.91769. [DOI] [PMC free article] [PubMed] [Google Scholar]
- 3.Wallace DC, Fan W. The pathophysiology of mitochondrial disease as modeled in the mouse. Genes Dev. 2009;23:1714–1736. doi: 10.1101/gad.1784909. [DOI] [PMC free article] [PubMed] [Google Scholar]
- 4.Brandon M, Baldi P, Wallace DC. Mitochondrial mutations in cancer. Oncogene. 2006;25:4647–4662. doi: 10.1038/sj.onc.1209607. [DOI] [PubMed] [Google Scholar]
- 5.Chomyn A, Attardi G. MtDNA mutations in aging and apoptosis. Biochem Biophys Res Commun. 2003;304:519–529. doi: 10.1016/s0006-291x(03)00625-9. [DOI] [PubMed] [Google Scholar]
- 6.Di Donato S. Multisystem manifestations of mitochondrial disorders. J Neurol. 2009;256:693–710. doi: 10.1007/s00415-009-5028-3. [DOI] [PubMed] [Google Scholar]
- 7.Lee J, Boo JH, Ryu H. The failure of mitochondria leads to neurodegeneration: Do mitochondria need a jump start? Adv Drug Delivery Rev. 2009;61:1316–1323. doi: 10.1016/j.addr.2009.07.016. [DOI] [PMC free article] [PubMed] [Google Scholar]
- 8.Longley MJ, Graziewicz MA, Bienstock RJ, Copeland WC. Consequences of mutations in human DNA polymerase γ. Gene. 2005;354:125–131. doi: 10.1016/j.gene.2005.03.029. [DOI] [PubMed] [Google Scholar]
- 9.Montoya J, Lopez-Perez MJ, Ruiz-Pesini E. Mitochondrial DNA transcription and diseases: Past, present and future. Biochim Biophys Acta. 2006;1757:1179–1189. doi: 10.1016/j.bbabio.2006.03.023. [DOI] [PubMed] [Google Scholar]
- 10.Shadel GS. Coupling the mitochondrial transcription machinery to human disease. Trends Genet. 2004;20:513–519. doi: 10.1016/j.tig.2004.08.005. [DOI] [PubMed] [Google Scholar]
- 11.Shadel GS. Expression and maintenance of mitochondrial DNA: New insights into human disease pathology. Am J Pathol. 2008;172:1445–1456. doi: 10.2353/ajpath.2008.071163. [DOI] [PMC free article] [PubMed] [Google Scholar]
- 12.Bonawitz ND, Clayton DA, Shadel GS. Initiation and beyond: Multiple functions of the human mitochondrial transcription machinery. Mol Cell. 2006;24:813–825. doi: 10.1016/j.molcel.2006.11.024. [DOI] [PubMed] [Google Scholar]
- 13.Falkenberg M, Larsson NG, Gustafsson CM. DNA replication and transcription in mammalian mitochondria. Annu Rev Biochem. 2007;76:679–699. doi: 10.1146/annurev.biochem.76.060305.152028. [DOI] [PubMed] [Google Scholar]
- 14.Scheffler IE. Mitochondria. Vol. 2. John Wiley & Sons, Inc; New York: 2008. [Google Scholar]
- 15.Fuste JM, Wanrooij S, Jemt E, Granycome CE, Cluett TJ, Shi Y, Atanassova N, Holt IJ, Gustafsson CM, Falkenberg M. Mitochondrial RNA polymerase is needed for activation of the origin of light-strand DNA replication. Mol Cell. 2010;37:67–78. doi: 10.1016/j.molcel.2009.12.021. [DOI] [PubMed] [Google Scholar]
- 16.Masters BS, Stohl LL, Clayton DA. Yeast mitochondrial RNA polymerase is homologous to those encoded by bacteriophages T3 and T7. Cell. 1987;51:89–99. doi: 10.1016/0092-8674(87)90013-4. [DOI] [PubMed] [Google Scholar]
- 17.Shutt TE, Gray MW. Bacteriophage origins of mitochondrial replication and transcription proteins. Trends Genet. 2006;22:90–95. doi: 10.1016/j.tig.2005.11.007. [DOI] [PubMed] [Google Scholar]
- 18.Sousa R, Mukherjee S. T7 RNA Polymerase. In: Moldave K, editor. Progress in Nucleic Acid Research and Molecular Biology. Academic Press; London: 2003. [DOI] [PubMed] [Google Scholar]
- 19.Steitz TA. Visualizing polynucleotide polymerase machines at work. EMBO J. 2006;25:3458–3468. doi: 10.1038/sj.emboj.7601211. [DOI] [PMC free article] [PubMed] [Google Scholar]
- 20.Dairaghi DJ, Shadel GS, Clayton DA. Addition of a 29 residue carboxyl-terminal tail converts a simple HMG box-containing protein into a transcriptional activator. J Mol Biol. 1995;249:11–28. doi: 10.1006/jmbi.1995.9889. [DOI] [PubMed] [Google Scholar]
- 21.Gaspari M, Falkenberg M, Larsson NG, Gustafsson CM. The mitochondrial RNA polymerase contributes critically to promoter specificity in mammalian cells. EMBO J. 2004;23:4606–4614. doi: 10.1038/sj.emboj.7600465. [DOI] [PMC free article] [PubMed] [Google Scholar]
- 22.Walberg MW, Clayton DA. In vitro transcription of human mitochondrial DNA. Identification of specific light strand transcripts from the displacement loop region. J Biol Chem. 1983;258:1268–1275. [PubMed] [Google Scholar]
- 23.Nam SC, Kang C. Expression of cloned cDNA for the human mitochondrial RNA polymerase in Escherichia coli and purification. Protein Expression Purif. 2001;21:485–491. doi: 10.1006/prep.2000.1383. [DOI] [PubMed] [Google Scholar]
- 24.Gohara DW, Ha CS, Kumar S, Ghosh B, Arnold JJ, Wisniewski TJ, Cameron CE. Production of “authentic” poliovirus RNA-dependent RNA polymerase (3D(pol)) by ubiquitin-protease-mediated cleavage in Escherichia coli. Protein Expression Purif. 1999;17:128–138. doi: 10.1006/prep.1999.1100. [DOI] [PubMed] [Google Scholar]
- 25.Arnold JJ, Cameron CE. Poliovirus RNA-dependent RNA polymerase (3D(pol)). Assembly of stable, elongation-competent complexes by using a symmetrical primer-template substrate (sym/sub) J Biol Chem. 2000;275:5329–5336. doi: 10.1074/jbc.275.8.5329. [DOI] [PubMed] [Google Scholar]
- 26.Castro C, Smidansky E, Maksimchuk KR, Arnold JJ, Korneeva VS, Gotte M, Konigsberg W, Cameron CE. Two proton transfers in the transition state for nucleotidyl transfer catalyzed by RNA- and DNA-dependent RNA and DNA polymerases. Proc Natl Acad Sci USA. 2007;104:4267–4272. doi: 10.1073/pnas.0608952104. [DOI] [PMC free article] [PubMed] [Google Scholar]
- 27.Glasoe PK, Long FA. Use of Glass Electrodes to Measure Acidities in Deuterium Oxide. J Phys Chem. 1960;64:188–190. [Google Scholar]
- 28.Huang L, Sineva EV, Hargittai MR, Sharma SD, Suthar M, Raney KD, Cameron CE. Purification and characterization of hepatitis C virus non-structural protein 5A expressed in Escherichia coli. Protein Expression Purif. 2004;37:144–153. doi: 10.1016/j.pep.2004.05.005. [DOI] [PubMed] [Google Scholar]
- 29.te Velthuis AJ, Arnold JJ, Cameron CE, van den Worm SH, Snijder EJ. The RNA polymerase activity of SARS-coronavirus nsp12 is primer dependent. Nucleic Acids Res. 2010;38:203–214. doi: 10.1093/nar/gkp904. [DOI] [PMC free article] [PubMed] [Google Scholar]
- 30.Temiakov D, Anikin M, McAllister WT. Characterization of T7 RNA polymerase transcription complexes assembled on nucleic acid scaffolds. J Biol Chem. 2002;277:47035–47043. doi: 10.1074/jbc.M208923200. [DOI] [PubMed] [Google Scholar]
- 31.Castro C, Smidansky ED, Arnold JJ, Maksimchuk KR, Moustafa I, Uchida A, Gotte M, Konigsberg W, Cameron CE. Nucleic acid polymerases use a general acid for nucleotidyl transfer. Nat Struct Mol Biol. 2009;16:212–218. doi: 10.1038/nsmb.1540. [DOI] [PMC free article] [PubMed] [Google Scholar]
- 32.Dahlberg ME, Benkovic SJ. Kinetic mechanism of DNA polymerase I (Klenow fragment): Identification of a second conformational change and evaluation of the internal equilibrium constant. Biochemistry. 1991;30:4835–4843. doi: 10.1021/bi00234a002. [DOI] [PubMed] [Google Scholar]
- 33.Brown JA, Suo Z. Elucidating the kinetic mechanism of DNA polymerization catalyzed by Sulfolobus solfataricus P2 DNA polymerase B1. Biochemistry. 2009;48:7502–7511. doi: 10.1021/bi9005336. [DOI] [PubMed] [Google Scholar]
- 34.Arnold JJ, Cameron CE. Poliovirus RNA-dependent RNA polymerase (3Dpol): Pre-steady-state kinetic analysis of ribonucleotide incorporation in the presence of Mg2+ Biochemistry. 2004;43:5126–5137. doi: 10.1021/bi035212y. [DOI] [PMC free article] [PubMed] [Google Scholar]
- 35.Patel SS, Wong I, Johnson KA. Pre-steady-state kinetic analysis of processive DNA replication including complete characterization of an exonuclease-deficient mutant. Biochemistry. 1991;30:511–525. doi: 10.1021/bi00216a029. [DOI] [PubMed] [Google Scholar]
- 36.Lodeiro MF, Uchida AU, Arnold JJ, Reynolds SL, Moustafa IM, Cameron CE. Identification of multiple rate-limiting steps during the human mitochondrial transcription cycle in vitro. J Biol Chem. 2010;285:16387–16402. doi: 10.1074/jbc.M109.092676. [DOI] [PMC free article] [PubMed] [Google Scholar]
- 37.Sousa R, Patra D, Lafer EM. Model for the mechanism of bacteriophage T7 RNAP transcription initiation and termination. J Mol Biol. 1992;224:319–334. doi: 10.1016/0022-2836(92)90997-x. [DOI] [PubMed] [Google Scholar]
- 38.Tang GQ, Anand VS, Patel SS. Fluorescence-based assay to measure the real-time kinetics of nucleotide incorporation during transcription elongation. J Mol Biol. 2010;405:666–678. doi: 10.1016/j.jmb.2010.10.020. [DOI] [PMC free article] [PubMed] [Google Scholar]
- 39.Anand VS, Patel SS. Transient state kinetics of transcription elongation by T7 RNA polymerase. J Biol Chem. 2006;281:35677–35685. doi: 10.1074/jbc.M608180200. [DOI] [PubMed] [Google Scholar]
- 40.Foster JE, Holmes SF, Erie DA. Allosteric binding of nucleoside triphosphates to RNA polymerase regulates transcription elongation. Cell. 2001;106:243–252. doi: 10.1016/s0092-8674(01)00420-2. [DOI] [PubMed] [Google Scholar]
- 41.Nedialkov YA, Gong XQ, Hovde SL, Yamaguchi Y, Handa H, Geiger JH, Yan H, Burton ZF. NTP-driven translocation by human RNA polymerase II. J Biol Chem. 2003;278:18303–18312. doi: 10.1074/jbc.M301103200. [DOI] [PubMed] [Google Scholar]
- 42.Lindhurst MJ, Fiermonte G, Song S, Struys E, De Leonardis F, Schwartzberg PL, Chen A, Castegna A, Verhoeven N, Mathews CK, Palmieri F, Biesecker LG. Knockout of Slc25a19 causes mitochondrial thiamine pyrophosphate depletion, embryonic lethality, CNS malformations, and anemia. Proc Natl Acad Sci USA. 2006;103:15927–15932. doi: 10.1073/pnas.0607661103. [DOI] [PMC free article] [PubMed] [Google Scholar]
- 43.Mathews CK. Personal communication. 2011.
- 44.Minczuk M, He J, Duch AM, Ettema TJ, Chlebowski A, Dzionek K, Nijtmans LG, Huynen MA, Holt IJ. TEFM (c17orf42) is necessary for transcription of human mtDNA. Nucleic Acids Res. 2011 doi: 10.1093/nar/gkq1224. [DOI] [PMC free article] [PubMed] [Google Scholar]
- 45.Johnson KA. Role of induced fit in enzyme specificity: A molecular forward/reverse switch. J Biol Chem. 2008;283:26297–26301. doi: 10.1074/jbc.R800034200. [DOI] [PMC free article] [PubMed] [Google Scholar]
- 46.Joyce CM, Benkovic SJ. DNA polymerase fidelity: Kinetics, structure, and checkpoints. Biochemistry. 2004;43:14317–14324. doi: 10.1021/bi048422z. [DOI] [PubMed] [Google Scholar]
- 47.Showalter AK, Tsai MD. A reexamination of the nucleotide incorporation fidelity of DNA polymerases. Biochemistry. 2002;41:10571–10576. doi: 10.1021/bi026021i. [DOI] [PubMed] [Google Scholar]
- 48.Tsai YC, Johnson KA. A new paradigm for DNA polymerase specificity. Biochemistry. 2006;45:9675–9687. doi: 10.1021/bi060993z. [DOI] [PMC free article] [PubMed] [Google Scholar]
- 49.Hsieh JC, Zinnen S, Modrich P. Kinetic mechanism of the DNA-dependent DNA polymerase activity of human immunodeficiency virus reverse transcriptase. J Biol Chem. 1993;268:24607–24613. [PubMed] [Google Scholar]
- 50.Gohara DW, Arnold JJ, Cameron CE. Poliovirus RNA-dependent RNA polymerase (3Dpol): Kinetic, thermodynamic, and structural analysis of ribonucleotide selection. Biochemistry. 2004;43:5149–5158. doi: 10.1021/bi035429s. [DOI] [PMC free article] [PubMed] [Google Scholar]
- 51.Huang Y, Eckstein F, Padilla R, Sousa R. Mechanism of ribose 2′-group discrimination by an RNA polymerase. Biochemistry. 1997;36:8231–8242. doi: 10.1021/bi962674l. [DOI] [PubMed] [Google Scholar]
- 52.Sydow JF, Cramer P. RNA polymerase fidelity and transcriptional proofreading. Curr Opin Struct Biol. 2009;19:732–739. doi: 10.1016/j.sbi.2009.10.009. [DOI] [PubMed] [Google Scholar]
- 53.Yuzenkova Y, Bochkareva A, Tadigotla VR, Roghanian M, Zorov S, Severinov K, Zenkin N. Stepwise mechanism for transcription fidelity. BMC Biol. 2010;8:54. doi: 10.1186/1741-7007-8-54. [DOI] [PMC free article] [PubMed] [Google Scholar]
- 54.Castro C, Arnold JJ, Cameron CE. Incorporation fidelity of the viral RNA-dependent RNA polymerase: A kinetic, thermodynamic and structural perspective. Virus Res. 2005;107:141–149. doi: 10.1016/j.virusres.2004.11.004. [DOI] [PMC free article] [PubMed] [Google Scholar]
- 55.Ng KK, Arnold JJ, Cameron CE. Structure-function relationships among RNA-dependent RNA polymerases. Curr Top Microbiol Immunol. 2008;320:137–156. doi: 10.1007/978-3-540-75157-1_7. [DOI] [PMC free article] [PubMed] [Google Scholar]
- 56.Smidansky ED, Arnold JJ, Cameron CE. Nucleic acid polymerase fidelity and population fitness. In: Domingo E, Parrish CR, Holland JJ, editors. Origin and Evolution of Viruses. Academic Press; London: 2008. [Google Scholar]
- 57.Kati WM, Johnson KA, Jerva LF, Anderson KS. Mechanism and fidelity of HIV reverse transcriptase. J Biol Chem. 1992;267:25988–25997. [PubMed] [Google Scholar]
- 58.Copeland WC. Inherited mitochondrial diseases of DNA replication. Annu Rev Med. 2008;59:131–146. doi: 10.1146/annurev.med.59.053006.104646. [DOI] [PMC free article] [PubMed] [Google Scholar]
- 59.Chan SS, Copeland WC. DNA polymerase γ and mitochondrial disease: Understanding the consequence of POLG mutations. Biochim Biophys Acta. 2009;1787:312–319. doi: 10.1016/j.bbabio.2008.10.007. [DOI] [PMC free article] [PubMed] [Google Scholar]
- 60.Stumpf JD, Copeland WC. Mitochondrial DNA replication and disease: Insights from DNA polymerase γ mutations. Cell Mol Life Sci. 2011;68:219–233. doi: 10.1007/s00018-010-0530-4. [DOI] [PMC free article] [PubMed] [Google Scholar]
- 61.Ponamarev MV, Longley MJ, Nguyen D, Kunkel TA, Copeland WC. Active site mutation in DNA polymerase γ associated with progressive external ophthalmoplegia causes error-prone DNA synthesis. J Biol Chem. 2002;277:15225–15228. doi: 10.1074/jbc.C200100200. [DOI] [PubMed] [Google Scholar]
- 62.Graziewicz MA, Longley MJ, Bienstock RJ, Zeviani M, Copeland WC. Structure-function defects of human mitochondrial DNA polymerase in autosomal dominant progressive external ophthalmoplegia. Nat Struct Mol Biol. 2004;11:770–776. doi: 10.1038/nsmb805. [DOI] [PubMed] [Google Scholar]
- 63.Chan SS, Longley MJ, Copeland WC. The common A467T mutation in the human mitochondrial DNA polymerase (POLG) compromises catalytic efficiency and interaction with the accessory subunit. J Biol Chem. 2005;280:31341–31346. doi: 10.1074/jbc.M506762200. [DOI] [PubMed] [Google Scholar]
- 64.Kasiviswanathan R, Longley MJ, Chan SS, Copeland WC. Disease mutations in the human mitochondrial DNA polymerase thumb subdomain impart severe defects in mitochondrial DNA replication. J Biol Chem. 2009;284:19501–19510. doi: 10.1074/jbc.M109.011940. [DOI] [PMC free article] [PubMed] [Google Scholar]
- 65.Feng JY, Johnson AA, Johnson KA, Anderson KS. Insights into the molecular mechanism of mitochondrial toxicity by AIDS drugs. J Biol Chem. 2001;276:23832–23837. doi: 10.1074/jbc.M101156200. [DOI] [PubMed] [Google Scholar]
- 66.Johnson AA, Ray AS, Hanes J, Suo Z, Colacino JM, Anderson KS, Johnson KA. Toxicity of antiviral nucleoside analogs and the human mitochondrial DNA polymerase. J Biol Chem. 2001;276:40847–40857. doi: 10.1074/jbc.M106743200. [DOI] [PubMed] [Google Scholar]
- 67.Lewis W, Day BJ, Copeland WC. Mitochondrial toxicity of NRTI antiviral drugs: An integrated cellular perspective. Nat Rev Drug Discovery. 2003;2:812–822. doi: 10.1038/nrd1201. [DOI] [PubMed] [Google Scholar]
Associated Data
This section collects any data citations, data availability statements, or supplementary materials included in this article.