Abstract
The objectives of this study were to develop an image-based surgical planning framework that 1) allows for in-depth analysis of pre-operative hemodynamics by the use of cardiac magnetic resonance and 2) enables surgeons to determine the optimum surgical scenarios before the operation. This framework is tailored for applications in which post-operative hemodynamics are important. In particular, it is exemplified here for a Fontan patient with severe left pulmonary arteriovenous malformations due to abnormal hepatic flow distribution to the lungs. Patients first undergo cardiac magnetic resonance for 3-dimensional anatomy and flow reconstruction. After analysis of the pre-operative flow fields, the 3-dimensional anatomy is imported into an interactive surgical planning interface for the surgeon to virtually perform multiple surgical scenarios. Associated hemodynamics are predicted by the use of a fully validated computational fluid dynamic solver. Finally, efficiency metrics (e.g., pressure decrease and hepatic flow distribution) are weighted against surgical feasibility to determine the optimal surgical option.
Keywords: Fontan, single ventricle congenital heart defects, phase-contrast cardiac magnetic resonance, computational fluid dynamics
The introduction of the palliative Fontan procedure was an important step in improving the survival of children born with cyanotic singleventricle congenital heart defects. Over the years this procedure has evolved and in current practice most children undergo a multistage palliative procedure ultimately leading to the total cavopulmonary connection (TCPC), where the superior vena cava and the inferior vena cava (IVC) are directly connected to the pulmonary arteries. Despite marked improvements in overall survival, the development of unilateral pulmonary arteriovenous malformations (PAVMS) after completion of the Fontan circulation has been widely reported (1). The primary consequence of PAVMS is increasing cyanosis and decreased oxygen saturation.
Although the underlying mechanism leading to PAVMS is unknown, studies have shown that liver-derived factors present in the hepatic venous blood prevent their formation (1). Therefore, any abnormalities in hepatic flow distribution (HFD) in a TCPC could potentially lead to PAVMS. In addition, the intrapulmonary shunts lead to a decrease in pulmonary vascular resistance, which tends to direct more flow to the diseased lung, creating a positive feedback loop of increasing cyanosis. Once the oxygen saturation decreases below a certain level, the only palliative option is to reoperate and reorient the TCPC such that a better HFD is achieved (1).
One single-ventricle subgroup that is especially at risk for PAVMs is children who have an interrupted IVC with an azygous vein continuation (i.e., Kawashima procedure) (1). In such cases, the azygous vein tends to carry a majority of the IVC flow, whereas the hepatic flow is directed to the pulmonary system via an extracardiac or lateral tunnel. Although several palliative options have been discussed in the literature, there is no “exact” geometric solution for a specific patient when PAVMs develop. The inherent challenges associated with visualizing HFD preoperatively based on geometry alone make it difficult to identify the option that will distribute hepatic flow “equally” to both lungs.
The 2 objectives for the case study described in this article are as follows: 1) to propose new methodologies for noninvasively quantifying HFD with cardiac magnetic resonance (CMR); and 2) to determine the optimal TCPC reorientation that will result in equal distribution of the hepatic flow to both the lungs. These objectives are based on the hypotheses that decreased hepatic flow perfusion to the lungs causes PAVMs, whereas improving the hepatic flow distribution results in PAVM regression, both of which are strongly supported by earlier clinical studies (1). New approaches are presented to accomplish the 2 aforementioned objectives using phase-contrast cardiac magnetic resonance (PC CMR) and computational fluid dynamics (CFD).
Step-by-Step Methodology
The pillars of the proposed CMR-based diagnosis and surgical planning framework include the following: 1) CMR acquisition; 2) volume rendering of the in vivo anatomy and flow; 3) virtual surgery; 4) CFD modeling; and 5) quantification of HFD and/or other clinically relevant parameters as a feedback to the surgeon. For the clarity of our subsequent descriptions, methods and protocols are exposed in their clinical context, taking the example of a Fontan patient suffering from severe hypoxemia.
Patient characteristics
All parameters and results included in this study pertain to a 4-year-old female Fontan patient who presented to the Children’s Hospital of Philadelphia with an oxygen saturation of 72% in the ascending aorta. The patient had complex heterotaxy syndrome, single-ventricle, dextrocardia, total anomalous pulmonary venous connection to the right atrium, and an interrupted IVC with azygous vein continuation. She had undergone a Kawashima procedure during stage 2, followed by an extracardiac connection of the hepatic vein during stage 3. Dye injection X-ray angiography revealed the formation of severe left lung PAVMs, responsible for the observed hypoxemia.
The CMR protocol
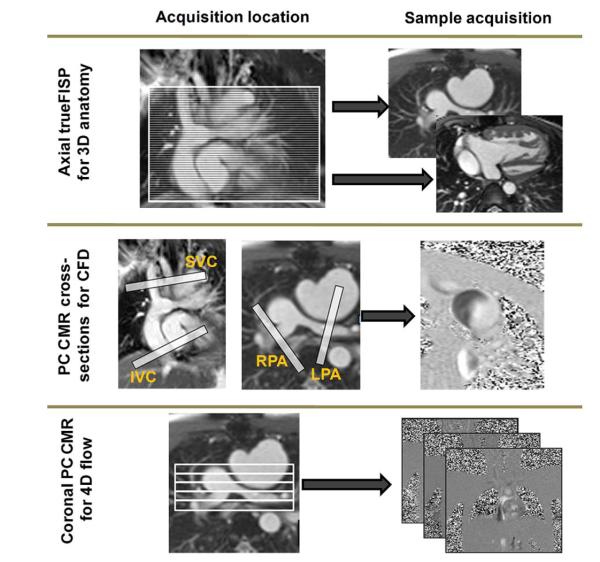
Three sets of images are required for the pre-operative diagnosis and surgical planning operation (see Fig. 1 and Table 1 for typical acquisition settings): 1) a full volume dataset of the entire thorax to reconstruct the TCPC geometry; 2) retrospectively gated, through-plane phase-encoded velocity maps at the vessel cross-sections of the superior vena cava, IVC, left pulmonary artery (LPA), right pulmonary artery (RPA), and the azygous vein for CFD boundary conditions; and 3) a stack of retrospectively gated 3-dimensional (3D) PC CMR slices in an off-axis coronal view for reconstructing the entire blood flow field within the TCPC.
Figure 1. CMR Protocol.
Cardiac magnetic resonance (CMR) protocol for reconstructing 3-dimensional (3D) anatomic and flows. 4D = 4-dimensional; CFD = computational fluid dynamics; FISP = fast imaging with steady-state precession; IVC = inferior vena cava; LPA = left pulmonary artery; PC CMR = phase-contrast cardiac magnetic resonance; RPA = right pulmonary artery; SVC = superior vena cava.
Table 1.
CMR Acquisition Parameters in a Siemens (New York, New York) 1.5-T Avanto Scanner
| Imaging Purpose | Acquisition Type | TR/TE (ms/ms) |
No. of Slices |
Pixel Sizes (mm) |
No. of Phases |
Slice Thickness (mm) |
|---|---|---|---|---|---|---|
| 3D anatomy reconstruction | Stack of static true-FISP in the axial direction | 174/1.22 | 45 | 0.9 | 1 | 3 |
| CFD boundary conditions | PC CMR cross sections | 57.5/3.93 | 5 | 1.4063 | 22 | 5 |
| 3D flow reconstruction | Stack of PC CMR in the coronal direction | 66.45/4.68 | 11 | 1.1979 | 22 | 5 |
3D = 3-dimensional; CFD = computational fluid dynamics; CMR = cardiac magnetic resonance; FISP = fast imaging with steady-state precession; PC CMR = phase-contrast cardiac magnetic resonance; TE = echo time; TR = repetition time.
3D rendering of pre-operative anatomy and flow
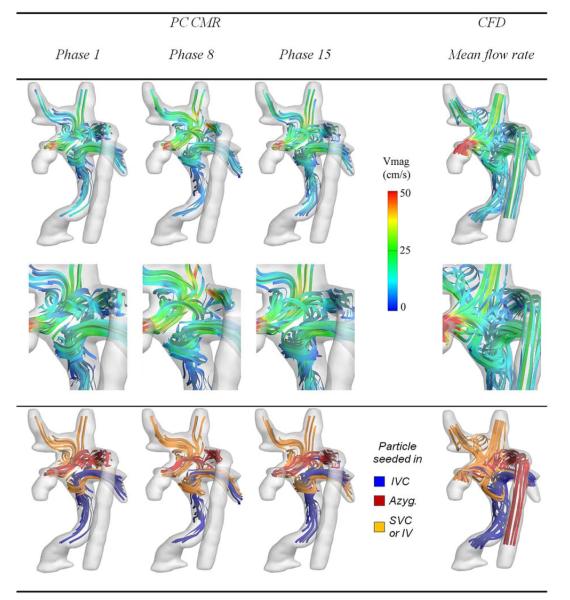
A 3D model of the patient anatomy is generated by the use of a methodology previously developed and validated in our laboratory (Fig. 2) (2). Four-dimensional (3D space + time) velocity fields are reconstructed inside the TCPC from the PC CMRs by the use of a novel divergence-free interpolation technique. The reconstructed 3D flow fields (Fig. 3) then make it possible to evaluate the pre-operative HFD, identify the lung susceptible to PAVMs, and guide possible reoperation scenarios.
Figure 2. 3-Dimensional Anatomic Reconstruction Process.
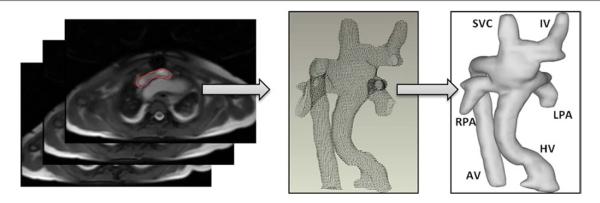
The 3-dimensional anatomic reconstruction process is as follows: 1) The TCPC is segmented in each slice; 2) the segmented contours are imported into Geomagic Studio 9.0 (Geomagic Inc., Research Triangle Park, North Carolina) in a point cloud format; and 3) a smooth surface is fitted to the points. AV = azygous vein; HV = hepatic vein; IV = inominate vein; TCPC = total cavopulmonary connection; other abbreviations as in Figure 1.
Figure 3. Pre-Operative Hemodynamics Evaluated With the Use of CMR and CFD.
Comparison of the pre-operative hemodynamics obtained in vivo by the use of PC CMR and simulated using CFD (Online Videos 1 and 2). Abbreviations as in Figures 1 and 2.
Here, a highly uneven HFD is evident with 93 ± 3% of hepatic flow going towards the right lung. Closer examination of the flow structures reveals that, because of lower velocities and associated kinetic energy, the hepatic flow cannot sustain the flow competition at the center of the connection and is forced by the azygous flow into the RPA. Possible options may thus seek to either increase the amount of venous return through the IVC or avoid the head-on flow collision at the center.
Virtual surgery
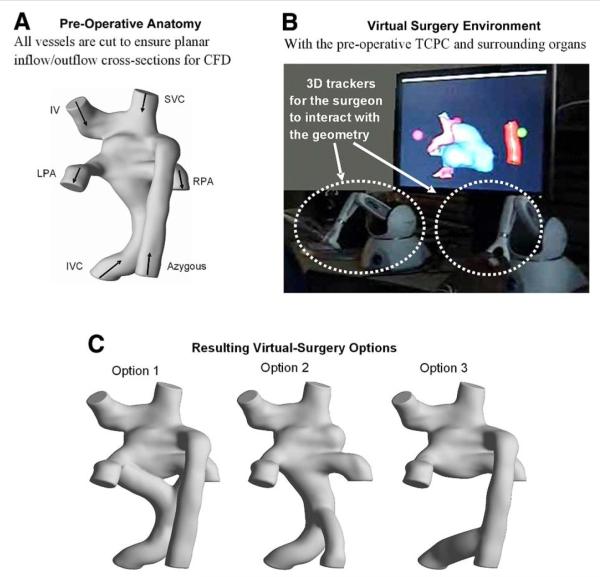
To perform virtual TCPC surgery with ease, geometrical morphing concepts were applied to develop a robust virtual-surgery interface that would allow surgeons to manipulate a computer-representation of the patient’s anatomy (3). Performance of a virtual surgery within that interface is illustrated in Figure 4, taking the 3D reconstruction of the failing TCPC geometry and yielding 3 different options for surgical palliation. The TCPC and direct surrounding organs (including the heart and great vessels) are included within the interface for the surgeon to visualize his/her true degree of freedom.
Figure 4. Steps for the Virtual Surgery and Subsequent CFD Studies.
Shown are the steps involved in virtual surgery and 3-dimensional geometric reconstruction of different surgical scenarios. (A) Pre-operative anatomy; (B) virtual surgery environment; and (C) resulting visual surgery options. Abbreviations as in Figures 1 and 2.
Flow modeling
The CFD simulations are conducted on all envisioned options to investigate the associated HFD, energy losses, and/or any other surrogate measures of clinical performance. These simulations are conducted using an in-house unstructured, sharp-interface immersed-boundary method (4). Inflow/outflow boundary conditions are prescribed using the mean flow rates and flow splits computed from PC CMR. The accuracy of our CFD solver was established against in vitro experiments, and the validity of our modeling assumptions is demonstrated here by simulating the pre-operative flow fields and comparing them to the in vivo PC CMR data (Fig. 3).
Assessment of the surgical planning options
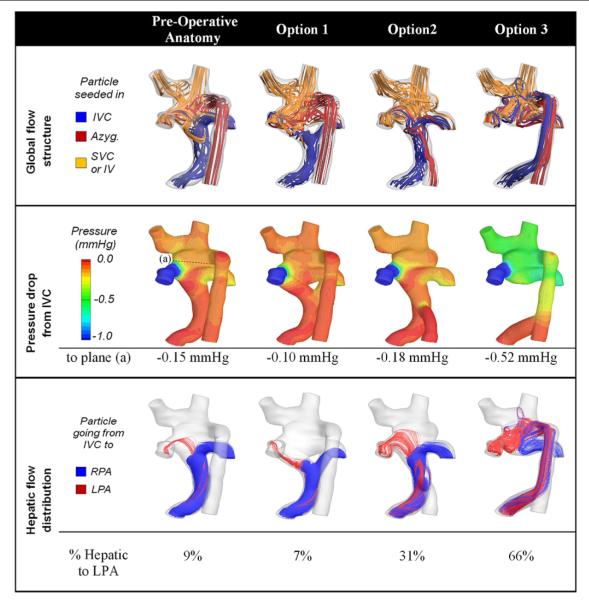
The last and final step is to quantify the performance of all envisioned surgical options, allowing the surgeon to decide on the optimal one. Such analysis is exemplified in Figure 5, which compares HFD and pressure drops in the 3 surgical options shown in Figure 4. Option 3 had the best performance from an IVC distribution stand-point, achieving a 66/34 LPA/RPA ratio, which was in close match with the global cardiac output distribution of 70/30 LPA/RPA. Slightly greater pressure decreases were observed for this option (−0.52 mm Hg between the IVC and the center of the connection vs. <−0.2 mm Hg with the other options), as a result of the combined IVC and azygous streams flowing up the azygous vein and dissipating more energy via friction along the vessel walls. For that particular patient, the surgeon favored HFD to correct the observed PAVMs and thus retained to drain the hepatics into the persistent azygous vein (Option 3). The 5-month follow-up data support this choice with a clear improvement in the overall clinical condition and oxygen saturation levels that had increased from 72% to 94%, implying regression of the PAVMs.
Figure 5. Hemodynamic Efficiency Across all Surgical Options.
Comparison of global performance measures across all considered anatomies. All numbers are obtained from the CFD simulations. For all cases, 70% of the total cardiac output exited through the LPA (Online Video 3). Abbreviations as in Figures 1 and 2.
Discussion and Conclusions
Deficiency of hepatic effluents as a consequence of decreased hepatic flow has long been speculated to be the direct cause of PAVMs, demonstrating the role of the liver in regulating normal pulmonary function (1). In Fontan patients, adequate HFD is in great part controlled by the design of the TCPC. However, as the complexity of the underlying anatomy increases, the amount of control that can be exercised decreases. This phenomenon can be observed in Fontan patients having a Kawashima procedure performed in Stage 2, in whom the incidence of PAVMs can be as high as 21% (5). Keeping this observation in mind, this article presents 2 new approaches for managing Fontan patients with PAVMs: 1) a noninvasive technique for quantifying hepatic flow splits with CMR; and 2) an image-based surgical planning framework for identifying the geometry that achieves an optimal hepatic flow distribution to both the lungs.
Reconstruction of the 4-dimensional pre-operative in vivo flow fields with the use of PC CMR measurements appears as an attractive noninvasive method for PAVM diagnosis. In the patient under study for example, the reconstructed flow fields revealed that the left lung received a majority of the cardiac output (70%) but very little of the hepatic blood (5%), both of which may be indicative of left lung PAVMs. Furthermore, analysis of the detailed dynamic TCPC flow structures provides insights into the underlying causes for the unbalanced HFD, which may then serve for a more rational TCPC design and planning of the necessary reoperation.
The palliative strategy for correction of PAVMs typically involves a Fontan revision in which attempts are made to redirect the hepatic effluent to the affected lung. Clearly, the wide variety of patient anatomies makes it difficult to design a general procedure that fits all patients, whereas the complexity of in vivo anatomies pose significant challenges to identify the surgical option that best distributes hepatic flow for a given patient. The pre-operative anatomy shown in this study is a clear illustration of this difficulty: flaring the extra-cardiac conduit towards the LPA would have suggested a favorable hepato-to-LPA flow distribution, but the impact of the azygous flow actually resulted in the opposite behavior.
This work introduces a whole new paradigm for addressing this problem by the use of an image-based surgical planning approach that can be used to optimize Fontan procedures on a patient specific basis, which may prove beneficial and cost effective to both the hospital and the patient in the long-term. Different virtual operation scenarios can be investigated for each patient, allowing clinicians to conduct a multifactorial risk/benefit analysis (balancing power losses against hepatic flow distribution and ease of completion, for example) and thereby empowering them with the options to select the best treatment for an individual patient. Finally, although the proposed framework was exemplified in the context of Fontan failure and PAVMs correction, this approach can also be applied at earlier stages to optimize second and third stages and prevent the formation of PAVMs.
Supplementary Material
Acknowledgments
The authors acknowledge their clinical collaborators Dr. Gil Wernosvky, from the Children’s Hospital of Philadelphia, and Dr. Donald Putman, from Metropediatric Cardiology Associates PC.
This work was supported by the NIH/NHLBI (grant HL67622), the NSF project (CBET-0625976), the Minnesota Supercomputing Institute, and an American Heart Association pre-doctoral fellowship. Drs. Sundareswaran and Zélicourt contributed equally to this work.
ABBREVIATIONS AND ACRONYMS
- 3D
3-dimensional
- CFD
computational fluid dynamics
- CMR
cardiac magnetic resonance
- HFD
hepatic flow distribution
- IVC
inferior vena cava
- LPA
left pulmonary artery
- PAVMS
pulmonary arteriovenous malformations
- PC CMR
phase-contrast cardiac magnetic resonance
- RPA
right pulmonary artery
- TCPC
total cavopulmonary connection
APPENDIX.
For supplementary Videos 1, 2, and 3 and their accompanying legends, please see the online version of this article
REFERENCES
- 1.Duncan BW, Desai S. Pulmonary arteriovenous malformations after cavopulmonary anastomosis. Ann Thorac Surg. 2003;76:1759–66. doi: 10.1016/s0003-4975(03)00450-8. [DOI] [PubMed] [Google Scholar]
- 2.Frakes DH, Conrad CP, Healy TM, et al. Application of an adaptive control grid interpolation technique to morphological vascular reconstruction. IEEE Trans Biomed Eng. 2003;50:197–206. doi: 10.1109/TBME.2002.807651. [DOI] [PubMed] [Google Scholar]
- 3.Pekkan K, Whited B, Kanter K, et al. Patient-specific surgical planning and hemodynamic computational fluid dynamics optimization through free-form haptic anatomy editing tool (surgem) Med Biol Eng Comput. 2008;46:1139–52. doi: 10.1007/s11517-008-0377-0. [DOI] [PubMed] [Google Scholar]
- 4.de Zélicourt D, Ge L, Wang C, Sotiropoulos F, Gilmanov A, Yoganathan AP. Flow simulations in arbitrarily complex cardiovascular anatomies—an unstructured Cartesian grid approach. Computers & Fluids. 2009 In press. [Google Scholar]
- 5.Pandurangi UM, Shah MJ, Murali R, Cherian KM. Rapid onset of pulmonary arteriovenous malformations after cavopulmonary anastomosis. Ann Thorac Surg. 1999;68:237–9. doi: 10.1016/s0003-4975(99)00407-5. [DOI] [PubMed] [Google Scholar]
Associated Data
This section collects any data citations, data availability statements, or supplementary materials included in this article.


