

Abstract
Background and Aims
Root length and depth determine capture of water and nutrients by plants, and are targets for crop improvement. Here we assess a controlled-environment wheat seedling screen to determine speed, repeatability and relatedness to performance of young and adult plants in the field.
Methods
Recombinant inbred lines (RILs) and diverse genotypes were grown in rolled, moist germination paper in growth cabinets, and primary root number and length were measured when leaf 1 or 2 were fully expanded. For comparison, plants were grown in the field and root systems were harvested at the two-leaf stage with either a shovel or a soil core. From about the four-leaf stage, roots were extracted with a steel coring tube only, placed directly over the plant and pushed to the required depth with a hydraulic ram attached to a tractor.
Key Results
In growth cabinets, repeatability was greatest (r = 0·8, P < 0·01) when the paper was maintained moist and seed weight, pathogens and germination times were controlled. Scanned total root length (slow) was strongly correlated (r = 0·7, P < 0·01) with length of the two longest seminal axile roots measured with a ruler (fast), such that 100–200 genotypes were measured per day. Correlation to field-grown roots at two sites at two leaves was positive and significant within the RILs and cultivars (r = 0·6, P = 0·01), and at one of the two sites at the five-leaf stage within the RILs (r = 0·8, P = 0·05). Measurements made in the field with a shovel or extracted soil cores were fast (5 min per core) and had significant positive correlations to scanner measurements after root washing and cleaning (>2 h per core). Field measurements at two- and five-leaf stages did not correlate with root depth at flowering.
Conclusions
The seedling screen was fast, repeatable and reliable for selecting lines with greater total root length in the young vegetative phase in the field. Lack of significant correlation with reproductive stage root system depth at the field sites used in this study reflected factors not captured in the screen such as time, soil properties, climate variation and plant phenology.
Keywords: Triticum aestivum, wheat, root architecture, branch, breeding, selection, elongation
INTRODUCTION
Many cropping soils have water stored in the sub-soil at maturity that is available but not accessed by the crop. Modelling of bean, wheat and maize suggests that new varieties with deeper root systems (i.e. more root length at depth) can access more of the deep stored water than current varieties to produce higher yields (Ho et al., 2005; Manschadi et al., 2006; Lilley and Kirkegaard, 2007; Hammer et al., 2009). Kirkegaard et al. (2007) demonstrated that a relatively small (10–30 cm) increase in rooting depth into moist sub-soil at flowering could provide a significant (approx 0·5 t ha−1) yield increase in wheat.
Fast and accurate phenotypic or plant measurement ‘screens’ are needed to select directly for deeper roots with greater total root length to make genetic gain quicker than selection for yield alone (Richards et al., 2010). Such screens can also lead to molecular markers for genomic regions that account for significant proportions of the phenotypic variation. The screen must be repeatable and rapid so that many lines can be assessed (Bonnett et al., 2005). A number of methods have been used to identify variation in total root length and root depth in crops (O'Toole and Bland, 1983; Gregory et al., 2009). Most have been developed for use in controlled conditions using young plants. Methods for wheat include assessment in hydroponics (e.g. O'Brien, 1979) and agar-based screens (e.g. Sanguineti et al., 2007; Manschadi et al., 2008), screens in soil using clear-faced boxes (e.g. Hurd 1968; Liao et al., 2006), screens through wax barriers (Botwright Acuňa et al., 2007) and screens in pots or columns of soil (Sharma et al., 2009).
The ranking of lines from root screens in controlled conditions must be consistent with root system performance in the field, ideally at the reproductive plant stage when water is most valuable to improve yield through its effect on seed set and grain filling (Passioura, 1983). Typically this is tested using correlation. A number of studies have related root controlled-environment screens to field measures. For example, wheat lines with high deep root length density in boxes with clear faces had higher yields in water-limited Prairie field environments than lines with low root density in boxes (Hurd, 1968); rice genotypes with long roots in hydroponics had higher yields that those with shorter roots in irrigated but not droughted conditions (Ekanayake et al., 1985); and rye genes in the wheat cultivar Pavon were associated with greater root mass in pots and higher yield in field plots (Ehdaie et al., 2003). McDonald et al. (2012) related the root growth of 52 wheat cultivars in a range of controlled-environment seedling screens to 12 years of field yields from 233 trials in South Australia. This comprehensive study showed a poor relationship between seedling root penetration through soil densely compacted in pots, and field yields. The four examples above, however, did not directly measure roots in the field, and relate performance there with that in a controlled-environment screen. Few studies have related root growth screens from the laboratory directly to root growth in the field. Working with white clover, Caradus (1977) measured tap root number and thickness in pots in glasshouses and tap root number and thickness in the field, and found a significant, positive correlation. Wahbi and Gregory (1989) reported a positive relationship between field root lengths measured in shallow layers and controlled-environment root length for barley genotypes. Botwright Acuna et al. (2007) identified four of eight wheat genotypes with good ability to penetrate wax layers in a screen to have deeper roots in the field, but this varied with the field site considered.
Here we report studies to relate root growth in a controlled-environment screen on wheat seedlings to root growth of field-grown plants at vegetative and reproductive stages. The controlled-environment screen was undertaken in moist, germination paper rolls and has been used previously to screen maize mutants for root development (Hetz et al., 1996; Hochholdinger et al., 2004) and for wheat root response to saline conditions (Rahnama et al., 2011). The attraction of the controlled-environment screen was its speed, ease of use, capacity to control environmental conditions to avoid a limitation, and its potential to express maximum root growth. The field sites were in southern New South Wales, Australia, and have a typical dense, slightly acidic kandosol soil (McKenzie et al., 2004) with no known toxicities or hard pans to at least 1·6 m depth. Crops are rainfed (mean 500 mm year−1), and previous detailed studies of wheat root growth in the target soils showed that most of the deep roots grow within the existing cracks and pores, and are not ‘pushing’ through the dense sub-soil (White and Kirkegaard, 2009). This observation suggests that laboratory screens that select for rapid root growth and branching in unrestricted conditions may correlate better with growth in the field soils than might be expected. The aim of this study was to establish if the controlled-environment screen was rapid, repeatable and adequately reflected the ranking of root growth in field-grown plants at vegetative and reproductive growth stages.
MATERIALS AND METHODS
Germplasm
Most experiments were carried out with a spring wheat (Triticum aestivum) recombinant inbred line (RIL) population developed from a cross between Chuan mai-18 and a vigorous breeding line Vigour 18 generated at CSIRO (Spielmeyer et al., 2007). This population was chosen because previous studies in controlled and field conditions had shown that Vigour 18 has rapid root growth compared with conventional cultivars and provided a benefit to growth in hard, uncultivated soils and sandy soils with leached nitrogen (Watt et al., 2005; Liao et al., 2006). A small number of diverse international and Australian spring and winter wheat genotypes were used in the controlled and field studies to compare performance with that of the RILs. In the paper roll screen, seeds were weighed before sowing using a four decimal place balance to correct for differences in size using a computer with software to log weights for greater speed (Crystal 200, Gibertini Elettronica, Italy with BalanceLink Software, Mettler Toledo, Switzerland). The RILs were assigned a narrow (5 mg) weight range among the genotypes within an experiment. For the diverse wheat genotypes, 20 seeds of average size of each genotype were selected by eye and weighed, and then seed was classed within a 2 mg range for use in the experiment.
Controlled-environment screen
Seedlings were grown in sheets of rolled germination paper using a method adapted from Hetz et al. (1996) and which was employed previously to screen for root growth in saline solutions (Rahnama et al., 2011) (Fig. 1A, B). Anchor germination paper was used in all experiments (25·4 × 38·1 cm, catalogue number #OP1015, from Hoffman Manufacturing Inc., Albany, OR, USA). Before rolling with seeds, the genotype name was written on a corner of the sheet with a pencil, and, in some cases, colour markings with a permanent pen were made at the top edge of the sheet at the position of each seed to keep track of individuals before harvesting. A fold 2 cm deep was made along the top of the sheet (25·4 cm side) to make a crease for the seeds, and another small fold about 3 mm deep was made along the long side to provide a starting point for the roll. The seed crease was sprayed with a mist of tap water and up to ten seeds were placed along the crease with the embryo facing the bottom of the sheet. The paper was then rolled tightly by hand, starting from the small 3 mm fold and gradually incorporating each seed into the roll so that they were 3–4 cm apart at the position of the crease. The roll was quite tight to avoid seed slipping out and to maintain embryo position, and then it was dipped entirely in a tray of tap water. Rolls were placed seed end upwards in white, opaque PVC tubes (38 cm tall × 8·3 cm wide) with a sealed clear bottom to see when roots reached the bottom, and approx. 250 mL of water was added. The water level was checked regularly to ensure it did not evaporate, yet did not reach higher than the end of the longest roots. The entire tube was filled with paper rolls with or without seed to minimize evaporation.
Fig. 1.
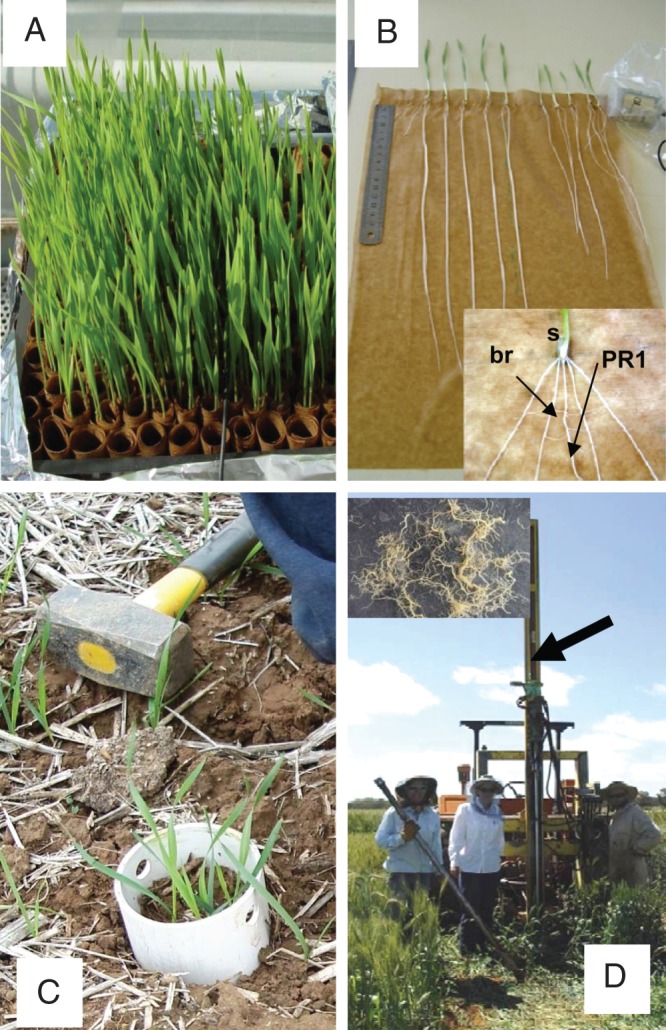
Wheat plants used to measure root growth in the paper roll controlled-environment screen (A, B) and the field at two-leaf (C) and flowering (D) stages. (A) Wheat plants in the paper roll screen. (B) Paper screen unrolled with wheat seedlings with 1–2 leaves with primary axile roots (PRs) extending down the germination paper used in the screen. PRs have branch root (br) growth (inset; s = seed). (C) Harvesting wheat field plants at the two-leaf stage with a PVC core pushed into the soil with a mallet. (D) Harvesting field plants with a tractor and core (arrow). Roots washed from cores (inset).
Rolls were put at 4 °C in the dark overnight before transfer to a custom-built growth cabinet with glass sides and roof located within a glasshouse. The temperature was 8/15 °C night/day and incandescent bulbs supplemented daylight 11 h per day. Plants grew until the first roots reached the bottom of the rolls (seen through the clear bottoms of the tubes), but did not extend below the bottom of the roll, and this coincided with plants between leaf 1 and 2, and 15–20 d from sowing, depending on conditions. In later experiments, the time at which the tip of the coleoptile was first observed at the top of the paper was scored to estimate the time to germination. At harvest, measurements included primary (seminal) axile root (PR) number, and PR length measured with a ruler, and a branching score from 1 to 5 that was a visual estimate of the extent of branching based on the longest branch root and the distance along the primary axile root that branching was observed by eye. Total root length was measured in some experiments with a flatbed scanner (staining for 3 min in 0·05 % Toluidine blue, rinsing and scanning at 300 or 400 dpi with an Epson Scanner), and analysed with WinRHIZO software (Regent Instruments, Canada); from Watt et al. (2005). Leaf lengths were measured with a ruler and dry weights were recorded after drying at 70 °C. When plants were not measured immediately at harvest, they were kept in a cold room at 4 °C for up to 3 d, or preserved entirely in the rolls in 50 % water:50 % ethanol at 4 °C. It was also possible to measure the roots within a tray of shallow water, and then re-roll within the germination paper and maintain until transplanting to soil and growing on for harvesting of seed.
Field screen
Site characteristics
Genotypes were grown at field sites in 2006 and 2007 in south-east New South Wales, Australia, from May to December (Site 1, Gundibindyal; Site 2, Bethungra, described in Kirkegaard and Lilley, 2007). Both have red kandosol soils, commonly known as red earths that are weathered with >20 % clay, and deep with no abrupt horizon changes (McKenzie et al., 2004). The surface pH (CaCl2) at the sites is 5·8 and the bulk density is generally high (Site 1, 1·4–1·62 g cm−3 to 160 cm depth; Site 2, 1·45–1·55 g cm−3 to 160 cm depth) with substantial cracks and pores that wheat root systems penetrate during the season. The average maximum depth of wheat roots at harvest on similar soils has been reported to be 1·5 m (average 12 kandosol sites and seasons; Kirkegaard and Lilley, 2007). Seed was sown without prior cultivation (direct-drilled) on 15 June in 2006 and 6 June in 2007, and grown under rainfed conditions. Crops were managed with adequate nutrients and control of weeds and foliar diseases according to local recommendations. Field experiments were set out in a grid of plots of 6 × 2 m, with each genotype randomly allocated to 4–6 replicate plots. In 2006, Site 1 and 2 roots were sampled at two and five leaves and at flowering (25 d, 63 d and 116 d after sowing, respectively). Site 1 had one experiment consisting of eight Chuan mai-18 × Vigour 18 RILs selected from the paper roll screen to represent extreme lines with long roots and short roots, and an experiment with a selection of diverse genotypes to identify genetic variation in maximum rooting depth. A selection of another set of 24 Chuan mai-18 × Vigour 18 RILs were harvested at the two-leaf stage only. In 2006, Site 2 had diverse genotypes. In 2007, a sub-set of Chuan mai-18 × Vigour 18 RILs and diverse genotypes were sown at Site 1 and harvested at the two-leaf stage (41 d from sowing) and at flowering (sampling schedule presented in Table 1).
Table 1.
Sampling schedule of wheat roots in the field
| Year | Site | Germplasm | Sampling (plant age and developmental stage) |
|---|---|---|---|
| 2006 | 1 | 8 Chuan mai-18 × Vigour 18 RILs | Two and five leaves and at flowering (25, 63 and 116 d from sowing, respectively) |
| 24 Chuan mai-18 × Vigour 18 RILs | Two leaves (25 d from sowing) | ||
| 2 | Diverse genotypes | Two and five leaves and at flowering (25, 63 and 116 d from sowing, respectively) | |
| 2007 | 1 | 8 Chuan mai-18 × Vigour 18 RILs | Two leaves and at flowering (41 and 120 d from sowing) |
Root harvesting
Root systems were harvested at the two-leaf stage with either a shovel or a soil core. With the shovel, a 30 cm wide trench was dug around a row of plants about 40 cm long to a depth of about 25 cm, and the entire clod was immediately sealed in a plastic bag and returned to the lab where the plants were washed free from the soil (number of axile roots and their lengths measured), and then preserved in 50 % ethanol before scanning as described above. Alternatively, a PVC tube cut to make a core with a sharpened end (20 cm long × 7·5 cm wide) was hammered into the ground with a mallet and a dolly that fitted onto the core (Fig. 1C). It was also possible to push the cores into the ground with a jack-hammer. Cores were shovelled out of the ground, and the ends were cleaned and evened off before placing into plastic bags for processing back at the laboratory. Roots were washed free from soil with a hose using warm water and a medium force spray to keep the root systems intact. Soaking the soil cores in water before washing for 2 h loosened the soil and helped to avoid root breakage. Cores were washed from the bottom, and the distance from the surface to where roots first appeared was recorded as the maximum depth of the root system. Washed, intact root systems were then measured manually (number and lengths of axile roots), and preserved in 50 % ethanol until scanned.
From about the four-leaf stage, root systems were below the depth readily dug out by hand, and roots were extracted with steel coring tubes (65 cm long × 7 cm wide, and 200 cm long × 4·1 cm wide at flowering) placed directly over the plant and pushed to the required depth with a hydraulic ram attached to a tractor (Fig. 1D). The intact core of soil was pushed from the tube onto a cradle marked with 10 cm increments, and, working from the bottom of the core, broken to reveal the wheat roots (core-break method; Bohm 1979). The depth at which wheat roots from the current root system were first observed was recorded as the maximum root depth. Occasionally this was confirmed by starting at the soil surface. In some experiments, the soil of each 10 cm increment was bagged, returned to the lab and washed from the roots using a custom-built hydro-pneumatic root washer (Smucker et al., 1982), and the roots were preserved in 50 % ethanol (Fig. 1D, inset). Roots of the current cereal crop were separated from remnant roots of previous crops and weeds, under a magnifying lamp and a dissecting microscope using morphological features to distinguish the cereal roots, stained, and scanned for root length using WinRHIZO as described for the controlled-environment screen (Watt et al., 2008).
Estimating sampling intensity and replication
An intensive sampling of a single 1·2 × 1·2 m plot at Site 1 was performed to determine (1) if the number of roots per core face was correlated with the length of total and estimated wheat roots within the core determined from washing and scanning; and (2) the numbers of cores needed per plot to represent the spatial variability within the plot adequately for depth and root length density. Twenty-five cores were extracted, each one positioned next to a plant over a 20 cm × 20 cm grid. Each core was broken at 85, 95, 105 and 110 cm, and the number of visible roots counted. Soil samples from 80–90, 90–100, 100–110 and 110–120 cm were collected to estimate root length density from the washed cores. To determine accurately the number of cores required to estimate root parameters (maximum root depth, roots per core face and root length density) within a plot, an iterative process was used. Samples were selected without replacement and a mean calculated until all 25 samples were used. This procedure was repeated 20 times, allowing an average to be calculated for each sample size. Then the average value was plotted against the sample size to determine at which sample size an additional sample changed the mean value by <5 % and, therefore, provide an accurate estimate of the mean.
Power analysis was performed, on the maximum root depths and root length densities in the field, to determine if statistically non-significant differences among genotypes were due to insufficient sample sizes. Data from a 2004 trial at Site 1 were used. The maximum root depths and root length densities of eight genotypes were determined in the field, and there were no significant differences among the lines. The program G*Power (http://www.psycho.uni-duesseldorf.de/abteilungen/aap/gpower3/) was used to perform power analyses. The effect size (f) was calculated as the standard deviation of the g population means divided by the average within-population standard deviation. This f value was then used to calculated the sample size needed, given the measured standard deviations, to obtain a significant difference (α = 0·05) among means.
Data analysis
All experiments were fully randomized block designs, with at least four replicates per genotype in separate rolls in separate tubes, or in plots randomly allocated across a paddock. A critical value of α = 0·10 was used for all tests of statistical significance, except the power analysis described above. Linear regression was used to understand relationships and estimate Pearson correlations between various root and growth parameters within and across experiments using Excel and Genstat.
RESULTS
Controlled environment screen: speed and repeatability
At harvest, plants from paper rolls had developed their full complement of primary axile roots (PRs) (2–5) and occasionally a scutellar node axile root (Fig. 1B, inset). The PR1 emerged first from the embryo base and generally was the longest root, extending to near the bottom of the paper roll. Both PR2 and PR3 emerged soon after, just above PR1, and were often the same length as PR1. The PR4 and PR5 emerged later and were about 30 % shorter than PR1–PR3 at harvest. Axile roots were close together with little expression of angle due to the compact roll (Fig. 1B). First-order branch roots were present along the basal 10 cm of the PR on most plants, but these were sparse and irregular in length compared with soil-grown roots (Fig. 1B, inset). Regular, dense root hairs were visible by eye. Leaf 1 was approaching final length and leaf 2 was about 50 % length at harvest.
The total root system lengths typically ranged from 40 to 120 cm and could be scanned intact (scanner tray 28·5 × 18·5 cm), taking about 2 min to record the total length of unstained roots from the computer screen and processing the file. Manual measurements such as axile root number and length measured with a ruler took 1–2 min. These were significantly (P < 0·05) and positively correlated with total root length estimated with the scanner (Fig. 2). The quickest measurement with the highest correlation to the total length was length of PR1 and PR2 with a ruler (r = 0·7, P < 0·001) (Fig. 2A). The best surrogate for total root length was [number of axile roots (PR number, Fig. 2C)] × (sum length PR1 and PR2, Fig. 2A) (r = 0·9, P < 0·001; Fig. 2B). Length of leaf 1 was moderately correlated to total root length (r = 0·48, P < 0·001; Fig. 2D).
Fig. 2.
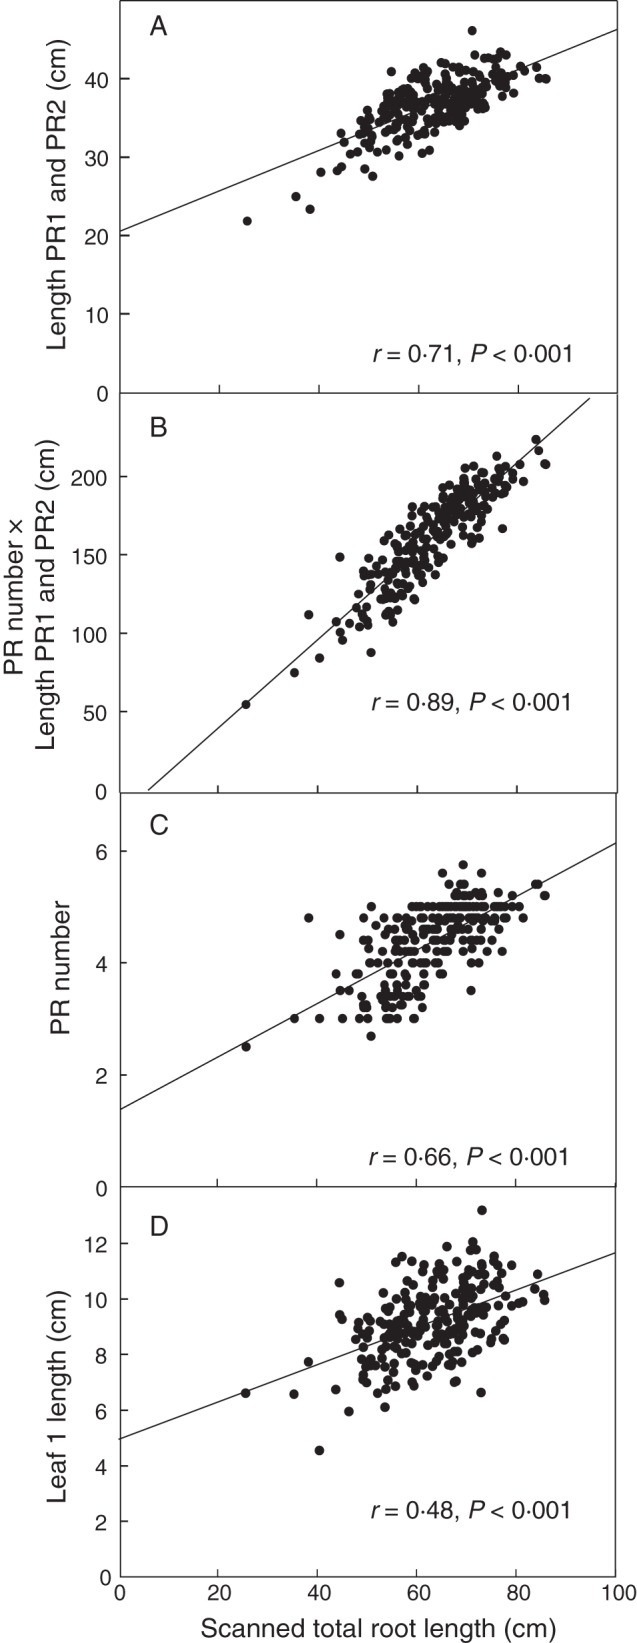
Relationship between total axile root length of wheat seedlings grown in paper rolls and various plant measures that could be used to speed up the screen such as (A) the length of the two longest primary axile roots (PR1 and PR2), (B) the number of PRs times the length of PR1 and PR2, (C) the number of PRs, and (D) length of leaf 1. n = 202 recombinant inbred lines; each point is the mean of five plants.
The strongest correlation that could be achieved between two independent paper roll screens measuring the lengths of PR1 and PR2 with the same lines was r = 0·78 (P < 0·001) (Fig. 3A). Repeatability appeared dependent on environmental and seed factors. An important environmental factor was the moisture of the paper, and this was observed when one experiment dried. Differences in air temperature between 8 and 15 °C did not change root length ranking (r = 0·99, P <0·01; Fig. 3B). Differences in seed fungal contamination and time to germination were correlated with changes in root parameters. Since the roots elongate typically 1–3 cm per day, a delay in germination of >2 d between lines can have a large effect on total root length. This can be minimized by stratifying the seed in rolls for 48 h at 4 °C prior to transfer to the growth cabinet. Also, measuring leaf length of young seedlings can be used to correct for differences in time of germination.
Fig. 3.
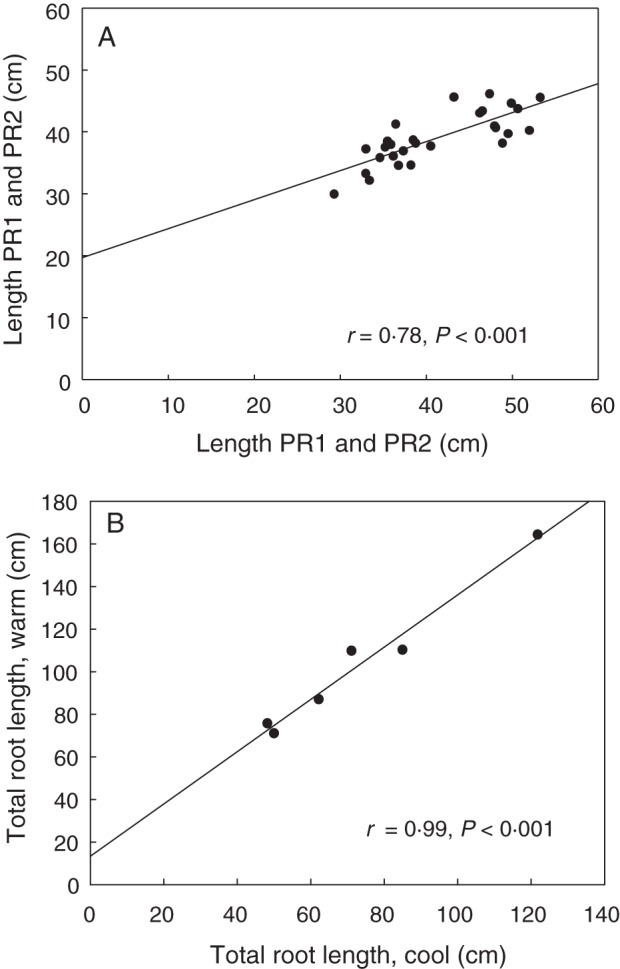
Repeatability of the paper roll root screen. (A) Correlation between two independent screens of wheat for the length of the two longest primary axile roots (PR1 and PR2). n = 28 RILs; each point is the mean of five plants grown in paper rolls. (B) Diverse lines repeated at two temperatures; cool = 8 °C; warm = 15 °C. n = 6 diverse lines; each point is the mean of five plants grown in a paper roll.
Relationship between controlled-environment and field screens
Paper roll root lengths were positively correlated to the lengths and depths of roots in the field at the two-leaf and five-leaf stages within the RIL population (r = 0·63, P = 0·09; and r = 0·79, P = 0·02, respectively; Fig. 4A–C). However, the paper roll root measurements were not correlated with the root system depths at flowering (Fig. 4D). A diverse set of genotypes was tested at Site 1 and Site 2. Paper roll root lengths were strongly positively correlated with the depths and total lengths of roots of plants at the two-leaf stage at Site 1 (r = 0·9), but not at the five-leaf stage or at flowering. At Site 2, root length and depth in the field of the diverse genotypes at the two-leaf stage were positively correlated with the paper roll root length (r = 0·6), but depth at flowering in the field was not correlated, consistent with observations for the RIL population and the diverse genotypes at Site 1. The root lengths of plants grown in the paper roll screen represented field root lengths at the two-leaf stage well; however as the plants developed in the field, the relationship depended on population and site. The screen was a poor predictor of roots at flowering in the field regardless of germplasm or site.
Fig. 4.
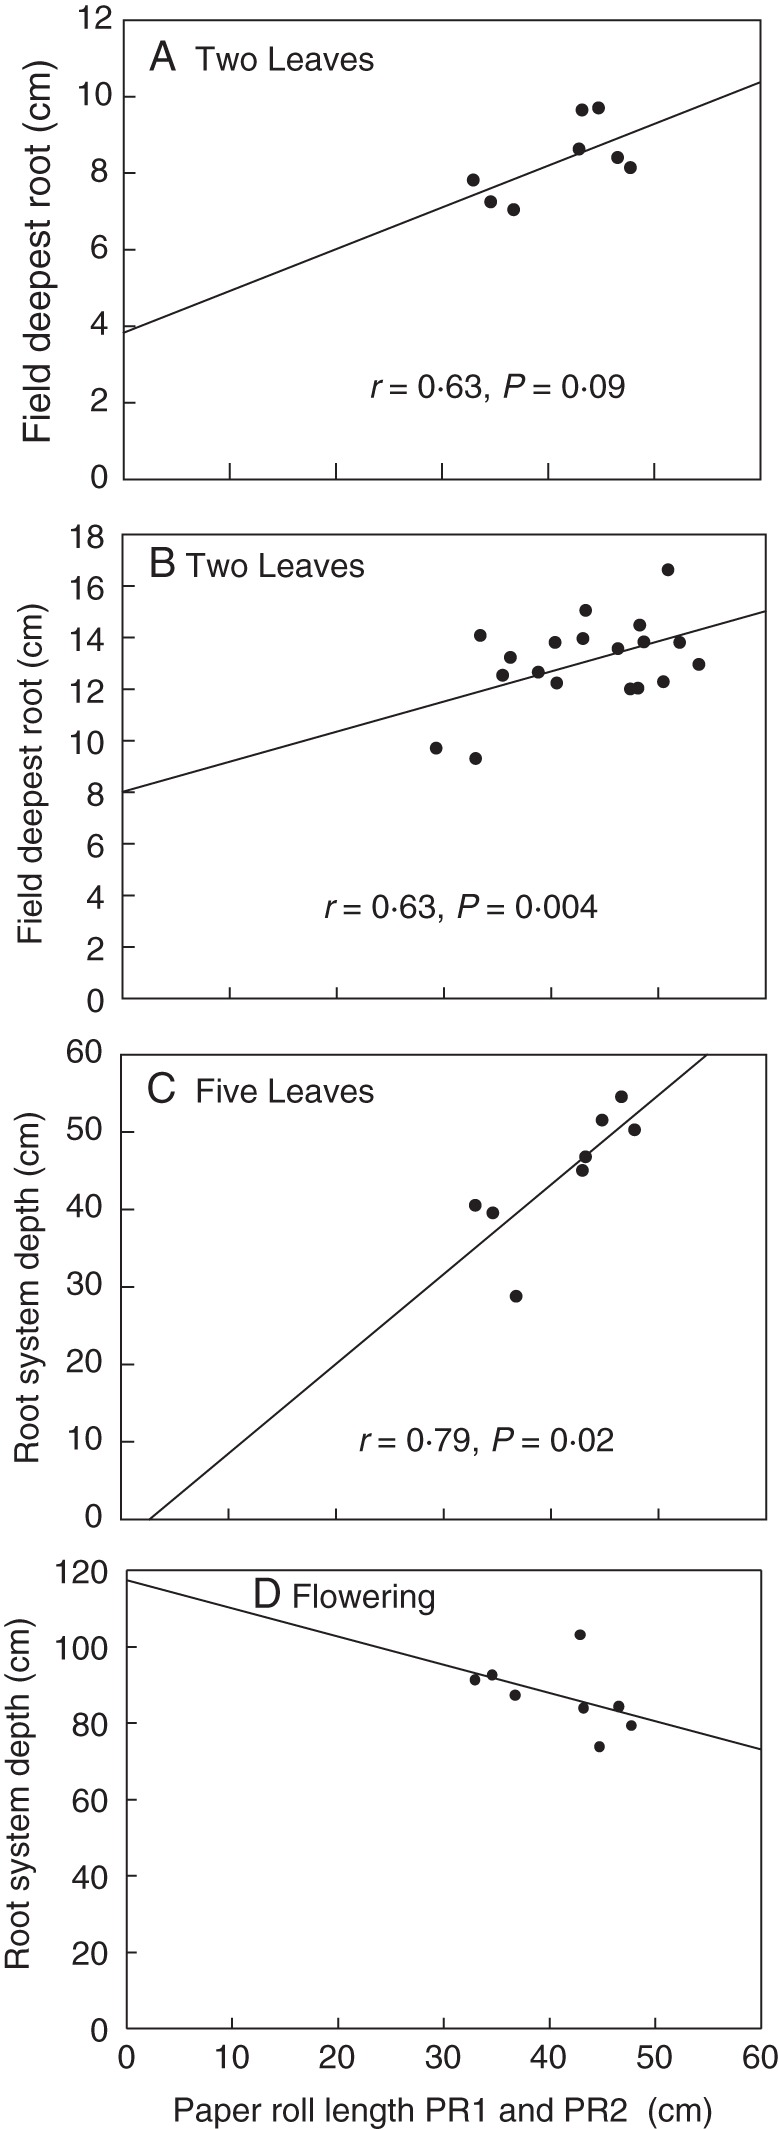
Relationship between paper roll screen and field-grown roots. Correlations between the length of the two longest primary axile roots in the controlled-environment paper roll screen (PR1 and PR2) and field root system depth at the two-leaf stage in trial 1 (A) and trial 2 (B), at the five-leaf stage in trial 1 (C), and at flowering in trial (1) (D). Recombinant inbred lines (RILs) grown at a rainfed field site. (A), (C) and (D) are from one trial at the site and n = 8 lines, mean of eight plants per plot; (B) is from n = 24 lines, mean of eight plants per plot. Solid line regression is significant at a probability level of 10 %. The dashed line in (D) indicates that the correlation was not significant at a probability level of 10 %.
Field screens
Measurements made directly in the field were quick but labour intensive. Manual coring or shovelling of roots from soil to about 25 cm at the two-leaf stage took approx. 5 min, and then measuring the depth and number of roots took a further 2 min. Coring with a tractor at the five-leaf stage and at flowering took 2 min, and depth measurements took 1 min, while density measurements by core-break took 2 min.
In-field measurements showed strong positive correlations with total lengths from field cores determined in the lab, which involved washing, removal of dead roots of previous crops and scanning (Fig. 5). At the two-leaf stage, the number of roots times the depth of PR1 in the field strongly correlated with the total length (r = 0·9, P < 0·001; Fig. 5A), and at the five-leaf stage, root depth recorded in the field correlated with the total length within the core (r = 0·7, P = 0·05; Fig. 5B). Depth at the two-leaf stage was a moderate predictor of depth at the five-leaf stage (r = 0·6, P = 0·09; Fig. 5C). However, depth at the two-leaf and the five-leaf stage did not correlate with depth at flowering (Fig. 5D). As in controlled-environment conditions, early plant measurements did not correlate well with flowering root depth. Measurements at flowering were only reliably obtained with direct field measurements at that time.
Fig. 5.
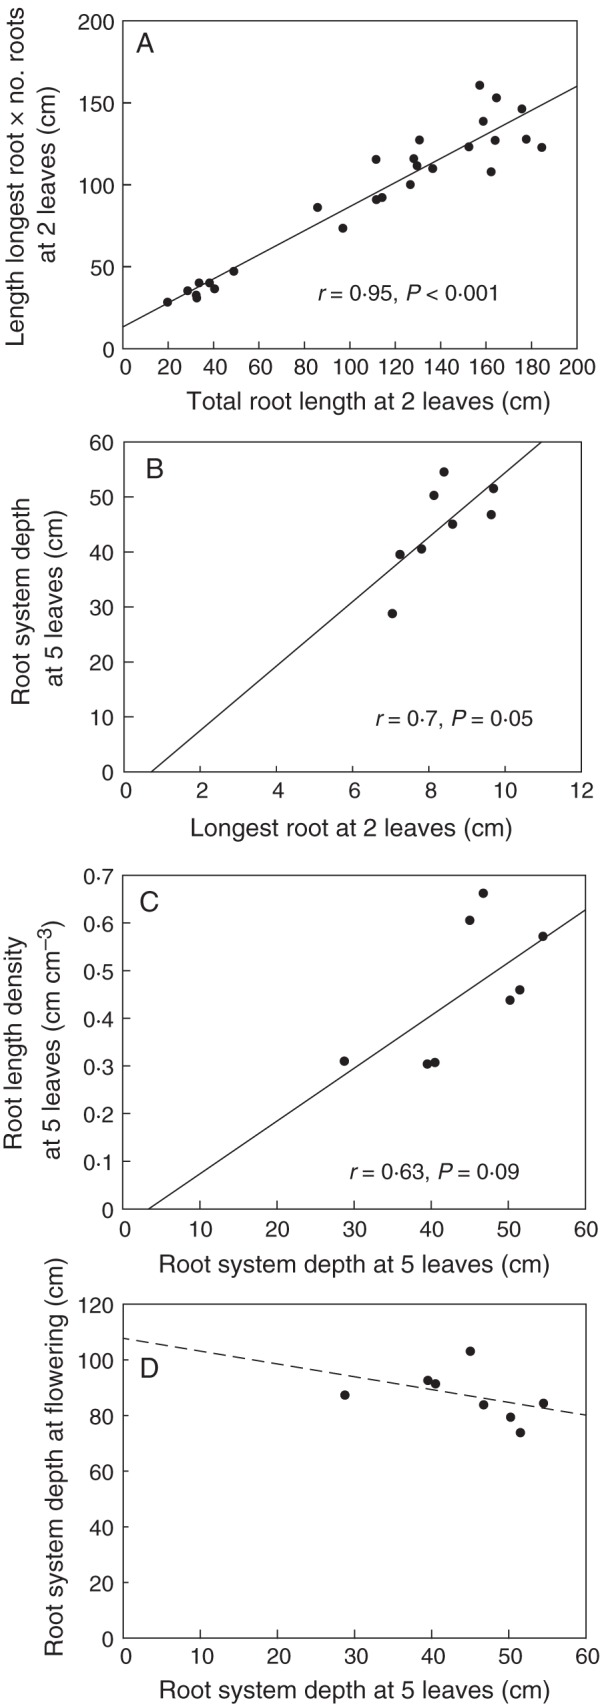
Relationships between measures of field-grown wheat roots to speed up sampling directly in the field at different plant stages. (A) Field roots harvested at the two-leaf stage and washed. Measurement of the length of the longest roots and number of roots (quick measurement) relates strongly to the total root length measured with scanning (slow). (B) Field roots cored and measured in the field. The longest root at the two-leaf stage is strongly correlated with the root system depth at the five-leaf stage. (C) Field roots cored. Root system depth, determined by eye in the field (quick), is moderately correlated with the root length density within the core, determined by washing and scanning (slow). (D) Root system depth determined in the field from cores (quick). Depth at five leaves is not related to depth at flowering.
Given that the root measurements at flowering needed to be in the field, we examined the replication needed within a plot and across a field experiment. The iterative procedure using intensive coring revealed that two cores within a 1·2 × 1·2 m plot were sufficient to obtain an accurate estimate of maximum root depth. In contrast, four cores were necessary to estimate the root length density accurately within a plot. When measuring the number of roots per face, five cores were necessary to obtain an accurate estimate within the plot. Counting the number of roots from up to four faces within a core had no effect on the number of cores required within a plot. Eight contrasting genotypes showed a range of maximum root depths from 70 to 97 cm. However, these maximum root depths were not significantly different among genotypes with four replicate samples per plot. Root length densities at depth among the genotypes ranged from 0·2 to 1·2 cm cm−3. However, root length densities were also not significantly different among the genotypes. Power analysis predicted that to identify significant differences (α = 0·05) confidently among genotypes, 11 plots per genotype were needed for maximum root depth and 20 plots per genotype were needed for root length density at depth. Thus, in a year where no significant difference between roots was obtained, analysis showed that with increased replication, significance could be established through more robust sampling.
DISCUSSION
The target root system traits considered in this study were increased root depth and increased total deep root length, to enhance access to deeper water during flowering and grain development. A controlled-environment screen for components of the root system that could lead to deeper roots and more total deep root length was evaluated for speed, repeatability and relatedness to the field, at vegetative and reproductive plant stages. In this study, with the field sites and germplasm used, the various seedling screens represented vegetative plants in the field well, but were a poor predictor of root depth at flowering in the field.
The seedling screen in paper rolls was very quick and highly repeatable provided that the paper environment and seed quality were maintained constant across experiments. The screen correlated positively and strongly with total root length and depth in the field at a similar seedling stage at two field sites, within a RIL population and a diverse set of genotypes. It also correlated well with field measurements at the five-leaf stage, but this depended on site and germplasm set. Field measurements for root depth and length at vegetative plant stages could be made quickly and had a high correlation with the more time-consuming measurements in the laboratory on washed roots. However, these too were poor predictors of root measures at flowering in the field over two seasons and two sites within RILs and diverse genotypes.
The reasons for lack of association between vegetative root system measurements and those at flowering are likely to include environmental factors that change over the season and through the soil profile to depth, and influence the ranking of lines. The seasons in this study were generally dry, and lack of water in the profile may have reduced the maximum depth of the root systems and compressed the rankings of the lines. Kirkegaard and Lilley (2007) observed that the depth of wetting was a major factor determining the maximum rooting depth across 35 experimental sites on similar soils in south-east Australia. The rainfall patterns in the years of this study were low compared with long-term averages, and were likely to have also been insufficient to wet the profile fully, potentially limiting the expression of genetic potential for root growth into deeper layers. Other soil factors (e.g. pH, Mn), albeit minor, may have affected root system elongation differently among the lines. Over the course of the growing season (approx. 150 d), they could have had a cumulative effect on a genotype sensitive to such factors, compared with a less sensitive line. Future experiments need to be conducted in sites with soil profiles wet fully to a depth beyond the anticipated maximum depth, to rule out restrictions due to lack of moisture. It is possible that seedling tests are better correlated with reproductive roots in fully wet soil profiles.
The lack of correlation for root traits between the seedling screens and the adult plants may also be explained by changes in plant development through the season. The wheat crops undergo a transition in phenology and, from the four- to the five-leaf stage, enter into tillering, stem elongation and then grain development. Few studies have measured root descent through the season to determine if rates are similar across different developmental stages. Kirkegaard and Lilley (2007) working in southern Australia in an environment similar to that in this study, found that root descent was linear from 50 d after sowing until the plants flowered. However, in other environments, wheat descent was not linear through the season (Derera et al., 1969; Tennant, 1976; Gregory et al., 1978). Tennant's study with ten sampling times over three years and four soil types in Western Australia showed that root system descent is initially rapid during seedling establishment, slows during tiller establishment, then is most rapid until flowering, when it slows again. It would be useful to measure root depth through the season to establish if the root descent is linear in order to make more informed comparisons between the ranking of genotypes in controlled environments and the field.
The results obtained here for roots are not dissimilar to what has been observed for seedling screens for above-ground seedling vigour. For example, measurements made at the two-leaf stage in controlled environments are very effective in selecting for early seedling vigour and biomass up to early stem elongation (Richards and Lukacs, 2002), but the relationship dissipates toward anthesis (Siddique et al., 1989; P. Wilson, A. G. Condon and G. Rebetzke, CSIRO, Plant Industry, Canberra, Australia, unpubl. res.). The likely reasons for this include variation in flowering time and hence in duration of growth, and changes in light interception and canopy architecture. These factors are also likely to be important for root growth as duration of canopy function and carbon supply to roots will influence root exploration and growth (Edwards et al., 2004; Nagel et al., 2006).
Conclusions
Screens of young plant for root growth in controlled environments represent root growth in the field at vegetative plant stages; however, in the field conditions and with the germplasm used in this study, they did not represent reproductive plant stages. Genetic differences in root growth and depth can be identified in adult plants in the field with good site analysis and adequate replication.
ACKNOWLEDGEMENTS
We are grateful to Wolfgang Spielmeyer for initiating the use of the paper roll screen with the guidance of Frank Hochholdinger, and Marc Ellis, Jess Hyles and Linda Magee for helping with field experiments, access to germplasm and conducting root measurements. Field experiments were sown and managed with the help of the staff at the CSIRO Ginninderra Experimental Station. This work was supported by the Grains Research and Development Corporation (GRDC) and a studentship from the Iranian government to S.M.
LITERATURE CITED
- Botwright Acuňa TLB, Pasuquin E, Wade LJ. Genotypic differences in root penetration ability of wheat through thin wax layers in contrasting water regimes and in the field. Plant and Soil. 2007;301:135–149. [Google Scholar]
- Bohm W. Methods of studying root systems. Vol. 33. Ecological studies. Analysis and synthesis. Berlin: Springer-Verlag; 1979. [Google Scholar]
- Bonnett DG, Rebetzke GJ, Spielmeyer W. Strategies for efficient implementation of molecular markers in wheat breeding. Molecular Breeding. 2005;15:75–85. [Google Scholar]
- Caradus JR. Structural variation of white clover root systems. New Zealand Journal of Agricultural Research. 1977;20:213–219. [Google Scholar]
- Derera NF, Marshall DR, Balaam NL. Genetic variability in root development in relation to drought tolerance in spring wheats. Experimental Agriculture. 1969;5:327–337. [Google Scholar]
- Edwards EJ, Benham DG, Marland LA, Fitter AH. Root production is determined by radiation flux in a temperate grassland community. Global Change Biology. 2004;10:209–227. [Google Scholar]
- Ehdaie B, Whitkus RW, Waines JG. Root biomass, water-use efficiency and performance of wheat–rye translocations of chromosomes 1 and 2 in spring wheat ‘Pavon. Crop Science. 2003;43:710–717. [Google Scholar]
- Ekanayake IJ, O'Toole JC, Garrity DP, Masajo TM. Inheritance of root characters and their relations to drought resistance in rice. Crop Science. 1985;25:927–933. [Google Scholar]
- Gregory PJ, McGowan M, Biscoe PV, Hunter B. Water relations of winter wheat. I. Growth of the root system. Journal of Agricultural Science, Cambridge. 1978;91:91–102. [Google Scholar]
- Gregory PJ, Bengough AG, Grinev D, et al. Root phenomics of crops: opportunities and challenges. Functional Plant Biology. 2009;36:922–929. doi: 10.1071/FP09150. [DOI] [PubMed] [Google Scholar]
- Hammer GL, Dong ZS, McLean G, et al. Can changes in canopy and/or root system architecture explain historical maize yield trends in the US corn belt? Crop Science. 2009;49:299–312. [Google Scholar]
- Hetz W, Hochholdinger F, Schwall M, Feix G. Isolation and characterization of rtcs, a maize mutant deficient in the formation of nodal roots. The Plant Journal. 1996;10:845–857. [Google Scholar]
- Hurd EA. Growth of roots of seven varieties of spring wheat at high and low moisture levels. Agronomy Journal. 1968;60:201–205. [Google Scholar]
- Ho MD, Rosas JC, Brown KM, Lynch JP. Root architectural tradeoffs for water and phosphorus acquisition. Functional Plant Biology. 2005;32:737–748. doi: 10.1071/FP05043. [DOI] [PubMed] [Google Scholar]
- Hochholdinger F, Woll K, Sauer M, Dembinsky D. Genetic dissection of root formation in maize (Zea mays) reveals root-type specific developmental programmes. Annals of Botany. 2004;93:359–368. doi: 10.1093/aob/mch056. [DOI] [PMC free article] [PubMed] [Google Scholar]
- Kirkegaard JA, Lilley JM. Root penetration rate – a benchmark to identify soil and plant limitations to rooting depth in wheat. Australian Journal of Experimental Agriculture. 2007;47:590–602. [Google Scholar]
- Kirkegaard JA, Lilley JM, Howe GN, Graham JM. Impact of subsoil water use on wheat yield. Australian Journal of Agricultural Research. 2007;58:303–315. [Google Scholar]
- Liao MT, Palta JA, Fillery IRP. Root characteristics of vigorous wheat improve early nitrogen uptake. Australian Journal of Agricultural Research. 2006;57:1097–1107. [Google Scholar]
- Lilley JM, Kirkegaard JA. Seasonal variation in the value of subsoil water to wheat: simulation studies in southern New South Wales. Australian Journal of Agricultural Research. 2007;58:1115–1128. [Google Scholar]
- Manschadi AM, Christopher JT, deVoil P, Hammer GL. The role of root architectural traits in adaptation of wheat to water-limited environments. Functional Plant Biology. 2006;33:823–837. doi: 10.1071/FP06055. [DOI] [PubMed] [Google Scholar]
- Manschadi AM, Hammer GL, Christopher JT, deVoil P. Genotypic variation in seedling root architectural traits and implications for drought adaptation in wheat (Triticum aestivum L.) Plant and Soil. 2008;303:115–129. [Google Scholar]
- McDonald GK, Taylor JD, Verbyla A, Kuchel H. Assessing the importance of subsoil constraints to yield of wheat and its implications for yield improvement. Crop & Pasture Science. 2012;63:1043–1065. [Google Scholar]
- McKenzie N, Jacquier D, Isbell R, Brown K. An illustrated compendium. Australia: CSIRO Publishing; 2004. Australian soils and landscapes. [Google Scholar]
- Nagel KA, Schurr U, Walter A. Dynamics of root growth stimulation in Nicotiana tabacum in increasing light intensity. Plant, Cell and Environment. 2006;29:1936–1945. doi: 10.1111/j.1365-3040.2006.01569.x. [DOI] [PubMed] [Google Scholar]
- O'Brien L. Genetic variability of root growth in wheat (T. aestivum L.) Australian Journal of Agricultural Research. 1979;30:587–595. [Google Scholar]
- O'Toole JC, Bland WL. Genotypic variation in crop plant root systems. Advances in Agronomy. 1987;41:91–145. [Google Scholar]
- Passioura JB. Roots and drought resistance. Agricultural Water Management. 1983;7:265–280. [Google Scholar]
- Rahnama A, Munns R, Poustini K, Watt M. A screening method to identify genetic variation in root growth response to a salinity gradient. Journal of Experimental Botany. 2011;62:69–77. doi: 10.1093/jxb/erq359. [DOI] [PubMed] [Google Scholar]
- Richards RA, Lukacs Z. Seedling vigour in wheat – sources of variation for genetic and agronomic improvement. Australian Journal of Agricultural Research. 2002;53:41–50. [Google Scholar]
- Richards RA, Rebetzke GJ, Watt M, Condon AG, Spielmeyer W, Dolferus R. Breeding for improved water productivity in temperate cereals: phenotyping, quantitative trait loci, markers and the selection environment. Functional Plant Biology. 2010;37:85–97. [Google Scholar]
- Sanguineti MC, Li S, Maccaferri M, et al. Genetic dissection of seminal root architecture in elite durum wheat germplasm. Annals of Applied Biology. 2007;151:291–305. [Google Scholar]
- Sharma S, Bhat PR, Ehdaie B, Close TJ, Lukaszewski AJ, Waines JG. Integrated genetic map and genetic analysis of a region associated with root traits on the short arm of rye chromosome 1 in bread wheat. Theoretical and Applied Genetics. 2009;119:783–793. doi: 10.1007/s00122-009-1088-0. [DOI] [PMC free article] [PubMed] [Google Scholar]
- Siddique KHM, Belford RK, Perry MW, Tennant D. Growth, development and light interception of old and modern wheat cultivars in a mediterranean-type environment. Australian Journal of Agricultural Research. 1989;40:473–487. [Google Scholar]
- Smucker AJM, McBurney SL, Srivastava AK. Quantitative separation of roots from compacted soil profiles by the hydropneumatic elutriation system. Agronomy Journal. 1982;74:500–503. [Google Scholar]
- Spielmeyer W, Hyles J, Joaquim P, et al. A QTL on chromosome 6A in bread wheat (Triticum aestivum) is associated with longer coleoptiles, greater seedling vigour and final plant height. Theoretical and Applied Genetics. 2007;115:59–66. doi: 10.1007/s00122-007-0540-2. [DOI] [PubMed] [Google Scholar]
- Tennant D. Wheat root penetration and total available water on a range of soil types. Australian Journal of Experimental Agriculture and Animal Husbandry. 1976;16:570–577. [Google Scholar]
- Wahbi A, Gregory PJ. Genotypic differences in root and shoot growth of barley (Hordeum vulgare). II. Field studies of growth and water use of crops grown in Northern Syria. Experimental Agriculture. 1989;25:389–399. [Google Scholar]
- Watt M, Kirkegaard JA, Rebetzke GJ. A wheat genotype developed for rapid leaf growth copes well with the physical and biological constraints of unploughed soil. Functional Plant Biology. 2005;32:695–706. doi: 10.1071/FP05026. [DOI] [PubMed] [Google Scholar]
- Watt M, Magee LJ, McCully ME. Types, structure and potential for axial water flow in the deepest roots of field-grown cereals. New Phytologist. 2008;178:135–146. doi: 10.1111/j.1469-8137.2007.02358.x. [DOI] [PubMed] [Google Scholar]
- White RG, Kirkegaard JA. The distribution and abundance of wheat roots in a dense, structured subsoil – implications for water uptake. Plant, Cell and Environment. 2010;33:133–148. doi: 10.1111/j.1365-3040.2009.02059.x. [DOI] [PubMed] [Google Scholar]