Abstract
Purpose:
This work investigated if treatment with caffeine or 2,4-dinitrophenol (DNP) induce expression of peroxisome proliferator-activated receptor coactivator 1 alpha (PGC-1α) and increase both mitochondrial biosynthesis and metabolism in skeletal muscle.
Methods:
Human rhabdomyosarcoma cells were treated with either ethanol control (0.1% final concentration) caffeine, or DNP at 250 or 500 μM for 16 or 24 hours. PGC-1α RNA levels were determined using quantitative reverse transcriptase polymerase chain reaction (qRT-PCR). PGC-1α protein and mitochondrial content was determined using flow cytometry and immunohistochemistry. Metabolism was determined by quantification of extracellular acidification rate and oxygen consumption rate.
Results:
Treatment with either caffeine or DNP induced PGC-1α RNA and protein as well as mitochondrial content compared with control. Treatment with caffeine and DNP also significantly increased oxidative metabolism and total metabolic rate compared with control. Caffeine similarly increased metabolism and mitochondrial content compared with DNP.
Conclusion:
This work identified that both caffeine and DNP significantly induce PGC-1α, and increase both metabolism and mitochondrial content in skeletal muscle.
Keywords: mitochondrial biosynthesis, extracellular acidification rate (ECAR), oxygen consumption rate (OCR), metabolic syndrome, PGC-1α, electron transport
Video Abstract
Available from http://la-press.com/t.php?i=10233
Background
Obesity is a preventable risk factor that contributes significantly to premature death and increasing health care costs.1,2 Chemical agents have been of interest for their possible role in enhancing metabolic rate to ameliorate obesity. Agents such as 2,4-dinitrophenol (DNP) uncouple oxidative phosphorylation and reduce ATP production,3–5 which increases metabolic rate.6 DNP was classified as a cosmetic agent used for weight loss during the 1930s and was later removed from sale due to lethality.6 Recently, a new interest in the potential benefits of chemical uncouplers and other metabolic stimulators has arisen because of effects they may have on metabolism, including mitochondrial biosynthesis and increased fatty acid oxidation.7–12
Caffeine is one of the most commonly consumed ergogenic aids that have been shown to increase metabolic rate.13 Caffeine increases metabolism through binding of phosphodiesterase resulting in increased cyclic adenosine monophosphate (cAMP).13 Increasing cAMP activates 5′ AMP-activated protein kinase (AMPK), protein kinase A, and cAMP response element-binding causing the transcription of genes associated with increased fat oxidation.14–16
Like caffeine, DNP induces AMPK by uncoupling electron transport resulting in an increased AMP:ATP ratio.17 Although not completely characterized, AMPK works with calmodulin, Ca2+/calmodulin-dependent protein kinases II (CaMK), and calcium homeostasis to control cellular energetics and metabolism, including mitochondrial biosynthesis.18
Peroxisome proliferator-activated receptor coactivator 1 alpha (PGC-1α) is an essential precursor to mitochondrial biosynthesis found in most cells including muscle.19–22 PGC-1α functions as a transcriptional coactivator responsible for regulating genes involved in energy homeostasis and metabolism.19–21 PGC-1α interacts with several complexes including cAMP receptor element binding protein (CREB) and peroxisome proliferator-activated receptor alpha (PPARα) which increases fatty acid oxidation.7,9,10,23 Treatment with uncoupling agents including DNP induces PGC-1α in fibroblasts.12 Similarly, caffeine consumption has been shown to induce PGC-1α in a similar fashion to DNP and has been documented in both rodent and human skeletal muscle.24–27 Further research should be performed to identify effects of caffeine on metabolism and mitochondrial biosynthesis as it relates to potent metabolic stimulators like DNP and the possible benefits for diminishing obesity and metabolic malfunction.
This work explored the effects on mitochondrial biosynthesis of caffeine and DNP in human rhabdomyosarcoma cells, a model organism for metabolic observation.16 We show that treatment of muscle cells with caffeine or DNP will induce the PGC-1α mRNA and protein in a dose- and time-sensitive manner. We also demonstrate that caffeine or DNP increases mitochondrial content as well as enhances oxidative and total metabolism. These are the first observations that directly compare caffeine with DNP and demonstrate the effects of both treatments on glycolytic and oxidative metabolism in skeletal muscle cells.
Methods
Cell culture
Homo sapien rhabdomyosarcoma cells were purchased from ATCC (Manassas, VA) and were cultured in Dulbecco’s Modified Eagle’s Medium (DMEM) containing 4500 mg/L glucose and supplemented with 10% heat-inactivated fetal bovine serum (FBS) and 100 U/mL penicillin/streptomycin in a humidified 5% CO2 atmosphere at 37°C. Trypsin-EDTA at 0.25% was used to detach the cells for splitting and re-culturing. Stock DNP and caffeine from Sigma (St. Louis, MO) were dissolved in ethanol to create treatment solutions of 250 μM and 500 μM determined through pilot experiments with DNP to significantly increase PGC-1α RNA.
RNA extraction and quantification
PGC-1α mRNA expression was quantified by quantitative reverse transcriptase polymerase chain reaction (qRT-PCR). Cells were plated into 12-well plates at a density of 5 × 10⁵ cells/well; treated with either ethanol control (0.1% final concentration) DNP at 250 μM or 500 μM, or caffeine at 250 μM or 500 μM; and incubated as described above for 16 or 24 hours. Following incubation, total cell RNA was extracted using RNeasy Kit from Qiagen (Valencia, CA) per manufacturer’s protocol. Total RNA was quantified by Nanodrop spectrophotometry. cDNA was synthesized from 5000 ng total RNA using the Retroscript RT kit from Ambion (Austin, TX) according to manufacturer’s instructions. PCR primers were designed using Primer Express software from Invitrogen (Carlsbad, CA) and synthesized by Integrated DNA Technologies (IDT, Coralville, IA). For PGC-1α, the forward primer was 5′-ACCAAACCCACAGAGAACAG-3′ and the reverse primer was 5′-GGGTCAGAGGAAGA GATAAAGTTG-3′. Amplification of PGC-1α was normalized to the housekeeping gene, TATA Binding Protein (TBP). For TBP, the forward primer was 5′-CACGAACCACGGCACTGATT-3′ and the reverse primer was 5′-TTTTCTTGCTGCCAGTCTGGAC-3′. qRT-PCR reactions were performed in triplicate using the LightCycler 480 real-time PCR system from Roche Applied Science (Indianapolis, IN). SYBR Green based PCR was performed in triplicate using 5000 ng of cDNA per sample; final primer concentrations were 10 μM in a total volume of 30 μL. The following cycling parameters were used: 95°C for 10 minutes followed by 45 cycles of 95°C for 15 seconds, and 60°C for 1 minute. Relative expression levels were determined by the ΔΔCp method.
Flow cytometry
Cells were seeded in 6-well plates at a density of 1.2 × 10⁶ cells/well, treated in triplicate, and incubated as described above. Flow cytometry was performed to determine PGC-1α protein levels. Cells were permeabilized with 0.5% Tween 20 from Sigma (St. Louis, MO) in PBS for 10 minutes and then blocked for 1 hour with 3.0% BSA from Sigma (St. Louis, MO) in PBS with 0.5% Tween 20. Cells were stained with an anti-PGC-1α primary polyclonal antibody from Santa Cruz Biotechnologies (Santa Cruz, CA) at 1:200 dilution in PBS with 0.5% Tween 20% and 3.0% BSA overnight. The cells were rinsed with PBS with 0.5% Tween 20% and 3.0% BSA, and secondary anti-rabbit AlexFluor 488 antibody from Invitrogen (Carlsbad, CA) was applied in 1:200 dilution in PBS with 0.5% Tween 20% and 3.0% BSA. The cells were rinsed and suspended in PBS. Group mean fluorescence was measured using Facscalibur filtering 488 nm.
To determine mitochondrial content, the cells were suspended in pre-warmed media with 200 nM Mitotracker Green from Life Technologies (Carlsbad, CA) per manufacture’s protocol and incubated for 45 minutes. The media containing Mitotracker was removed and the cells were re-suspended in pre-warmed media. Group mean fluorescence was measured as described above.
Microscopy and immunohistochemistry
Chamber slides from BD Bioscience (Sparks, MD) were seeded with 5000 cells/well. To verify PGC-1α protein expression, cells were cultured and treated for 24 hours as described above. Cells were fixed using 3.7% formaldehyde in media, permeabilized with PBS with 0.1% Triton 100X from Sigma (St. Louis, MO) for 10 minutes, and blocked for 1 hour with PBS with 0.1% Triton 100X and 3.0% BSA from Sigma (St. Louis, MO). Cells were stained with an anti-PGC-1α primary polyclonal antibody from Santa Cruz Biotechnologies (Santa Cruz, CA) at 1:200 dilution in PBS with 0.1% BSA overnight. The cells were rinsed with PBS with 0.1% Triton 100X and 3.0% BSA, and secondary anti-rabbit AlexFluor 633 antibody from Invitrogen (Carlsbad, CA) was applied in 1:200 dilution. Slides were mounted with Prolong Gold with DAPI from Invitrogen (Carlsbad, CA) and cured overnight. Cells were imaged using the Axiovert 25 microscope with AxioCam MRc from Zeiss (Thornwood, NY). To verify increased mitochondrial content, the cells were then stained with Mitotracker 200 nM from Invitrogen (Carlsbad, CA) for 45 minutes and fixed in 3.7% formaldehyde in pre-warmed media. Cells were mounted, cured, and imaged as described above.
Metabolic assay
Cells were seeded overnight in a 24-well culture plate from SeaHorse Bioscience (Billerica, MA) at density 5 × 10⁵ cells/well. Cells were treated and incubated for 24 hours as described above. Following treatment, culture media was removed and replaced with XF Assay Media from SeaHorse Bioscience (Billerica, MA) containing 4500 mg/L glucose free of CO2 and incubated at 37°C. Per manufactures’ protocol, SeaHorse injection ports were loaded with oligomycin, an inhibitor of oxidative metabolism that maximizes glycolytic metabolism (final concentration 1.0 μM), carbonyl cyanide p-(trifluoromethoxy)-phenyl-hydrazone (FCCP), an uncoupler of electron transport that maximizes oxidative metabolism (final concentration 1.25 μM), and rotenone in 1.0 μM final concentration. Extracellular acidification, an indicator of glycolytic capacity, and oxygen consumption, an indicator of oxidative metabolism, were measured using the SeaHorse XF24 Extracellular Analyzer from SeaHorse Bioscience (Billerica, MA). SeaHorse XF24 Extracellular Analyzer was run using 8-minute cyclic protocol commands (mix for 3 minutes, let stand 2 minutes, and measure for 3 minutes) in triplicate.
WST-1 assay
Cells were seeded in 96-well plates at a density of 5000 cells/well and grown overnight. Cells were treated and incubated as previously described for 16 or 24 hours. Media and treatment were removed at each time point and media containing 10% WST1 assay Roche Applied Science (Indianapolis, IN) were added to each well and incubated as previously described. Following WST1 addition, fluorescence was measured for 1 hour using Wallac Victor3V 1420 Multilabel Counter from PerkinElmer (Waltham, MA).
Cell counting and viability
Cells were treated and incubated as described above for 16 or 24 hours. Trypan blue from Sigma (St Louis, MO) was used to assess cell number and viability measured using a CountessTM cell quantification system from Invitrogen (Carlsbad, CA).
Statistics
RNA gene expression data were analyzed using Student t test of mean difference between groups generated by ΔΔCp. WST-1 cell metabolism, oxygen consumption, extracellular acidification, and flow cytometry were analyzed using ANOVA and pairwise comparisons comparing treatments with control. WST-1 cell metabolism assay data was transformed to show relative metabolism with control = 1. Chi-square test was used to analyze total metabolic capacity indicated by OCR/ECAR. Cell viability was analyzed using Student t test. Values of P < 0.05 indicated statistical significance in all tests used, and Bonferroni adjustment for error from multiple pairwise comparisons was used.
Results
PGC-1α induction and expression
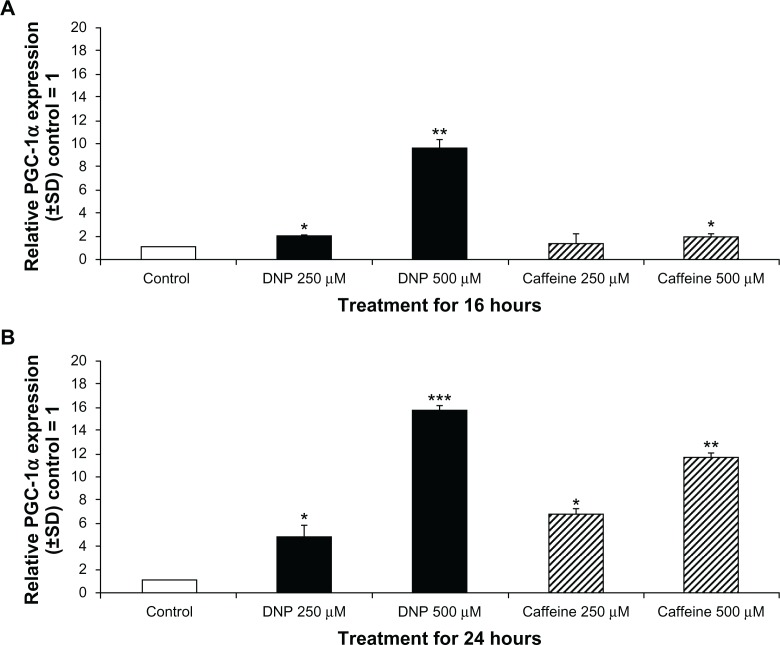
PGC-1α RNA was significantly induced in cells treated with either DNP or caffeine compared with the control group. Treatment with DNP at 250 and 500 μM for 16 hours significantly induced PGC-1α expression almost 10 fold (Fig. 1A). Treatment with caffeine at 500 μM for 16 hours also significantly induced PGC-1α expression. Following 24-hour treatment both DNP and caffeine at 250 and 500 μM significantly induced PGC-1α expression (Fig. 1B).
Figure 1.
Changes in PGC-1α RNA expression. (A) Relative RNA expression of PGC-1α of rhabdomyosarcoma cells treated with either ethanol control (final concentration 0.1%), DNP at 500 or 250 μM, or caffeine at 500 or 250 μM for 16 hours with control = 1.
Notes: Relative RNA expression of PGC-1α of cells treated as described above for 24 hours with control = 1. * indicates P < 0.05, ** indicates P < 0.01, and *** indicates P < 0.001 compared with control.
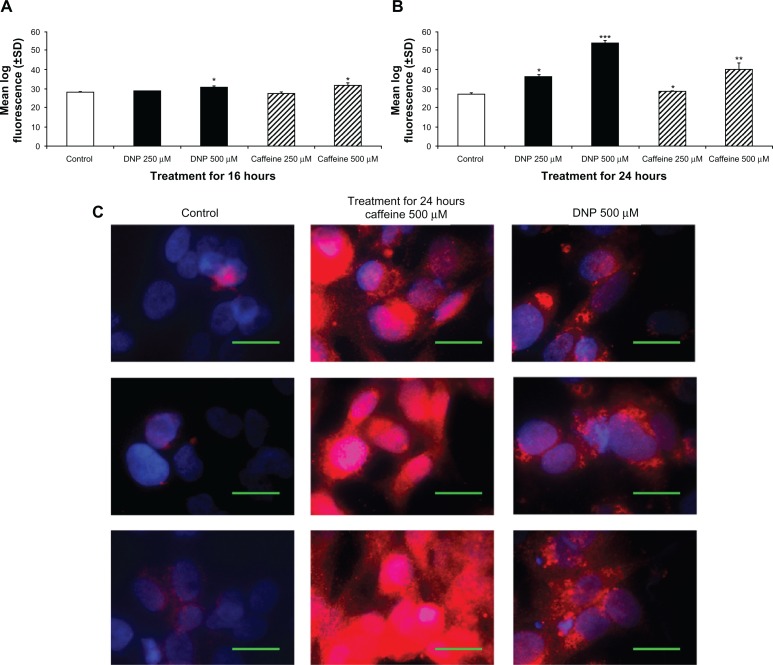
To determine PGC-1α protein, we measured fluorescence of cells stained with a PGC-1α specific antibody via flow cytometry. Similar to RNA, PGC-1α protein was also significantly elevated in cells treated with either DNP or caffeine for 16 or 24 hours. Following treatment for 16 hours, both caffeine and DNP at 500 μM significantly increased PGC-1α protein staining compared with control (Fig. 2A). After 24 hours of treatment, both DNP and caffeine at 250 or 500 μM significantly increased PGC-1α protein staining compared with control (Fig. 2B). Increased PGC-1α protein levels were verified using microscopy which confirmed that treatment with DNP or caffeine for 24 hours significantly induced PGC-1α protein expression (Fig. 2C).
Figure 2.
Changes in PGC-1α protein. (A) Group mean log fluorescence from flow cytometry of rhabdomyosarcoma cells treated with either ethanol control (final concentration 0.1%), DNP at 500 or 250 μM, or caffeine at 500 or 250 μM for 16 hours stained with PGC-1α primary antibody and AlexaFluor 488 secondary antibody. (B) Group mean log fluorescence from flow cytometry of cells treated as described above for 24 hours. (C) Microscopy of cells treated as described above for 24 hours and stained with PGC-1α primary antibody and AlexaFluor 533 secondary antibody (red) and DAPI (blue).
Notes: Green bar denotes 50 μm. * indicates P < 0.05, ** indicates P < 0.01, and *** indicates P < 0.001 compared with control.
Mitochondrial content
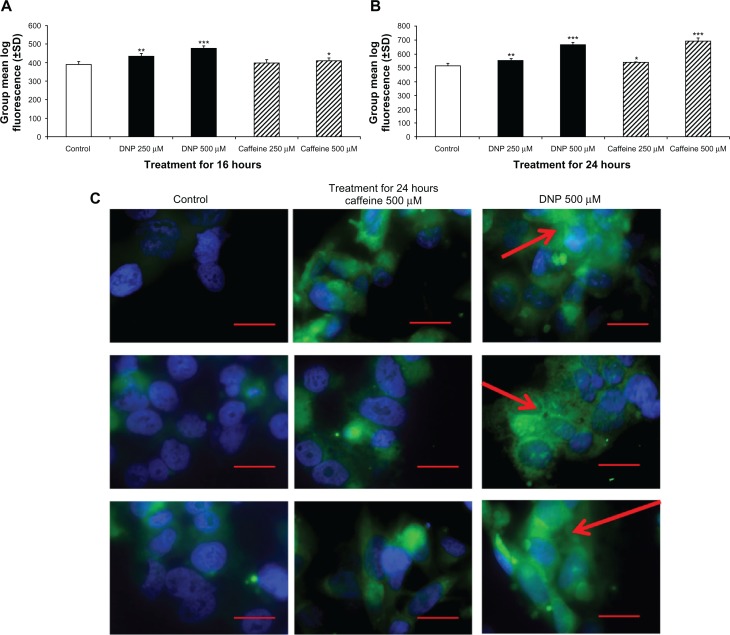
Mitochondrial content was quantified by Mitotracker Green staining and measured by flow cytometry. Cells treated with DNP and caffeine had significantly more mitochondrial content compared with the control group. Treatment with DNP at 250 and 500 μM or caffeine at 500 μM for 16 hours significantly induced mitochondrial staining in a time- and dose-dependent manner (Fig. 3A). Treatment with caffeine or DNP at 250 and 500 μM for 24 hours also significantly induced mitochondrial content compared with control (Fig. 2A). Increased mitochondrial content in cells treated with either caffeine or DNP at 250 and 500 μM for 24 hours was verified using microscopy with Mitotracker staining (Fig. 3C). Treated cells consistently exhibited greater mitochondrial staining intensity and networking (Fig. 3C).
Figure 3.
Changes in mitochondrial content. (A) Group mean log fluorescence from flow cytometry of rhabdomyosarcoma cells treated with either ethanol control (final concentration 0.1%), DNP 500 or 250 μM, or caffeine at 500 or 250 μM for 16 hours stained with 200 nM Mitotracker Green. (B) Group mean log fluorescence from flow cytometry of cells treated and stained as described above for 24 hours. (C) Microscopy of cells treated as described above for 24 hours and stained with Mitotracker (green) and DAPI (blue).
Notes: Red bar denotes 50 μm and red arrow denotes mitochondrial networking.
Metabolic characteristics
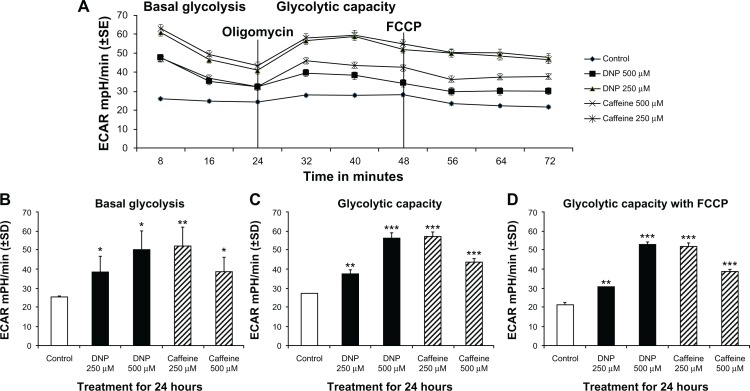
Extracellular acidification rate (ECAR), a measure of glycolytic rate, was significantly elevated in cells treated with either DNP or caffeine for 24 hours compared with control (Fig. 4A). Basal glycolysis of cells treated with DNP at 250 or 500 μM was significantly increased by 53% and 100% respectively (Fig. 4B). Total glycolytic capacity was also significantly elevated in cells treated with DNP at 250 or 500 μM, which showed an increase of 33% and 120% respectively compared with control (Fig. 4D). Basal glycolysis of cells treated with caffeine at 250 or 500 μM was also significantly increased by 107% and 54% respectively (Fig. 4B) as was total glycolytic capacity, which was significantly elevated 115% and 64% respectively (Fig. 4D). (Note that FCCP was also added as an essential component of the oxidative stress kit and has no pronounced effect on glycolytic capacity.)
Figure 4.
(A) Group mean extracellular acidification (ECAR) in mpH/min of rhabdomyosarcoma cells treated with either ethanol control (final concentration 0.1%), DNP at 500 or 250 μM, or caffeine at 500 or 250 μM for 24 hours. (B) Basal ECAR of cells treated as described above for 24 hours. (C) Maximum ECAR of cells treated as described above for 24 hours following addition of oligomycin. (D) Maximum ECAR of cells treated as described above for 24 hours following with FCCP in addition to oligomycin.
Notes: * indicates P < 0.05, ** indicates P < 0.01, and *** indicates P < 0.001 compared with control.
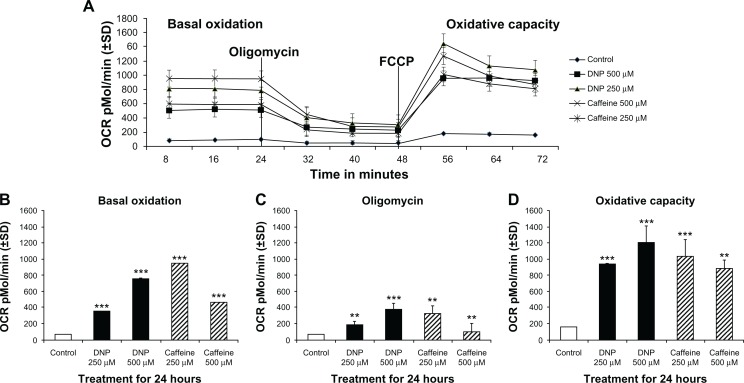
Oxygen consumption rate (OCR), a measure of oxidative metabolism, was also significantly elevated in cells treated with either DNP or caffeine at 250 or 500 μM for 24 hours compared with control (Fig. 5A). Basal oxidative metabolism of cells treated with DNP at 250 or 500 μM was significantly increased by roughly 540% and 861% respectively compared with control (Fig. 5B). Total oxidative capacity was also significantly elevated roughly 550% and 700% above the control in cells treated with DNP at 250 or 500 μM respectively (Fig. 5D). Caffeine-treated cells exhibited similar increases in basal oxidation with 250 μM caffeine significantly increasing OCR roughly 900% compared with control and caffeine at 500 μM increasing OCR over 500% (Fig. 5B). Total oxidative capacity was also significantly elevated in cells treated with caffeine at 250 or 500 μM increasing OCR capacity 611% and 525% respectively (Fig. 5D).
Figure 5.
(A) Group mean oxygen consumption rate (OCR) in pMol/min of rhabdomyosarcoma cells treated with either ethanol control (final concentration 0.1%), DNP at 500 or 250 μM, or caffeine at 500 or 250 μM for 24 hours. (B) Basal OCR of cells treated as described above for 24 hours. (C) OCR of cells treated as described above for 24 hours following addition of oligomycin (Proton Leak). (D) Maximum OCR of cells treated as described above for 24 hours following with FCCP in addition to oligomycin.
Notes: * indicates P < 0.05, ** indicates P < 0.01, and *** indicates P < 0.001 compared with control.
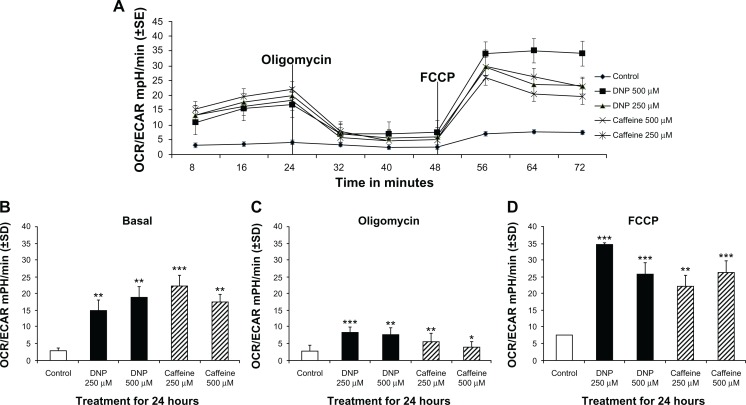
Relative metabolic reliance was significantly altered in cells treated with either DNP or caffeine compared with control (Fig. 6A). Basal reliance on oxidative metabolism, quantified as a ratio of OCR:ECAR, was significantly greater in cells treated with either DNP or caffeine at either dose compared with the control group (Fig. 6B). Following metabolic stress (addition of oligomycin and FCCP), reliance on oxidative metabolism was also significantly greater in treated groups when compared with control group (Fig. 6D).
Figure 6.
(A) Group mean OCR/ECAR in mpH/min of rhabdomyosarcoma cells treated with either ethanol control (final concentration 0.1%), DNP at 500 or 250 μM, or caffeine at 500 or 250 μM for 24 hours. (B) Basal OCR/ECAR of cells treated as described above for 24 hours. (C) OCR/ECAR of cells treated as described above for 24 hours following addition of oligomycin. (D) Maximum OCR/ECAR of cells treated as described above for 24 hours following with FCCP in addition to oligomycin.
Notes: * indicates P < 0.05, ** indicates P < 0.01, and *** indicates P < 0.001 compared with control.
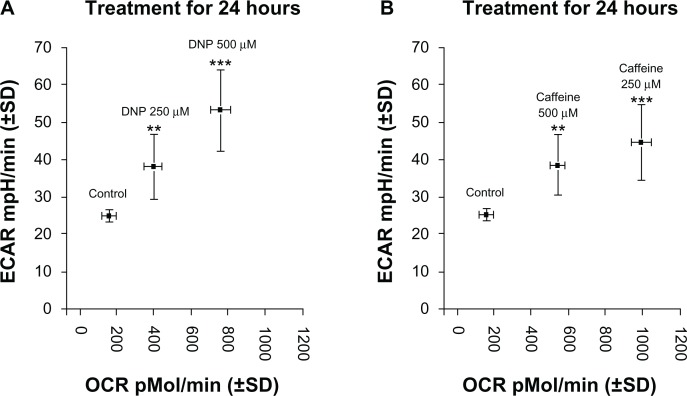
Cells treated with either DNP or caffeine showed increased ECAR and OCR compared with control, evidence of an increase in total metabolic rate. Treatment of cells with DNP at 250 or 500 μM significantly increased total metabolism in a stepwise, dose-dependent fashion (Fig. 7A). Cells treated with caffeine at 250 or 500 μM significantly increased total metabolism; however, caffeine at 250 μM increased metabolic rate to a greater extent than caffeine at 500 μM (Fig. 7B).
Figure 7.
(A) Group mean change in metabolism (ECAR:OCR) of rhabdomyosarcoma cells treated with either ethanol control (final concentration 0.1%) DNP at 500 or 250 μM, or caffeine at 500 or 250 μM for 24 hours. (B) Group mean change in metabolism (ECAR:OCR) of cells treated with either ethanol control (final concentration 0.1%) or caffeine at 500 or 250 μM for 24 hours.
Notes: * indicates P < 0.05, ** indicates P < 0.01, and *** indicates P < 0.001 compared with control.
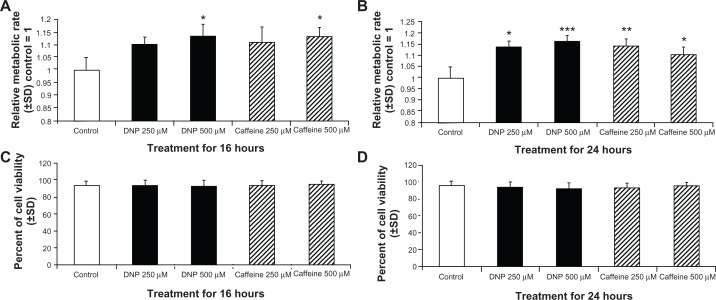
In order to further verify our observations of metabolic change, we measured total metabolism by measuring log fluorescence of a WST-1 end point assay following treatment as described above for 16 or 24 hours. Treatment for 16 hours with DNP and caffeine at 500 μM significantly increased metabolic rate compared with control (Fig. 8A). After 24 hours of treatment, both caffeine or DNP at 250 μM and 500 μM significantly increased metabolic rate compared with control (Fig. 8B). Cell viability was unchanged from control levels following treatment with caffeine or DNP at 250 μM and 500 μM for 16 or 24 hours (Fig. 8C and D, respectively).
Figure 8.
(A and B) Group mean relative metabolic rate from WST-1 end point assay of rhabdomyosarcoma cells treated with either ethanol control (final concentration 0.1%), DNP at 500 or 250 μM, or caffeine at 500 or 250 μM for 16 hours (A) or 24 hours (B). (C and D) Group mean cell viability cells treated as described above for 16 hours (C) or 24 hours (D).
Notes: * indicates P < 0.05, ** indicates P < 0.01, and *** indicates P < 0.001 compared with control.
Discussion
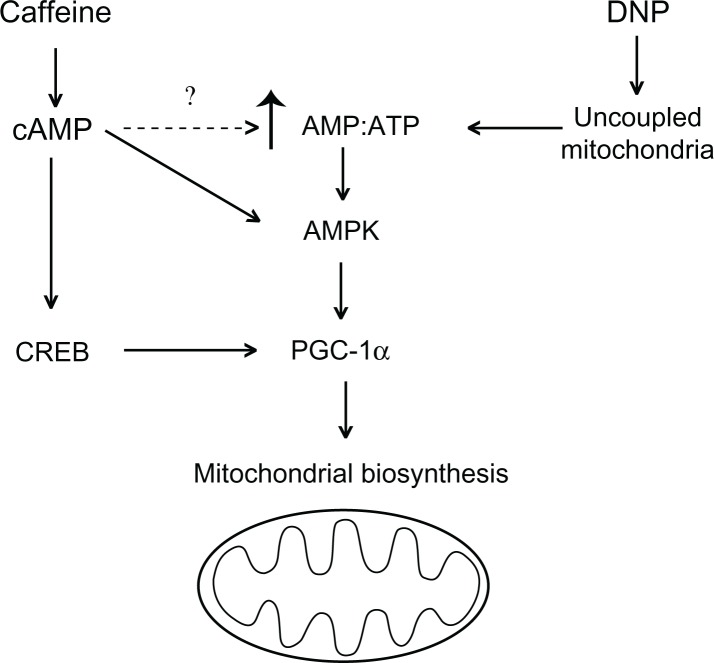
This work identified several interesting effects that metabolic stimulators DNP and caffeine have on metabolism in human skeletal muscle. First, both DNP and caffeine significantly induced PGC-1α RNA and protein in a time- and dose-dependent manner. Secondly, both DNP and caffeine increased mitochondrial biosynthesis and/or mitochondrial content. Interestingly, there was no difference in mitochondrial content of cells treated with either 500 μM DNP or caffeine at 500 μM for 24 hours, despite variations in PGC-1α induction and expression. This evidence supports the hypothesis that caffeine similarly induces mitochondrial biosynthesis compared with DNP. Treatment with DNP or caffeine significantly raised metabolic rate without altering cell viability at 24 hours. Moreover, caffeine equally increased oxidative metabolism compared with DNP, which is surprising because DNP increases oxygen consumption by creating a futile cycle of electron transport through uncoupling oxidative phosphorylation (Fig. 7). Caffeine does not function as a uncoupling agent; therefore, we attribute, in part, the increased respiratory effect of caffeine treatment to increased mitochondrial content. Lastly, our working hypothesis for these experiments was that DNP increases PGC-1α through documented inductions of AMPK.17,18 Similarly, we theorized that caffeine activated AMPK but also increased CREB activity as a result of increased cAMP to induced PGC-1α and mitochondrial biosynthesis (Fig. 9).
Figure 9.
Working hypothesis of caffeine and DNP mechanism of PGC-1α induction leading to increased mitochondrial biosynthesis.13–18
Abbreviations: cAMP, cyclic adenosine monophosphate; AMPK, 5′ AMP-activated protein kinase; CREB, cAMP receptor element binding protein; PGC-1α, peroxisome proliferator-activated receptor coactivator 1 alpha.
Caffeine is widely consumed by a variety of people ranging from weight loss seekers to the sedentary and elderly and is, therefore, of great physiological importance. These observations demonstrate that readily available food substrates and phytochemicals may be as effective at stimulating metabolism as potent and historically toxic DNP. We demonstrate that caffeine heightens metabolic rate like DNP and promotes cellular adaptations that encourage oxidative metabolism. This suggests that exposure to caffeine induces a greater propensity for fat oxidation in skeletal muscle. These hypotheses warrant further investigation to determine if caffeine-containing products available over the counter (such as dietary supplements) possess the same enhanced metabolic effect as research-grade caffeine.
Conclusion
Obesity is a major health and economic concern for many developed countries with no foreseeable resolution in sight. Several products are purported to increase metabolism and fat loss, many of which contain caffeine. From our data we gather that caffeine stimulates metabolism and favorable mitochondrial production similar to DNP without the documented toxicity. Our findings support the advertised metabolic benefits of caffeine, making it a potential contributor in humanity’s struggle against obesity. Our observations warrant further investigation to determine if caffeine-containing products available over the counter (such as dietary supplements) or foods and beverages possess the same effects as research-grade caffeine.
Acknowledgments
We would like to thank Virginia Severns for her technical assistance with the LightCycler 480. We would also like to thank Dr. William Anderson, Dr. Marcy Osgood, and Dr. Scott James for their help in formatting and professional advice for this work.
Footnotes
Funding Sources
No funding was received for this work.
Competing Interests
All authors and contributors disclose no potential conflicts of interest.
Author Contributions
Conceived and designed the experiments: RAV, MB, CAC. Analyzed the data: RAV, MB. Wrote the first draft of the manuscript: RAV. Contributed to the writing of the manuscript: RAV, MB, KT, CAC. Agree with manuscript results and conclusions: RAV, MB, KT, CAC. Jointly developed the structure and arguments for the paper: RAV, MB, KT, CAC. Made critical revisions and approved final version: RAV, MB, KT, CAC. All authors reviewed and approved of the final manuscript. RAV, RG, MB, KT, CAC
Disclosures and Ethics
As a requirement of publication, author(s) have provided to the publisher signed confirmation of compliance with legal and ethical obligations including but not limited to the following: authorship and contributorship, conflicts of interest, privacy and confidentiality, and (where applicable) protection of human and animal research subjects. The authors have read and confirmed their agreement with the ICMJE authorship and conflict of interest criteria. The authors have also confirmed that this article is unique and not under consideration or published in any other publication and that they have permission from rights holders to reproduce any copyrighted material. Any disclosures are made in this section. The external blind peer reviewers report no conflicts of interest.
Supplementary Data
A video abstract by the authors of this paper is available.
References
- 1.Flegal KM, Carroll MD, Ogden CL, Johnson CL. Prevalence and trends in obesity among US adults, 1999–2000. JAMA. 2002 Oct;288(14):1723–7. doi: 10.1001/jama.288.14.1723. [DOI] [PubMed] [Google Scholar]
- 2.Centres for Disease Control and Prevention. Study estimates medical cost of obesity may be as high as $147 billion annually [press release]. July 27, 2009: http://www.cdc.gov/media/pressrel/2009/r090727.htm. Accessed Apr 24, 2010.
- 3.Desquiret V, Loiseau D, Jacques C, et al. Dinitrophenol-induced mitochondrial uncoupling in vivo triggers respiratory adaptation in HepG2 cells. Biochim Biophys Acta. 2006;1757(1):21–30. doi: 10.1016/j.bbabio.2005.11.005. [DOI] [PubMed] [Google Scholar]
- 4.Joel CD, Neaves WB, Rabb JM. Mitochondria of brown fat-oxidative phosphorylation sensetive to 2,4-Dinitrophenol. Biochem Biophys Res Commun. 1967;29(4):490–9. doi: 10.1016/0006-291x(67)90510-4. [DOI] [PubMed] [Google Scholar]
- 5.Sibille B, Keriel C, Fontaine E, Catelloni F, Rigoulet M, Leverve XM. Octanoate affects 2,4-dinitrophenol uncoupling in intact rat hepatocytes. Eur J Biochem. 1995;231(2):498–502. doi: 10.1111/j.1432-1033.1995.tb20724.x. [DOI] [PubMed] [Google Scholar]
- 6.Scheindlin S. Obesity, body image and diet drugs: 100 years of change. Mol Interv. 2008;8(2):64–9. doi: 10.1124/mi.8.2.2. [DOI] [PubMed] [Google Scholar]
- 7.Yoon JC, Puigserver P, Chen GX, et al. Control of hepatic gluconeogenesis through the transcriptional coactivator PGC-1. Nature. 2001;413(6852):131–8. doi: 10.1038/35093050. [DOI] [PubMed] [Google Scholar]
- 8.Yoon JC, Xu G, Deeney JT, et al. Suppression of beta cell energy metabolism and insulin release by PGC-1 alpha. Dev Cell. 2003;5(1):73–83. doi: 10.1016/s1534-5807(03)00170-9. [DOI] [PubMed] [Google Scholar]
- 9.Puigserver P, Rhee J, Donovan J, et al. Insulin-regulated hepatic gluconeogenesis through FOXO1-PGC-1 alpha interaction. Nature. 2003;423(6939):550–5. doi: 10.1038/nature01667. [DOI] [PubMed] [Google Scholar]
- 10.Vega RB, Huss JM, Kelly DP. The coactivator PGC-1 cooperates with peroxisome proliferator-activated receptor alpha in transcriptional control of nuclear genes encoding mitochondrial fatty acid oxidation enzymes. Mol Cell Biol. 2000;20(5):1868–76. doi: 10.1128/mcb.20.5.1868-1876.2000. [DOI] [PMC free article] [PubMed] [Google Scholar]
- 11.Mootha VK, Handschin C, Arlow D, et al. Err alpha and Gabpa/b specify PGC-1 alpha-dependent oxidative phosphorylation gene expression that is altered in diabetic muscle. Proc Natl Acad Sci U S A. 2005;102(29):10405–12. doi: 10.1073/pnas.0401401101. [DOI] [PMC free article] [PubMed] [Google Scholar]
- 12.Rohas LM, St-Pierre J, Uldry M, Jager S, Handschin C, Spiegelman BM. A fundamental system of cellular energy homeostasis regulated by PGC-1 alpha. Proc Natl Acad Sci U S A. 2007;104(19):7933–8. doi: 10.1073/pnas.0702683104. [DOI] [PMC free article] [PubMed] [Google Scholar]
- 13.Rahimi R, Ghiasi S, Azimi H, Fakhari S, Abdollahi M. A review of the herbal phosphodiesterase inhibitors; Future perspective of new drugs. Cytokine. 2010;49(2):123–9. doi: 10.1016/j.cyto.2009.11.005. [DOI] [PubMed] [Google Scholar]
- 14.Egawa T, Hamada T, Ma X, et al. Caffeine activates preferentially alpha 1-isoform of 5′ AMP-activated protein kinase in rat skeletal muscle. Acta Physiol (Oxf) 2011;201(2):227–38. doi: 10.1111/j.1748-1716.2010.02169.x. [DOI] [PubMed] [Google Scholar]
- 15.Avila G, Aguilar CI, Ramos-Mondragon R. Sustained CGRP1 receptor stimulation modulates development of EC coupling by cAMP/PKA signalling pathway in mouse skeletal myotubes. J Physiol. 2007;584(1):47–57. doi: 10.1113/jphysiol.2007.137687. [DOI] [PMC free article] [PubMed] [Google Scholar]
- 16.Carrasco MA, Muller M, Cardenas C, Quest A, Behrens MI, Jaimovich E. Role of calcium and PKC in CREB phosphorylation induced by depolarization in skeletal muscle cells in culture. Abstr Soc Neurosci. 2001;27(1):1296. [Google Scholar]
- 17.Pelletier A, Joly E, Prentki M, Coderre L. Adenosine 5′-monophosphate-activated protein kinase and p38 mitogen-activated protein kinase participate in the stimulation of glucose uptake by dinitrophenol in adult cardiomyocytes. Endocrinology. 2005:146. doi: 10.1210/en.2004-1565. [DOI] [PubMed] [Google Scholar]
- 18.Ojuka EO. Role of calcium and AMP kinase in the regulation of mitochondrial biogenesis and GLUT4 levels in muscle. Proc Nutr Soc. 2004;63:275–8. doi: 10.1079/PNS2004339. [DOI] [PubMed] [Google Scholar]
- 19.Wu H, Kanatous SB, Thurmond FA, et al. Regulation of mitochondrial biogenesis in skeletal muscle by CaMK. Science. 2002;296(5566):349–52. doi: 10.1126/science.1071163. [DOI] [PubMed] [Google Scholar]
- 20.Esterbauer H, Oberkofler H, Krempler F, Patsch W. Human peroxisome proliferator activated receptor gamma coactivator 1 (PPARGC1) gene: cDNA sequence, genomic organization, chromosomal localization, and tissue expression. Genomics. 1999;62(1):98–102. doi: 10.1006/geno.1999.5977. [DOI] [PubMed] [Google Scholar]
- 21.Knutti D, Kaul A, Kralli A. A tissue-specific coactivator of steroid receptors, identified in a functional genetic screen. Mol Cell Biol. 2000;20(7):2411–22. doi: 10.1128/mcb.20.7.2411-2422.2000. [DOI] [PMC free article] [PubMed] [Google Scholar]
- 22.Wu ZD, Puigserver P, Andersson U, et al. Mechanisms controlling mitochondrial biogenesis and respiration through the thermogenic coactivator PGC-1. Cell. 1999;98(1):115–24. doi: 10.1016/S0092-8674(00)80611-X. [DOI] [PubMed] [Google Scholar]
- 23.Lin JD. Minireview:ThePGC-1coactivatornetworks:chromatin-remodeling and mitochondrial energy metabolism. Mol Endocrinol. 2009;23(1):2–10. doi: 10.1210/me.2008-0344. [DOI] [PMC free article] [PubMed] [Google Scholar]
- 24.Barres R, Yan J, Egan B, et al. Acute exercise remodels promoter methylation in human skeletal muscle. Cell Metab. 2012;15(3):405–11. doi: 10.1016/j.cmet.2012.01.001. [DOI] [PubMed] [Google Scholar]
- 25.da Costa Santos VB, Ruiz RJ, Vettorato ED, et al. Effects of chronic caffeine intake and low-intensity exercise on skeletal muscle of Wistar rats. Exp Physiol. 2011;96(11):1228–38. doi: 10.1113/expphysiol.2011.060483. [DOI] [PubMed] [Google Scholar]
- 26.McConell GK, Ng GPY, Phillips M, Ruan Z, Macaulay SL, Wadley GD. Central role of nitric oxide synthase in AICAR and caffeine-induced mitochondrial biogenesis in L6 myocytes. J Appl Physiol. 2010;108(3):589–95. doi: 10.1152/japplphysiol.00377.2009. [DOI] [PubMed] [Google Scholar]
- 27.Wright DC, Geiger PC, Han DH, Jones TE, Holloszy JO. Calcium induces increases in peroxisome proliferator-activated receptor gamma coactivator-1 alpha and mitochondrial biogenesis by a pathway leading to p38 mitogen-activated protein kinase activation. J Biol Chem. 2007;282(26):18793–9. doi: 10.1074/jbc.M611252200. [DOI] [PubMed] [Google Scholar]
Associated Data
This section collects any data citations, data availability statements, or supplementary materials included in this article.
Supplementary Materials
A video abstract by the authors of this paper is available.


