

Abstract
Alu retrotransposons are the most numerous and active mobile elements in humans, causing genetic disease and creating genomic diversity. Mobile element scanning (ME-Scan) enables comprehensive and affordable identification of mobile element insertions (MEI) using targeted high-throughput sequencing of multiplexed MEI junction libraries. In a single experiment, ME-Scan identifies nearly all AluYb8 and AluYb9 elements, with high sensitivity for both rare and common insertions, in 169 individuals of diverse ancestry. ME-Scan detects heterozygous insertions in single individuals with 91% sensitivity. Insertion presence or absence states determined by ME-Scan are 95% concordant with those determined by locus-specific PCR assays. By sampling diverse populations from Africa, South Asia, and Europe, we are able to identify 5799 Alu insertions, including 2524 novel ones, some of which occur in exons. Sub-Saharan populations and a Pygmy group in particular carry numerous intermediate-frequency Alu insertions that are absent in non-African groups. There is a significant dearth of exon-interrupting insertions among common Alu polymorphisms, but the density of singleton Alu insertions is constant across exonic and nonexonic regions. In one case, a validated novel singleton Alu interrupts a protein-coding exon of FAM187B. This implies that exonic Alu insertions are generally deleterious and thus eliminated by natural selection, but not so quickly that they cannot be observed as extremely rare variants.
Mobile elements (ME) are among evolution's greatest success stories. They are ubiquitous, inhabiting virtually all genomes examined to date. In many species, including humans, mobile elements have reproduced themselves so effectively and persistently that their copies now vastly outnumber protein-coding genes. Their remnants make up the majority of our DNA (International Human Genome Sequencing Consortium 2001; de Koning et al. 2011). Mobile elements generate disease-causing mutations, whether by inserting into and disrupting host genes or by precipitating genome rearrangements (for review, see Cordaux and Batzer 2009; Beck et al. 2011). Recent evidence indicates that somatic retrotransposition in humans, especially in the brain, may greatly exceed germline activity (Coufal et al. 2009; Baillie et al. 2011; but see Evrony et al. 2012). Retrotransposition also appears to be derepressed in some tumors and in senescent cells (Iskow et al. 2010; Lee et al. 2012; De Cecco et al. 2013).
The ubiquity, sheer number, diversity, and continued activity of mobile elements all indicate that they are key shapers of genomic evolution. However, it remains difficult to study their evolution and impact. They are best observed at the level of DNA sequence, but this is difficult because of their repetitive nature and large copy number. Methods for quickly and inexpensively—yet comprehensively—identifying mobile element insertions (MEI) are needed to understand their impacts and contributions. Sensitive and efficient assays are critical for characterizing patterns and estimating rates of transposition, testing for variation in those rates, and detecting low-prevalence somatic insertions.
Mobile element scanning (ME-Scan) (Witherspoon et al. 2010) is a targeted high-throughput sequencing approach that uses PCR to specifically amplify the junctions between mobile element insertions and the flanking unique genomic sequence (see Fig. 1 for the specific protocol followed here). The targeting strategy builds on transposon display and related methods (e.g., Van den Broeck et al. 1998; Roy et al. 1999; Sheen et al. 2000; Ovchinnikov et al. 2001; Buzdin et al. 2002; Badge et al. 2003; Jiang et al. 2003; Boissinot et al. 2004; Mamedov et al. 2005; Cordaux et al. 2007; Lockton et al. 2008; Macko and Grzebelus 2008; Rho et al. 2010; Schaack et al. 2010). Rather than visualizing the DNA products as bands on an electrophoresis gel, as in the above applications, the MEI junctions are sequenced (e.g., Schröder et al. 2002; Wu et al. 2003; Mitchell et al. 2004; Wang et al. 2007; Naito et al. 2009; Witherspoon et al. 2010). Sequence data provide far greater resolution and certainty since the junction sequences of distinct MEI are far less likely to be identical than their fragment sizes (and thus their band positions on a gel). Furthermore, analysis of sequences can immediately confirm that they are derived from a MEI and allow for simple downstream validation using locus-specific PCR.
Figure 1.

ME-Scan library preparation (A–E) and sequencing (F–H). (A) Genomic DNA (green) containing an AluYb8/9 (blue) in the forward orientation. The 5′ GC-rich region, the 3′ poly-A tail, and the AluYb8/9-specific primer site (AluBP2) are shown as darker segments. The target site duplications (TSD) are indicated by boxed black arrows. (B) DNA samples are fragmented, end-repaired, and an overhanging 3′ A is added. (C) Partially double-stranded oligonucleotide adapters (orange) with 9-bp indexes (darker segment) are ligated onto fragment ends. Indexed samples are then pooled. (D) AluYb8/9 element junctions are targeted by PCR using a biotinylated AluYb8/9-specific primer (AluBP2) and adapter primer PEP2. Biotinylated DNA molecules are then purified using streptavidin-coated paramagnetic beads. (E) Reamplification of the library with primers PEP1 and PEP2 (orange arrows). (F–H) The pooled junction library is then sequenced with a three-read design. Primers are shown as arrows, sequencing reads as dashed lines. The first sequencing read (50 nt) extends from AluSPv2 (F) or AluSPv3 (G). To skip the 5′ end of the Alu insertions, which would be identical over the entire flow cell and therefore difficult for Illumina's software to process, the first 30 cycles of nucleotide synthesis are carried out without collecting data (represented by a dashed gray ‘hop’). The second read proceeds for 57 bp from AluSPIn1. The third read is generated using Illumina's standard second-end read primer and consists of a 9-bp index, a ‘T,’ and 36 bp of genomic sequence from a fragmentation site 50–300 bp upstream of the Alu insertion. Read sets are generated from multiple different fragments representing each AluYb8/9 insertion in the library (H). Each insertion is uniquely identified by its “Alu Junction Position” (dashed line and large arrow in F and G).
Alu elements of the AluYb8 and AluYb9 subfamilies account for approximately one-third of recent Alu retrotranspositional activity in humans (RepeatMasker Open 3.0; http://www.repeatmasker.org) (Wang et al. 2006). These subfamilies, referred to as AluYb8/9 below, contain a diagnostic 7-bp insertion that allows them to be specifically retrieved by PCR, as in Witherspoon et al. (2010). We exploit this feature to eliminate interference from the background of nearly one million older Alu copies in the human genome. As a result, other currently active subfamilies (e.g., AluYa5) are not retrieved since they lack the diagnostic insertion.
Here, we used ME-Scan to identify nearly all AluYb8/9 insertions in 169 diverse individuals. ME-Scan recovers AluYb8/9 subfamily insertions with per-individual sensitivity and specificity of 95%. By sampling diverse populations from Africa, South Asia, and Europe, we are able to identify 5,799 Alu insertions, including 2524 novel ones, some of which occur in the exons of genes. For the focused purpose of detecting AluYb8/9 insertions, this experiment achieved higher yield and sensitivity than the pilot 1000 Genomes Project, in which whole-genome sequencing was carried out on 185 individuals (Stewart et al. 2011).
Results
We used ME-Scan (outlined in Fig. 1) to detect AluYb8/9 insertions in 169 individuals by high-throughput sequencing of seven libraries containing 24 or 25 pooled samples on a single flow cell of an Illumina GAIIx DNA sequencer. In six of seven libraries, samples were pooled in identical amounts (one twenty-fifth, or 4% of the library) (Supplemental Table S1). In these, the average percentage difference between intended and observed proportions of indexed, Alu-positive, uniquely mapped sets of reads ranges from 12% to 24% (each read set consists of the three reads produced from a single molecule on a flow cell) (Supplemental Table S2). One library (‘Variable’) was created by pooling samples at proportions from 1% to 10%.
Replication analysis
To measure the reliability of ME-Scan, we assayed sample AFP20 twice, once at moderate coverage and then at 5.4-fold higher coverage (Fig. 2; Supplemental Table S2). Overall, 95% of 2563 known AluYb8/9 or novel insertions that were observed in the lower coverage replicate were also seen in the higher coverage replicate. Nearly all (92%) were supported by at least six read sets, the equivalent of one read set in the low coverage replicate. Of 2284 insertions supported by at least six read sets in the higher coverage replicate, 99.5% were seen in the lower coverage replicate. As expected, the replication rate decreases when insertions supported by weaker evidence (as little as one read set) are included, to 77% of 3139 insertions.
Figure 2.

Histograms of the numbers of Alu insertion loci detected in two technical replicates of individual AFP20, binned according to the number of sequencing reads (coverage-corrected to 200,000 indexed, Alu-positive, uniquely mapped reads) supporting them in one replicate, along with the fraction of insertions in each bin that were also observed (at least one supporting read set) in the other replicate. DNA from AFP20 was analyzed twice, once in the ‘African’ library and once in the ‘Variable’ library. (A) Summary of evidence for Alu insertions as detected in the lower-coverage ‘African’ library and their replication rate in the higher-coverage ‘Variable’ library. (B) Summary of evidence for insertions in the ‘Variable’ library and replicated (or not) in the AFP20 sample in the ‘African’ library. In both panels, the histogram bars are sectioned according to the type of Alu insertion observed: green for AluY8/9 insertions that are present in the hg19 human reference genome and previously observed to be polymorphic; blue for Alu insertions present in hg19 and known to be polymorphic but not classified as AluYb8/9; orange for novel Alu insertions detected in the current work, all presumed to be polymorphic; and gray for AluYb8/9 insertions present in hg19 and not known to be polymorphic. The lines indicating replication rates use the same color scheme, with an additional line (red dashed) indicating the overall replication rate. Identical bins and the log-scaled horizontal axis are used in both panels. The vertical dashed line at 10 coverage-corrected reads indicates the threshold used to identify credible insertions.
The replication rate for insertions correlates strongly with the level of supporting evidence. Known polymorphic AluYb8/9 insertions present in the hg19 reference are the most likely to be replicated (Fig. 2A, green lines): 99% of those supported by even a single read set in the lower-coverage replicate were also observed in the higher-coverage one. Novel insertions have lower replication rates, as is typical of genome-scale variant detection experiments. AluYb8/9 insertions with poor primer annealing sites and some novel AluYa5 insertions may generate weak but repeatable evidence. False positives that may be generated by chimeric molecules created during library preparation or by mutated and then mismapped reads are not expected to replicate. Regardless of category (previously known or novel), 99% of Alu insertions with 10 or more coverage-corrected (see Methods) supporting read sets in either replicate were observed in the other with at least one read set. Thus, for Alu insertions that are amenable to ME-Scan, a threshold of 10 coverage-corrected read sets selects for reliably detectable loci. About one-third (57/161) of novel insertions supported by fewer than 10 read sets in the lower-coverage replicate are observed in the higher-coverage replicate.
Sensitivity and specificity
We focus on the per-individual sensitivity: the probability of detecting an insertion in an individual given that it is present in the germline, i.e., as one or two copies per cell. This is a more stringent measure than the locus-detection sensitivity: the probability of detecting a common insertion that is present in multiple individuals of a pooled sample.
To estimate the sensitivity of ME-Scan, we identified a set of 1703 presumably fixed AluYb8/9 insertions in hg19. These should be observed in all our samples (see Supplemental text). Per-individual sensitivity reaches 91% at approximately 200,000 read sets per individual (Supplemental Fig. S1). Most of these Alu loci respond to ME-Scan with even higher sensitivity: 70% of loci are detected in >99% of individuals (given coverage of 100,000 or more read sets) (Supplemental Fig. S2).
Watkins et al. (2003) used locus-specific PCR and gel electrophoresis to genotype 40 loci with polymorphic full-length AluYb8/9 insertions in 110 individuals that were also assayed by ME-Scan here. The ME-Scan presence/absence calls are highly concordant with the previously determined genotypes, agreeing in 95.1% of 4350 comparisons. This comparison estimates the sensitivity of ME-Scan at 94.9% and the false positive rate at 4.6% (Supplemental Table S3; Supplemental file Comparative_Genotypes.txt). Individuals who are homozygous for an Alu insertion at a locus generate twice as many reads (on average) from that locus than from heterozygotes at the locus. However, the variance in the numbers of reads obtained for the two genotypes is too large to reliably distinguish between them (Supplemental Fig. S3).
To further characterize the performance of ME-Scan, we compared 3098 AluYb8/9 elements observed in the HuRef genome sequence of J. Craig Venter (Levy et al. 2007; Xing et al. 2009b) with those detected by ME-Scan in a sample of Venter's DNA (Supplemental text). A third of these elements are severely truncated, lack the necessary primer annealing sites, or lie in genomic regions where short reads tend not to map uniquely; these perform poorly in ME-Scan (17% detected). Of the 2065 AluYb8/9 insertions in Venter that should be accessible to ME-Scan, 1938 (94%) are detected. This is consistent with the sensitivities estimated from fixed AluYb8/9 in hg19 and by comparison with the results Watkins et al. (2003). ME-Scan detected 2311 insertions (known AluYb8/9 or novel) in Venter's DNA, of which 193 were absent from HuRef. Under the assumption that absences in HuRef are definitive, this implies an 8% false positive rate.
Locus-specific validation by PCR and electrophoresis
Although common and previously known variants have a high rate of replication (above concordance analyses and Fig. 2), novel rare variants are more difficult to distinguish from artifacts. We therefore tested 76 candidate novel Alu insertion loci that were observed in a single individual (51 loci) or in two (doubletons; 25 loci) and supported by between 6 and 50 coverage-corrected read sets (Supplemental text; Supplemental Tables S4, S5). The probability of successful validation of singleton insertions increases from 20% (4/20) for those supported by fewer than ten coverage-corrected read sets to 44% (8/18) for those with 10–20 read sets and 77% (10/13) for those with 20–50 read sets. The pattern is similar for novel doubletons, with a 75% validation rate (12/16) for rare novel insertions supported by 20–50 coverage-corrected read sets. All validated insertions were observed as heterozygotes.
Novel and previously observed polymorphic AluYb8/9 loci
Given the depth of AluYb8/9-targeted sequencing coverage, the number of individuals assayed, and the variety of populations sampled, we expected to identify many thousands of polymorphic Alu insertion loci. Overall, reads derived from 326,582 putative and known Alu and related element insertion loci (FAM, FLAM, FRAM, and SVA) were observed (see Supplemental file Alu_Loci.txt). Many insertions are in hg19, appear to be ancient, and are presumably fixed. Sporadic reads derived from those off-target loci were identified and excluded from further analyses. Table 1 summarizes evidence for 5799 insertion loci divided into five categories according to: (1) whether they are present in the hg19 reference sequence; (2) subfamily class (AluYb8/9, other subfamily, or unknown); and (3) whether they were identified as polymorphic in dbRIP (Wang et al. 2006) or by Stewart et al. (2011). Insertions are counted as present in an individual if they are supported by at least 10 coverage-corrected read sets. Weaker evidence was obtained for an additional 6492 Alu insertions that are absent from the reference genome and not listed in either dbRIP, Stewart et al. (2011), or Hormozdiari et al. (2011). The low replication and validation rates for these insertions (see above) imply that roughly 2000 are true positives, although perhaps of Alu subfamilies other than AluYb8/9. Due to their overall unreliability, they are excluded from Table 1 (all loci are listed in Supplemental file Alu_Loci.txt).
Table 1.
5799 Alu insertion loci observed by ME-Scan
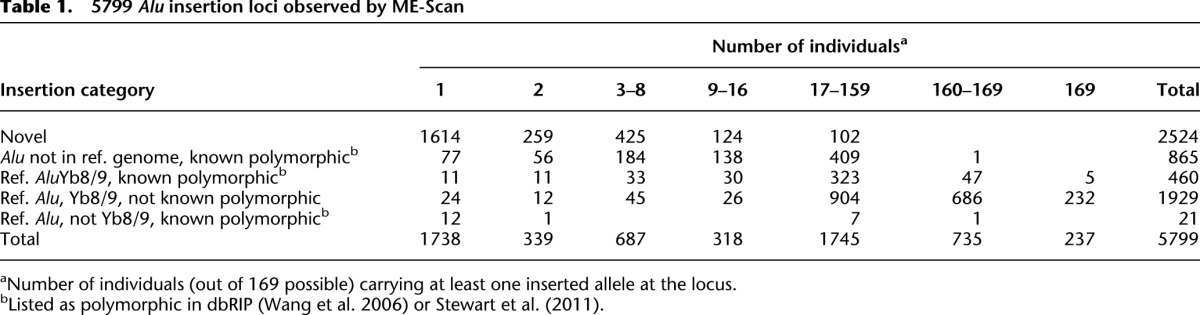
We generated stronger evidence supporting 2524 novel polymorphic insertion loci, 1614 of which are singletons (Table 1). Insertion alleles were detected at 865 loci previously observed to be polymorphic. Most reference AluYb8/9 insertions that are not known to be polymorphic were not detected in all individuals assayed (1929 loci). This is expected when assaying many individuals with even a low probability of false negative results, and a small percentage of loci have higher false negative rates (Supplemental Fig. S2). Some insertions may be fixed in previously studied populations but polymorphic in others (e.g., Pygmy).
We also observed 21 insertions that are present in the reference genome and known to be polymorphic but are not AluYb8/9 insertions. These include other recently active Alu subfamilies, notably AluYa5, whose members sporadically generate sequencing reads in ME-Scan. That we see so few insertions of this class indicates that the AluYb8/9-specific amplification and the threshold requirement of 10 coverage-corrected read sets strongly discriminate against non-AluYb8/9 loci. In contrast, we observed 460 AluYb8/9 that are present in the reference sequence and known to be polymorphic. These are relatively common: Most are present in >10% of our population sample.
Hormozdiari et al. (2011) analyzed eight high-coverage human genome sequences and identified 4342 Alu insertions not found in the hg19 reference. Of those, 1096 were detected by ME-Scan in at least one individual of our sample. This includes 146 insertion loci that are not listed in dbRIP and were not observed by Stewart et al. (2011), for which ME-Scan provides independent confirmation of their existence as polymorphic insertions in humans (Supplemental file Hormozdiari2011_AluMatch.txt).
Distribution of AluYb8/9 genetic diversity
To provide a more detailed view of the distribution of rare vs. common insertions, we constructed Alu insertion presence spectra (histograms of the numbers of loci with insertions observed in varying numbers of individuals) for the population samples (Fig. 3). As would be expected of the derived alleles generated by any mutational process, rare insertions predominate. That pattern is especially pronounced in the sub-Saharan African samples relative to the non-African samples (e.g., Brahmin and HapMap Toscani in Italy [TSI]). The greater genetic variation and larger number of rare alleles in African populations vs. non-African populations is consistent with the demographic history of humans (Li et al. 2008; Gravel et al. 2011). The population bottleneck experienced by non-African populations during their migration out of Africa has affected Alu insertion diversity just as it has SNP diversity.
Figure 3.

Insertion presence spectra for 5047 Alu insertion loci in 158 higher-coverage individuals (those with at least 100,000 read sets) from nine populations (excluding the single Vietnamese individual and Venter). An insertion was counted as present in an individual if at least 10 coverage-corrected read sets were observed. Each histogram is constructed from the number of insertion-present states counted for each individual in the population sample across loci that are not fixed present in the sample. (A–E) Spectra for 50 Indian individuals assayed using sequencing primer AluSPv3, 24 TSI, 25 Brahmin, 49 sub-Sahara African individuals, and a pool of 108 higher-coverage individuals assayed using AluSPv2. The spectra represent only those loci out of the 5047 that are present in at least one but not in all individuals in each sample.
We used principal components analysis to examine the distribution of genetic diversity due to polymorphic Alu insertions across populations in Figure 4. Individuals cluster according to their continent and population of origin, as in previous analyses of different genetic markers from these same individuals (Witherspoon et al. 2006; Xing et al. 2009a). However, the Irula, Mala, and Madiga samples were assayed in two libraries that were sequenced with a different primer (AluSPv3) vs. the other libraries (which used AluSPv2). The largest principal component in Figure 4A separates the samples processed with the different primers. When data generated with different sequencing primers are analyzed separately (panels B and C), individuals from the same population still cluster together, as expected.
Figure 4.

Principal components analysis (PCA) based on insertion presence/absence states for 5060 Alu insertion loci in 160 individuals with at least 100,000 read sets, including a single Vietnamese individual and Venter. PCA was performed on the matrix of the sums of pairwise insertion-state differences between individuals; i.e., for each locus, each pair received a distance score of zero if they shared the same state or one if they differed. Individuals are plotted by their scores in the largest three principal components. PCA for all 160 individuals (A); for 110 individuals assayed using primer AluSPv2 (B); and for 50 individuals assayed with AluSPv3 (C). A threshold of three reads was used to assign present and absent states, and all loci represented were supported by at least 10 coverage-corrected reads in at least one individual. Individuals are colored according to their source population as per the legend. Lines dropping from each individual indicate the third principal component.
Population-differentiating Alu insertions
To explore Alu insertion allele frequency differences, we compared the insertion presence spectra for pairs of populations. Figure 5 shows heat maps for the TSI samples vs. the African Pygmy samples and the Brahmin vs. TSI (all pairwise comparisons are shown in Supplemental Fig. S4). Insertion presence counts by locus are well correlated between the non-African populations (e.g., Pearson correlation coefficient 0.91 for Brahmin vs. TSI) (Fig. 5) but less so between the African and non-African populations (correlation coefficient 0.63, TSI vs. Pygmy). The comparison of Pygmy and TSI samples also reveals many polymorphic insertion loci that have intermediate frequencies in the Pygmy sample but are absent from the TSI sample (Fig. 5, bottom row of the first panel). In our sample of individuals, 1109 insertions are limited to just one population, usually to an African one (Supplemental text and file Pop_Specific_Alu.txt). This suggests that numerous Alu insertions in African populations were lost in the population bottleneck that occurred as humans migrated out of Africa.
Figure 5.

Heat maps comparing counts of Alu insertions present in 24 TSI vs. 17 Pygmy individuals (left panel; Pearson correlation coefficient 0.63, 1591 variable loci) and Brahmin vs. TSI (right; correlation coefficient 0.91, 1063 variable loci). The numbers of individuals in which an insertion could be observed (from zero to the total number of individuals in the sample) are represented on the horizontal (x) and vertical (y) axes. The numbers of Alu insertion loci observed in (x, y) individuals in the pair of populations are represented as colors according to the legend bar (log scale). Only loci that were novel or previously observed as polymorphic were considered. An insertion at a locus was counted as present in an individual if at least 10 coverage-corrected reads were observed from that individual.
Genomic context of common vs. rare Alu insertions
Alu insertions that arose more than 5 million years ago are concentrated in GC-rich DNA relative to more recent ones (using 50-kb windows) (e.g., International Human Genome Sequencing Consortium 2001; Medstrand et al. 2002; Jurka et al. 2004). However, we observe no difference in the G + C content in 50-kb windows around rare vs. common polymorphic AluYb8/9 insertions (Supplemental text). The difference in the ages of the AluYb8/9 insertions assayed here is comparatively small, so the processes responsible for the previously observed differences may not have had time to generate a detectable difference between common (generally older) and rare (more recent) insertions. Jurka et al. (2004) found that the density of Alu elements is higher around Alu insertions from older subfamilies (e.g., AluS, AluJ) than around AluYb8 and AluYa5 insertions. Consistent with that trend, we observe a slightly higher density of Alu elements around common vs. rare AluYb8/9 insertions in our data (Supplemental text). The AT-rich target site pattern observed by Jurka (1997) and Toda et al. (1998) is also evident in our data (Supplemental Fig. S5).
Impact of novel Alu insertions on genes
Among the thousands of novel Alu insertions identified here, some should have inserted into genes and perhaps even into protein-coding exons of genes. We annotated insertions in transcribed regions, within exons, and within protein-coding sequences (Supplemental file Alu_Loci.txt). We randomly selected 17 potential Alu insertions in protein-coding exons for validation by locus-specific PCR (Supplemental Tables S6, S7). In one case, ME-Scan detected an Alu insertion in the protein-coding sequence of the first exon of FAM187B, a single-pass type I transmembrane protein that is conserved across mammals. PCR validation of the locus detected the ∼350-bp size difference expected between alleles with and without an Alu insertion (Supplemental Fig. S6).
The low validation rate in this set of putative insertions is consistent with our replication results above: Novel insertions supported by fewer than 10 coverage-corrected read sets are unreliable. The small number of insertions in protein-coding exons, their low rate of validation, and the obscure nature of the gene containing the only validated insertion are all consistent with the findings of Stewart et al. (2011), who were able to validate only two mobile element insertions in putative protein-coding exons—one in a member of a large family of paralogous zinc finger genes and the other in a predicted gene with no known function.
We also detected numerous insertions with substantial support (20 or more coverage-corrected read sets) in noncoding exon segments (UTRs). Since Alu insertions into exons (whether protein-coding or not) are especially likely to disrupt the function and regulation of genes, natural selection tends to remove them rapidly from the population (Boissinot et al. 2004; Stewart et al. 2011). Over time, this results in a depletion of common and fixed Alu insertions in exons relative to nonexonic regions of the genome. However, natural selection may not have had time to eliminate very recent insertions with moderately deleterious phenotypic effects.
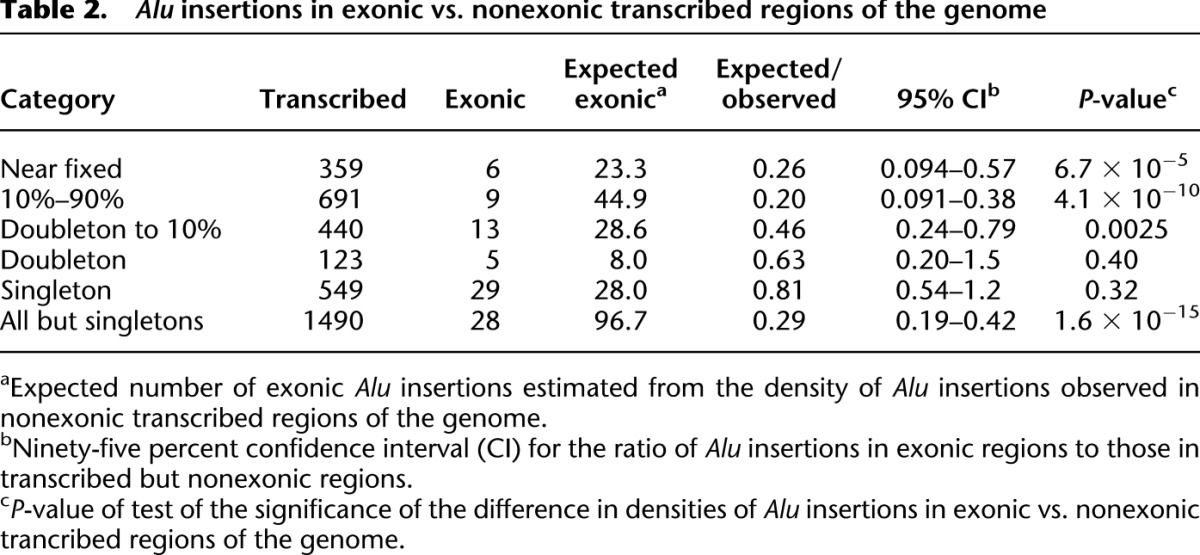
To test for the expected patterns of exonic vs. nonexonic Alu insertion loci, we compared the numbers of insertions in exons vs. the numbers in transcribed but nonexonic regions across different insertion frequency classes (see Methods). Transcribed nonexonic genomic regions (including introns) provide a large and well-defined target from which an expected number of insertions per base pair can be estimated. Common Alu insertions are five times less common in exons than in transcribed but nonexonic regions (P < 10−9) (Table 2). However, this depletion is not observed among the rarest insertions (singletons and doubletons): We find them at indistinguishable rates in exons and transcribed nonexonic regions. This result is qualitatively unaffected by the use of more conservative thresholds for counting insertions to reduce the potential impact of false positives (i.e., by requiring 50 coverage-corrected read sets per insertion rather than 20). In contrast to the pattern in exons, common and rare insertions were equally likely to be found in introns (Supplemental text). The difference between the patterns for common and rare Alu insertions in exons suggests that some of the exonic novel insertions we have detected do have deleterious functional consequences, and they will eventually be eliminated by natural selection.
Table 2.
Alu insertions in exonic vs. nonexonic transcribed regions of the genome
Discussion
The potential of targeted MEI junction retrieval and characterization using high-throughput technologies has sparked several techniques in addition to ME-Scan (Xing et al. 2013): the LINE-1 sequencing approach of Ewing and Kazazian (2010); ‘transposon-seq’ of Iskow et al. (2010); and the microarray-based ‘TIP-chip’ of Huang et al. (2010) and Wheelan et al. (2006). Some of these approaches have used restriction enzyme digestion (Huang et al. 2010; Iskow et al. 2010) or PCR with degenerate primers (Ewing and Kazazian 2010) to generate genomic fragments, which can limit or bias the fraction of the genome that is assayed. ME-Scan uses mechanical fragmentation and oligonucleotide adapter ligation to create a DNA library to uniformly represent the genome. Of the above approaches, only ME-Scan and transposon-seq (Iskow et al. 2010) used oligonucleotide adapters with indexes to pool libraries from multiple samples. ME-Scan uses PCR with a biotinylated primer specific to a mobile element family (here, AluYb8 and AluYb9) to target DNA fragments that contain the MEI-flank junctions. This is a simple, efficient, and highly specific procedure when compared with solid-phase hybridization of genomic DNA to retrotransposon sequences (Baillie et al. 2011) or enrichment by PCR alone.
TIP-chip (Wheelan et al. 2006; Huang et al. 2010) hybridizes an MEI-junction fragment library to custom genomic tiling microarrays that represent the nonrepetitive genome in order to obtain approximate positional information about MEIs in a single sample. The positional precision of this method is limited by the distribution of restriction enzyme sites near MEIs and the set of tiling probes used. Even with high-coverage whole-genome sequencing data, the precise positions of MEIs can be difficult to identify. For example, Alu insertions discovered in sequence data by Hormozdiari et al. (2011) have an average position uncertainty of 92 bp (Table S1 in Hormozdiari et al. 2011). ME-Scan has an average position error of <1 bp (Supplemental Fig. S7). By using precisely targeted high-throughput sequencing of multiplexed libraries, ME-Scan efficiently generates detailed sequence information about the junctions between MEI and their genomic flanks from many individuals simultaneously.
In a single experiment, we assayed 169 individuals from 12 diverse human populations in seven multiplexed libraries. The uniformity of coverage across samples was adequate, and results from samples pooled at a 1% proportion (the ‘Variable’ library) indicate that pooling 100 samples is feasible. We tested a three-read design that generated sequence from within Alu insertions. Three different Alu-specific sequencing primers all performed well, indicating that other mobile elements may be readily targeted by redesigning the requisite primers. Longer 9-bp indexes (compared to 4 bp used previously and 6-bp standard Illumina indexes) allowed error-tolerant demultiplexing of 25 pooled samples per library.
Overall, reliable evidence was generated from 5799 Alu insertion loci, 3870 of which were polymorphic, including 2524 previously unknown insertions (Table 1). Due to our targeting of AluYb8 and AluYb9 subfamilies, these counts exclude most insertions of other active AluY subfamilies, which constitute more than half of previously known Alu polymorphisms (Wang et al. 2006). Even so, the 2524 novel nonreference Alu insertions we observed is comparable to the total number of 2649 novel nonreference mobile element insertions of all classes (all Alu subfamilies as well as L1 and SVA) that were identified in data from 185 individuals sequenced for the 1000 Genomes Project (Fig. 2E of Stewart et al. 2011). This experiment was able to discover more than two thousand novel Alu insertions beyond those uncovered by numerous previous MEI-discovery efforts for two reasons. The sample of individuals assayed was sizable and genetically diverse due to the inclusion of sub-Sahara African populations. Equally important is the high sensitivity of ME-Scan to detect even singleton insertions. Most variable mobile element insertions are rare, and high-sensitivity methods are required to capture them.
Comparisons with AluYb8 insertions genotyped by locus-specific PCR and gel electrophoresis (Watkins et al. 2003) show that ME-Scan detects insertions with a per-individual sensitivity of 95.5%. For detecting insertions at such loci, ME-Scan is at least as accurate as locus-specific PCR assays, with the advantage of detecting previously unknown insertions. Across a set of 1703 presumably fixed AluYb8/9 insertions in the human reference genome that have the required primer annealing sites, ME-Scan has an average sensitivity of 91% (Fig. 3). Detection failures are concentrated in a minority of loci, in particular those found in repetitive or duplicated genomic regions where short reads tend not to map uniquely. The majority of loci (80%) are detected with ≥99% sensitivity in individuals with at least 300,000 read sets of coverage.
In comparison, the pilot 1000 Genomes Project used low-coverage whole-genome sequencing to achieve a locus detection sensitivity of 70%–80% for common nonreference Alu insertion loci—those with the insertion allele present in at least 10% of a sample of 185 individuals (Stewart et al. 2011). High-coverage sequencing with both long (Roche 454) and short (Illumina) reads was required to achieve a per-individual sensitivity of 90% (high-coverage trios) (Table S2 of Stewart et al. 2011). The long sequencing reads were particularly useful due to the difficulty of identifying repetitive insertions using random short reads. Naturally, high-coverage whole-genome sequencing yields more total information than a targeted approach.
The two main limitations of ME-Scan arise from its use of element-specific primers and short-read mapping. Insertions that lack adequate primer annealing sites and insertions in duplicated genomic regions are likely to be missed. The first concern is lessened by focusing on very recent Alu insertions, which are unlikely to be truncated or mutated. Multiple targeting primers might prove useful in other contexts. The second concern can be addressed with higher coverage, longer reads, and by making better use of mapping information. Increasing coverage improves sensitivity to detect insertions where a fraction of short reads map uniquely. Using longer sequencing reads in MEI flanks should also improve the performance of these loci since the fraction of the genome in which short reads map uniquely increases from 79% for 50-bp reads to 93% for 100-bp reads (Derrien et al. 2012).
The Alu insertion presence and absence states in individuals correlate with their geographic ancestry (Fig. 5), so individuals from a population group together in principal components analyses (Fig. 4). When compared with non-African populations, the African groups exhibit many intermediate-frequency Alu insertions that are absent or rarely observed in non-African populations. This is consistent with loss of some Alu insertions during the population bottleneck that occurred during the migration of humans out of Africa (Li et al. 2008; Gravel et al. 2011; Li and Durbin 2011).
Insertions of Alu elements into coding exons of genes are expected to disrupt gene function and therefore face strong purifying selection. Although some will be relatively benign and thus may drift to higher frequency, most such insertions are expected to exist only briefly in the population as very rare insertions. By capturing these, ME-Scan will allow us to better dissect the factors influencing ME retrotransposition rates and site preferences in vivo, prior to the action of confounding forces such as natural selection, demographic changes, and post-integration rearrangements. The singleton Alu insertion we identified here in the first coding exon of FAM187B exemplifies this potential (Supplemental Fig. S6). The ability to efficiently and comprehensively identify such rare and ephemeral mutations opens the door to observing the leading edge of evolution in action.
The flexibility, efficiency, and sensitivity of ME-Scan make it ideal for many applications: comprehensive identification of MEI in large population samples, as shown here; characterization of the population dynamics of diverse mobile element families in nonhuman populations; generating orthogonal evidence for MEI detection in short-read whole genome sequencing projects (such as the Genome 10K Community of Scientists 2009; The 1000 Genomes Project Consortium 2010; Lee et al. 2012), since MEI detection and validation remains challenging in that context; for detecting transposition in somatic tissues and tumors; for estimating and comparing transposition rates under varying circumstances; and for the comparative study of mobile element evolution across species and mobile element families.
Methods
Preparation and sequencing of pooled, targeted DNA libraries
The ME-Scan library preparation procedure is outlined in Figure 1A–E (upper section). Pooled, targeted sequencing libraries were prepared using a variation of the ME-Scan protocol of Witherspoon et al. (2010), itself based on an Illumina protocol (Paired-End Sample Preparation Guide, Part # 1005063 Rev. D February 2010). Individual genomic DNA samples (3 μg) (Fig. 1A) were sheared to a median fragment size of 1000 bp using a Covaris E210 system (15 sec, 5% duty cycle, intensity 3, 200 cycles per burst; Covaris, Inc.). DNA was concentrated by QIAquick spin column (Qiagen, Inc.), end-repaired, purified, modified to add unpaired 3′ adenine nucleotides, and column purified again per the Illumina protocol (Fig. 1B). Adapter ligation (Fig. 1C) was performed according to the Illumina protocol but using a custom oligonucleotide adapter pair with a unique 9-bp index for each sample. We designed 25 pairs of partially complementary indexed oligonucleotides based on Illumina's designs (Supplemental Table S8). All custom oligonucleotides used in this work were synthesized by Integrated DNA Technologies, Inc. Individual sample concentrations were measured using a NanoDrop 2000 spectrophotometer (Thermo Scientific, Inc.) to determine the appropriate adapter concentrations. Ligation products were then purified by column centrifugation (Qiagen QIAquick) and their concentrations were determined by spectrophotometry (NanoDrop 2000).
At this point, individual indexed samples were combined in groups of about 25 to create seven pooled libraries, designated African, LWK, TSI, Brahmin, Variable, Irula and Mala + Madiga (Supplemental Tables , S2). A total of 169 individuals were sampled from 11 geographical ancestry groups: 8 Alur, 10 Hema, and 24 Pygmy from sub-Sahara Africa; 25 Brahmin, 25 tribal Irula, 15 Madiga, and 10 Mala from south India; 25 TSI (Toscani in Italy); 25 LWK (Luhya in Webuye, Kenya); a single individual from Vietnam, previously assayed (Witherspoon et al. 2010); and one individual of northern European ancestry (J. Craig Venter). The TSI and LWK individuals were sampled for the HapMap Project (Altshuler et al. 2010). The other African and south Indian samples have been described previously (Jorde et al. 1995; Bamshad et al. 1998). DNA was obtained from whole blood or transformed lymphoblast cell lines. Some DNA samples were assayed more than once, so a total of 174 DNA preparations were analyzed.
To obtain a population of molecules spanning the junctions between Alu insertions and flanking DNA, AluYb8/9-specific PCR (Fig. 1D) was then carried out on each pooled library. Biotinylated primer AluBP2 (5′ B-ACACTCTTTCCCTACACGACGCTCTTCCGATCTGCCCAGGCCGGACTGCGGAC 3′, 5′ biotinylated and HPLC-purified) and Illumina primer PEP2 (5′-CAAGCAGAAGACGGCATACGAGATCGGTCTCGGCATTCCTGCTGAACCGCTCTTCCGATCT-3′, HPLC-purified) were used to specifically biotinylate, amplify, and add adapter sequence to DNA strands containing junctions between the 5′ GC-rich ends of AluYb8/9 insertions and the flanking genomic DNA. To minimize amplification bias, we modified our original ME-Scan protocol (Witherspoon et al. 2010) by increasing the starting DNA template amount to 400 ng and reducing the number of PCR cycles to five. These PCR products were purified (QIAquick PCR Purification Kit) and then subjected to size-selection by gel electrophoresis for ∼600-bp molecules, which are expected to contain ∼150 bp of unique genomic DNA upstream of the GC-rich end of the Alu insertions. The excised DNA was column purified (QIAquick Gel Purification Kit). The size-selected DNA was incubated with streptavidin-coated paramagnetic beads to retain biotinylated DNA fragments per the manufacturer's protocol (Dynabeads MyOne Streptavidin C1, Life Technologies, Inc.). The bead-bound DNA was resuspended in 20 μL of buffer and amplified (Fig. 1E) using the same PCR protocol used above, but with 25 cycles and the standard Illumina Paired-End PCR primers 1 and 2 (PEP2, as above, and PEP1: 5′-AATGATACGGCGACCACCGAGATCTACACTCTTTCCCTACACGACGCTCTTCCGATCT-3′, HPLC-purified; this primer adds additional sequence to the products). Six amplification PCR reactions were done for each library. They were then pooled and subjected to a final size-selection for 600-bp fragments by gel electrophoresis and purification (QIAquick PCR Purification Kit).
The concentration of each library was measured by picoGreen assay (Invitrogen, Inc.) and by real-time quantitative PCR assays (Illumina qPCR Quantification, Part # 11322363 Rev. A, September 2009). Their fragment size distributions were analyzed by Bioanalyzer DNA 1000 chip (Agilent Technologies, Inc.). The seven libraries were sequenced in separate lanes of one flow cell on an Illumina Genome Analyzer IIx. The three-read sequencing design we used is outlined in Figure 1F–H (lower section). The three custom sequencing primers are: AluSPv2 (5′-CCCAAAGTGCTGGGATTACAGGCGTGA-3′), AluSPv3 (5′-ATCCACCCGCCTCGGCCTCCCAAAGT-3′) and AluSPIn1 (5′-CTCCGCTTCCCGGGTTCACGCCATTCT-3′), all HPLC-purified. In Illumina's standard protocol, the second read retrieves a 6-bp index from an adapter. In our protocol, the primer AluSPIn1 reads 57 bp from within the Alu insertion instead. AluSPv2 was used for the African, Brahmin, LWK, TSI, and Variable libraries and AluSPv3 for the Irula and Mala + Madiga libraries.
Read set processing
Read sets were processed through the following steps: index assignment, read trimming, Alu sequence recognition, pairwise read mapping, filtering based on those results, Alu junction position estimation, and merging of read set clusters to yield a set of Alu junction positions supported by the sequence data. Processing was performed using scripts developed in MATLAB (The Mathworks 2011) with data storted in an Oracle database (Oracle Corporation, 11g edition, 2011).
The 9-bp sample indexes were extracted from the start of the third read and matched to those used to construct the libraries, allowing up to two mismatches. Reads one and three (after index trimming) were mapped as paired reads to the UCSC hg19/Genome Research Consortium GRCh37 human genome reference assembly (alternative haplotypes included) using BWA (Li and Durbin 2009), allowing a maximum edit distance of three differences for each read. We filtered the resulting mapped pairs of reads conservatively, requiring: (1) unique mapping of read one (the Alu junction read); (2) a gap-free alignment of the entire first read; (3) map quality 29 or more for each read, a criterion that captures 90% of otherwise acceptable read sets while limiting uncertainty caused by less-confidently mapping read pairs; and (4) a “proper” mapping status reported by BWA, that is, the two reads in the pair were required to map within the expected distance of each other (50–300 bp in this case) and oriented toward each other (the left read in the forward orientation and the right one in the reverse orientation). The strand orientation of the Alu insertion from which the reads are derived is implicit in the orientations of the mapped reads pair.
The second read was checked for the expected Alu sequence. If the 57-bp read matched the expected AluYb8/9 consensus at 40 sites, or if it aligned to the consensus with a Smith-Waterman score of 25 or greater (gap open cost: 64; gap extension cost: 8), the read set was accepted as Alu-derived. This filtering criterion would reject 99% of random sequences; but since all read sets are expected to be Alu-derived, it rejects only 0.12% of read sets that were assigned to a valid index and passed the mapping filters (see above; 90% of these read sets have second reads that match the Alu consensus at 50 or more sites). Only read sets that passed the mapping filters and have valid indexes and recognizable Alu sequence were used for further analyses.
An “Alu Junction Position” (Fig. 1F–H, large arrows and vertical dashed line) was calculated based on the mapped position of the first read, its orientation, the expected offset from the sequencing primer, and the position of the primer (AluSPv2 or AluSPv3) in the AluYb8/9 consensus. The Alu junction position is the base pair in the reference genome immediately 5′ of the first base pair of the Alu insertion's GC-rich end (the 5′ end for a forward-strand insertion). Position estimation is based on the annealing position of the appropriate sequencing primer and assumes that the insertion is not 5′ truncated with respect to the AluYb8 and AluYb9 RepeatMasker consensus sequences. For reverse-strand insertions, the “Alu Junction Position” is the first reference base pair beyond the GC-rich end of the Alu insertion.
Read sets with identical 5′ junction positions were grouped into clusters. A small number of read sets have junction positions that are very near the position of a cluster with more read sets. Examination shows that this variation is due to sequencing errors, mapping uncertainty due to short stretches of low-complexity sequence, potential nonreference variants, and combinations of these factors. Nearly all such cases, which account for <0.5% of filtered read sets, are resolved by merging read clusters whose junction positions are within 7 bp of another cluster. The site of the cluster with the larger number of reads is retained as the estimated Alu junction position.
Matching ME-Scan reads to sources in the reference genome
We compiled a list of potential sources of ME-Scan sequencing reads in the UCSC g19 human reference genome using BLAST (Altschul et al. 1990) to search for matches to the AluSPv2 and AluSPv3 sequencing primers. Matches were annotated with RepeatMasker information. Nearly all such matches are contained in Alu copies. For each match, we computed the Alu junction position that would result if that site yielded reads in ME-Scan. Read set clusters constructed above were compared to the potential reference sources identified by BLAST. If a read set cluster had an estimated Alu junction position that was within 7 bp of the junction position estimated for a potential reference source, it was annotated as being derived from that source. Approximately 0.1% of filtered read sets generate junction positions that are further than 7 bp but within 35 bp of the expected junction position of a known Alu insertion. These were excluded from analysis.
Individual-specific Alu insertion evidence and coverage correction
The above procedure generates a set of annotated Alu insertion loci assembled from all samples across all libraries. Each putative insertion locus is identified by its estimated Alu junction position and orientation. The evidence supporting the presence of an insertion at a locus in an individual is the number of read sets derived from that individual and that locus. Where read sets for an individual were generated from multiple samples, the number of supporting read sets was summed across those samples.
Due to variation in the contribution of individual samples to the pooled libraries and in the number of read sets per library, sequence coverage varies across individuals. To facilitate analyses, we use the ‘coverage-corrected’ number of read sets supporting an insertion at a locus in an individual, which is the observed number of such read sets multiplied by a factor of 200,000 (roughly the median number of read sets per individual) divided by the total number of read sets observed for that individual. Supplemental files Alu_Loci.txt and Alu_Loci_by_Ind.txt list the Alu insertion loci detected here along with the individuals in which they were observed.
Alu insertions in exons vs. transcribed nonexonic regions
In order to test for depletion of Alu insertions in exons relative to nonexonic regions of the genome, we constructed a subset of the data with the following properties. We considered insertions that were either present in the reference genome and classified as an AluYb8/9 or absent from the reference genome and not classified into a subfamily. We used only data from libraries sequenced with the AluSPv2 primer, thus excluding the Irula and Mala + Madiga libraries. To reduce potential effects of false positives, insertions were counted as present in an individual only if they were supported by at least 20 coverage-corrected reads. Insertion loci were grouped into approximate frequency classes based on the number of individuals carrying the insertion. Each Alu insertion locus was also classified as exonic or transcribed but nonexonic, depending on whether its junction position was within an exon or transcript, as annotated by the UCSC and RefGene projects. There are 1,344,989,252 bp annotated as transcribed but not exonic and 87,309,723 bp annotated as exonic, the latter split between protein-coding (36,620,134 bp) and nontranslated (50,689,589 bp). The transcribed region was used to establish an expected rate of insertion. Exact rate-ratio tests (rateratio.test in R; R Development Core Team 2012) were used to test for significant differences between the rates of Alu insertions in the two regions, assuming that the rates follow a Poisson distribution.
Data access
Sequencing data is available at the NCBI Sequence Read Archive (SRA) (http://www.ncbi.nlm.nih.gov/sra) under accession number SRP017779. The Alu insertion loci identified are available through dbRIP (http://dbrip.brocku.ca/) under Study ID “2013-01.”
Acknowledgments
We gratefully acknowledge advice and technical assistance from Brian Dalley, Brett Milash, and David Nix of the Microarray and Genomic Analysis Core Facility at the Huntsman Cancer Institute, and from Reid Prentice of Illumina, Inc. For helpful comments, we thank Cedric Feschotte, Ellen Pritham, and three anonymous reviewers. This work was supported by a pilot project grant from the National Institutes of Health (NIH) to L.B.J. (CTSA 1UL1RR025764-01) and NIH grant GM-59290 to M.A.B. and L.B.J. J.X. is supported by NIH/NHGRI (R00HG005846).
Footnotes
[Supplemental material is available for this article.]
Article published online before print. Article, supplemental material, and publication date are at http://www.genome.org/cgi/doi/10.1101/gr.148973.112.
References
- The 1000 Genomes Project Consortium 2010. A map of human genome variation from population-scale sequencing. Nature 467: 1061–1073 [DOI] [PMC free article] [PubMed] [Google Scholar]
- Altschul SF, Gish W, Miller W, Myers EW, Lipman DJ 1990. Basic local alignment search tool. J Mol Biol 215: 403–410 [DOI] [PubMed] [Google Scholar]
- Altshuler DM, Gibbs RA, Peltonen L, Dermitzakis E, Schaffner SF, Yu F, Bonnen PE, de Bakker PI, Deloukas P, Gabriel SB, et al. 2010. Integrating common and rare genetic variation in diverse human populations. Nature 467: 52–58 [DOI] [PMC free article] [PubMed] [Google Scholar]
- Badge RM, Alisch RS, Moran JV 2003. ATLAS: A system to selectively identify human-specific L1 insertions. Am J Hum Genet 72: 823–838 [DOI] [PMC free article] [PubMed] [Google Scholar]
- Baillie JK, Barnett MW, Upton KR, Gerhardt DJ, Richmond TA, De Sapio F, Brennan PM, Rizzu P, Smith S, Fell M, et al. 2011. Somatic retrotransposition alters the genetic landscape of the human brain. Nature 479: 534–537 [DOI] [PMC free article] [PubMed] [Google Scholar]
- Bamshad MJ, Watkins WS, Dixon ME, Jorde LB, Rao BB, Naidu JM, Prasad BV, Rasanayagam A, Hammer MF 1998. Female gene flow stratifies Hindu castes. Nature 395: 651–652 [DOI] [PubMed] [Google Scholar]
- Beck CR, Garcia-Perez JL, Badge RM, Moran JV 2011. LINE-1 elements in structural variation and disease. Annu Rev Genomics Hum Genet 12: 187–215 [DOI] [PMC free article] [PubMed] [Google Scholar]
- Boissinot S, Entezam A, Young L, Munson PJ, Furano AV 2004. The insertional history of an active family of L1 retrotransposons in humans. Genome Res 14: 1221–1231 [DOI] [PMC free article] [PubMed] [Google Scholar]
- Buzdin A, Khodosevich K, Mamedov I, Vinogradova T, Lebedev Y, Hunsmann G, Sverdlov E 2002. A technique for genome-wide identification of differences in the interspersed repeats integrations between closely related genomes and its application to detection of human-specific integrations of HERV-K LTRs. Genomics 79: 413–422 [DOI] [PubMed] [Google Scholar]
- Cordaux R, Batzer MA 2009. The impact of retrotransposons on human genome evolution. Nat Rev Genet 10: 691–703 [DOI] [PMC free article] [PubMed] [Google Scholar]
- Cordaux R, Srikanta D, Lee J, Stoneking M, Batzer MA 2007. In search of polymorphic Alu insertions with restricted geographic distributions. Genomics 90: 154–158 [DOI] [PMC free article] [PubMed] [Google Scholar]
- Coufal NG, Garcia-Perez JL, Peng GE, Yeo GW, Mu Y, Lovci MT, Morell M, O'Shea KS, Moran JV, Gage FH 2009. L1 retrotransposition in human neural progenitor cells. Nature 460: 1127–1131 [DOI] [PMC free article] [PubMed] [Google Scholar]
- De Cecco M, Criscione SW, Peckham EJ, Hillenmeyer S, Hamm EA, Manivannan J, Peterson AL, Kreiling JA, Neretti N, Sedivy JM 2013. Genomes of replicatively senescent cells undergo global epigenetic changes leading to gene silencing and activation of transposable elements. Aging Cell 12: 247–256 [DOI] [PMC free article] [PubMed] [Google Scholar]
- de Koning AP, Gu W, Castoe TA, Batzer MA, Pollock DD 2011. Repetitive elements may comprise over two-thirds of the human genome. PLoS Genet 7: e1002384. [DOI] [PMC free article] [PubMed] [Google Scholar]
- Derrien T, Estelle J, Marco Sola S, Knowles DG, Raineri E, Guigo R, Ribeca P 2012. Fast computation and applications of genome mappability. PLoS ONE 7: e30377. [DOI] [PMC free article] [PubMed] [Google Scholar]
- Evrony GD, Cai X, Lee E, Hills LB, Elhosary PC, Lehmann HS, Parker JJ, Atabay KD, Gilmore EC, Poduri A, et al. 2012. Single-neuron sequencing analysis of L1 retrotransposition and somatic mutation in the human brain. Cell 151: 483–496 [DOI] [PMC free article] [PubMed] [Google Scholar]
- Ewing AD, Kazazian HH Jr 2010. High-throughput sequencing reveals extensive variation in human-specific L1 content in individual human genomes. Genome Res 20: 1262–1270 [DOI] [PMC free article] [PubMed] [Google Scholar]
- Genome 10K Community of Scientists 2009. Genome 10K: A proposal to obtain whole-genome sequence for 10,000 vertebrate species. J Hered 100: 659–674 [DOI] [PMC free article] [PubMed] [Google Scholar]
- Gravel S, Henn BM, Gutenkunst RN, Indap AR, Marth GT, Clark AG, Yu F, Gibbs RA, Bustamante CD 2011. Demographic history and rare allele sharing among human populations. Proc Natl Acad Sci 108: 11983–11988 [DOI] [PMC free article] [PubMed] [Google Scholar]
- Hormozdiari F, Alkan C, Ventura M, Hajirasouliha I, Malig M, Hach F, Yorukoglu D, Dao P, Bakhshi M, Sahinalp SC, et al. 2011. Alu repeat discovery and characterization within human genomes. Genome Res 21: 840–849 [DOI] [PMC free article] [PubMed] [Google Scholar]
- Huang CR, Schneider AM, Lu Y, Niranjan T, Shen P, Robinson MA, Steranka JP, Valle D, Civin CI, Wang T, et al. 2010. Mobile interspersed repeats are major structural variants in the human genome. Cell 141: 1171–1182 [DOI] [PMC free article] [PubMed] [Google Scholar]
- International Human Genome Sequencing Consortium 2001. Initial sequencing and analysis of the human genome. Nature 409: 860–921 [DOI] [PubMed] [Google Scholar]
- Iskow RC, McCabe MT, Mills RE, Torene S, Pittard WS, Neuwald AF, Van Meir EG, Vertino PM, Devine SE 2010. Natural mutagenesis of human genomes by endogenous retrotransposons. Cell 141: 1253–1261 [DOI] [PMC free article] [PubMed] [Google Scholar]
- Jiang N, Bao Z, Zhang X, Hirochika H, Eddy SR, McCouch SR, Wessler SR 2003. An active DNA transposon family in rice. Nature 421: 163–167 [DOI] [PubMed] [Google Scholar]
- Jorde LB, Bamshad MJ, Watkins WS, Zenger R, Fraley AE, Krakowiak PA, Carpenter KD, Soodyall H, Jenkins T, Rogers AR 1995. Origins and affinities of modern humans: A comparison of mitochondrial and nuclear genetic data. Am J Hum Genet 57: 523–538 [DOI] [PMC free article] [PubMed] [Google Scholar]
- Jurka J 1997. Sequence patterns indicate an enzymatic involvement in integration of mammalian retroposons. Proc Natl Acad Sci 94: 1872–1877 [DOI] [PMC free article] [PubMed] [Google Scholar]
- Jurka J, Kohany O, Pavlicek A, Kapitonov VV, Jurka MV 2004. Duplication, coclustering, and selection of human Alu retrotransposons. Proc Natl Acad Sci 101: 1268–1272 [DOI] [PMC free article] [PubMed] [Google Scholar]
- Lee E, Iskow R, Yang L, Gokcumen O, Haseley P, Luquette LJ III, Lohr JG, Harris CC, Ding L, Wilson RK, et al. 2012. Landscape of somatic retrotransposition in human cancers. Science 337: 967–971 [DOI] [PMC free article] [PubMed] [Google Scholar]
- Levy S, Sutton G, Ng PC, Feuk L, Halpern AL, Walenz BP, Axelrod N, Huang J, Kirkness EF, Denisov G, et al. 2007. The diploid genome sequence of an individual human. PLoS Biol 5: e254. [DOI] [PMC free article] [PubMed] [Google Scholar]
- Li H, Durbin R 2009. Fast and accurate short read alignment with Burrows-Wheeler transform. Bioinformatics 25: 1754–1760 [DOI] [PMC free article] [PubMed] [Google Scholar]
- Li H, Durbin R 2011. Inference of human population history from individual whole-genome sequences. Nature 475: 493–496 [DOI] [PMC free article] [PubMed] [Google Scholar]
- Li JZ, Absher DM, Tang H, Southwick AM, Casto AM, Ramachandran S, Cann HM, Barsh GS, Feldman M, Cavalli-Sforza LL, et al. 2008. Worldwide human relationships inferred from genome-wide patterns of variation. Science 319: 1100–1104 [DOI] [PubMed] [Google Scholar]
- Lockton S, Ross-Ibarra J, Gaut BS 2008. Demography and weak selection drive patterns of transposable element diversity in natural populations of Arabidopsis lyrata. Proc Natl Acad Sci 105: 13965–13970 [DOI] [PMC free article] [PubMed] [Google Scholar]
- Macko A, Grzebelus D 2008. DcMaster transposon display markers as a tool for diversity evaluation of carrot breeding materials and for hybrid seed purity testing. J Appl Genet 49: 33–39 [DOI] [PubMed] [Google Scholar]
- Mamedov IZ, Arzumanyan ES, Amosova AL, Lebedev YB, Sverdlov ED 2005. Whole-genome experimental identification of insertion/deletion polymorphisms of interspersed repeats by a new general approach. Nucleic Acids Res 33: e16. [DOI] [PMC free article] [PubMed] [Google Scholar]
- Medstrand P, van de Lagemaat LN, Mager DL 2002. Retroelement distributions in the human genome: Variations associated with age and proximity to genes. Genome Res 12: 1483–1495 [DOI] [PMC free article] [PubMed] [Google Scholar]
- Mitchell RS, Beitzel BF, Schroder AR, Shinn P, Chen H, Berry CC, Ecker JR, Bushman FD 2004. Retroviral DNA integration: ASLV, HIV, and MLV show distinct target site preferences. PLoS Biol 2: E234. [DOI] [PMC free article] [PubMed] [Google Scholar]
- Naito K, Zhang F, Tsukiyama T, Saito H, Hancock CN, Richardson AO, Okumoto Y, Tanisaka T, Wessler SR 2009. Unexpected consequences of a sudden and massive transposon amplification on rice gene expression. Nature 461: 1130–1134 [DOI] [PubMed] [Google Scholar]
- Ovchinnikov I, Troxel AB, Swergold GD 2001. Genomic characterization of recent human LINE-1 insertions: Evidence supporting random insertion. Genome Res 11: 2050–2058 [DOI] [PMC free article] [PubMed] [Google Scholar]
- R Development Core Team. 2012. R: A language and environment for statistical computing. R Foundation for Statistical Computing, Vienna, Austria. [Google Scholar]
- Rho M, Schaack S, Gao X, Kim S, Lynch M, Tang H 2010. LTR retroelements in the genome of Daphnia pulex. BMC Genomics 11: 425. [DOI] [PMC free article] [PubMed] [Google Scholar]
- Roy AM, Carroll ML, Kass DH, Nguyen SV, Salem AH, Batzer MA, Deininger PL 1999. Recently integrated human Alu repeats: Finding needles in the haystack. Genetica 107: 149–161 [PubMed] [Google Scholar]
- Schaack S, Pritham EJ, Wolf A, Lynch M 2010. DNA transposon dynamics in populations of Daphnia pulex with and without sex. Proc Biol Sci 277: 2381–2387 [DOI] [PMC free article] [PubMed] [Google Scholar]
- Schröder AR, Shinn P, Chen H, Berry C, Ecker JR, Bushman F 2002. HIV-1 integration in the human genome favors active genes and local hotspots. Cell 110: 521–529 [DOI] [PubMed] [Google Scholar]
- Sheen FM, Sherry ST, Risch GM, Robichaux M, Nasidze I, Stoneking M, Batzer MA, Swergold GD 2000. Reading between the LINEs: Human genomic variation induced by LINE-1 retrotransposition. Genome Res 10: 1496–1508 [DOI] [PMC free article] [PubMed] [Google Scholar]
- Stewart C, Kural D, Stromberg MP, Walker JA, Konkel MK, Stutz AM, Urban AE, Grubert F, Lam HY, Lee WP, et al. 2011. A comprehensive map of mobile element insertion polymorphisms in humans. PLoS Genet 7: e1002236. [DOI] [PMC free article] [PubMed] [Google Scholar]
- Toda Y, Saito R, Tomita M 1998. Comprehensive sequence analyses of 5′ flanking regions of primate Alu elements. Genome Inform Ser Workshop Genome Inform 9: 41–48 [PubMed] [Google Scholar]
- Van den Broeck D, Maes T, Sauer M, Zethof J, De Keukeleire P, D'Hauw M, Van Montagu M, Gerats T 1998. Transposon Display identifies individual transposable elements in high copy number lines. Plant J 13: 121–129 [DOI] [PubMed] [Google Scholar]
- Wang J, Song L, Grover D, Azrak S, Batzer MA, Liang P 2006. dbRIP: A highly integrated database of retrotransposon insertion polymorphisms in humans. Hum Mutat 27: 323–329 [DOI] [PMC free article] [PubMed] [Google Scholar]
- Wang GP, Ciuffi A, Leipzig J, Berry CC, Bushman FD 2007. HIV integration site selection: Analysis by massively parallel pyrosequencing reveals association with epigenetic modifications. Genome Res 17: 1186–1194 [DOI] [PMC free article] [PubMed] [Google Scholar]
- Watkins WS, Rogers AR, Ostler CT, Wooding S, Bamshad MJ, Brassington AM, Carroll ML, Nguyen SV, Walker JA, Prasad BV, et al. 2003. Genetic variation among world populations: Inferences from 100 Alu insertion polymorphisms. Genome Res 13: 1607–1618 [DOI] [PMC free article] [PubMed] [Google Scholar]
- Wheelan SJ, Scheifele LZ, Martinez-Murillo F, Irizarry RA, Boeke JD 2006. Transposon insertion site profiling chip (TIP-chip). Proc Natl Acad Sci 103: 17632–17637 [DOI] [PMC free article] [PubMed] [Google Scholar]
- Witherspoon DJ, Marchani EE, Watkins WS, Ostler CT, Wooding SP, Anders BA, Fowlkes JD, Boissinot S, Furano AV, Ray DA, et al. 2006. Human population genetic structure and diversity inferred from polymorphic L1(LINE-1) and Alu insertions. Hum Hered 62: 30–46 [DOI] [PubMed] [Google Scholar]
- Witherspoon DJ, Xing J, Zhang Y, Watkins WS, Batzer MA, Jorde LB 2010. Mobile element scanning (ME-Scan) by targeted high-throughput sequencing. BMC Genomics 11: 410. [DOI] [PMC free article] [PubMed] [Google Scholar]
- Wu X, Li Y, Crise B, Burgess SM 2003. Transcription start regions in the human genome are favored targets for MLV integration. Science 300: 1749–1751 [DOI] [PubMed] [Google Scholar]
- Xing J, Watkins WS, Witherspoon DJ, Zhang Y, Guthery SL, Thara R, Mowry BJ, Bulayeva K, Weiss RB, Jorde LB 2009a. Fine-scaled human genetic structure revealed by SNP microarrays. Genome Res 19: 815–825 [DOI] [PMC free article] [PubMed] [Google Scholar]
- Xing J, Zhang Y, Han K, Salem AH, Sen SK, Huff CD, Zhou Q, Kirkness EF, Levy S, Batzer MA, et al. 2009b. Mobile elements create structural variation: Analysis of a complete human genome. Genome Res 19: 1516–1526 [DOI] [PMC free article] [PubMed] [Google Scholar]
- Xing J, Witherspoon DJ, Jorde LB 2013. Mobile element biology: New possibilities with high-throughput sequencing. Trends Genet 29: 280–289 [DOI] [PMC free article] [PubMed] [Google Scholar]