

Abstract
Single-particle cryo electron microscopy (cryoEM) is a technique for determining three-dimensional (3D) structures from projection images of molecular complexes preserved in their “native,” noncrystalline state. Recently, atomic or near-atomic resolution structures of several viruses and protein assemblies have been determined by single-particle cryoEM, allowing ab initio atomic model building by following the amino acid side chains or nucleic acid bases identifiable in their cryoEM density maps. In particular, these cryoEM structures have revealed extended arms contributing to molecular interactions that are otherwise not resolved by the conventional structural method of X-ray crystallography at similar resolutions. High-resolution cryoEM requires careful consideration of a number of factors, including proper sample preparation to ensure structural homogeneity, optimal configuration of electron imaging conditions to record high-resolution cryoEM images, accurate determination of image parameters to correct image distortions, efficient refinement and computation to reconstruct a 3D density map, and finally appropriate choice of modeling tools to construct atomic models for functional interpretation. This progress illustrates the power of cryoEM and ushers it into the arsenal of structural biology, alongside conventional techniques of X-ray crystallography and NMR, as a major tool (and sometimes the preferred one) for the studies of molecular interactions in supramolecular assemblies or machines.
I. Introduction
Three-dimensional (3D) structures have been crucial to advancing our understanding of many biological processes, from molecular genetics, to enzymology, and to elucidation of how large biological machines work in life or fail to work in disease. X-ray crystallography and NMR have been the conventional tools for solving atomic resolution structures of macromolecules, but they can no longer keep pace with rapid developments in gene sequencing and the need to solve 3D structures of molecular assemblies with ever increasing size and complexity. Indeed, a major challenge of scientific research in the postgenomic era is to understand molecular interactions among components of large complexes by determining their 3D structures. Thanks to less stringent purity and quantity requirements for samples the emerging technology of cryo electron microscopy and single-particle reconstruction (collectively referred to as “cryoEM”) offers great promise for determining 3D structures of large biological complexes in noncrystalline, “native” states, and now at atomic detail.
Due to their large sizes and the often metastable nature of their structures, supramolecular complexes are usually difficult to study by X-ray crystallography and NMR. In the past decade, we have witnessed the steady progress of cryoEM playing an increasingly more important role in obtaining structures of supramolecular complexes or machines, initially at subnanometer resolution (Böttcher et al., 1997; Conway et al., 1997; Matadeen et al., 1999; Zhou et al., 2000, 2001a, 2003; Modis et al., 2002; Golas et al., 2003; Valle et al., 2003; Zhang et al., 2003; Saban et al., 2005, 2006; Chandramouli et al., 2008), to near-atomic resolution a couple of years ago (Jiang et al., 2008; Ludtke et al., 2008; Yu et al., 2008; Zhang et al., 2008b; Chen et al., 2009; Cheng et al., 2010; Cong et al., 2010; Wolf et al., 2010; Zhang et al., 2010a), and very recently at atomic resolution (Zhang et al., 2010b; Liu et al., 2010). This steady progress represents a significant advance in biological sciences and makes cryoEM a tool of choice for the structural studies of macromolecular assemblies. At near-atomic resolution (~4 Å or worse), one can begin to build backbone models, although such effort is often very challenging and error prone. At about 3.5 Å resolution, one can derive atomic coordinate information directly from the cryoEM density maps without referring to existing 3D structures. Structural models at atomic resolution significantly enhance the value of cryoEM structures because understanding mechanisms of biological function often relies on visualization of active sites to atomic detail. Rational design of therapeutic strategies, an ultimate goal of many structural biology projects, also requires determination of atomic coordinates of the involved compounds.
In 2003, I wrote a review with Wah Chiu in this same series, summarizing technical advances in determining structures at subnanometer resolution (Zhou and Chiu, 2003). Since then, significant technological advances have been made in pushing the resolution to near-atomic (Jiang et al., 2008; Ludtke et al., 2008; Yu et al., 2008; Zhang et al., 2008b), and atomic resolution (Liu et al., 2010; Zhang et al., 2010b). This review first highlights a number of recently published atomic or near-atomic structures of large complexes to showcase the state of the art in high-resolution cryoEM. I will illustrate its power by showing examples of cryoEM structures revealing new features not resolved by X-ray crystallography of isolated proteins at similar resolutions. These examples will be followed by a series of technical considerations, leading to the latest progress of reaching atomic resolution structural interpretation of macromolecular assemblies by cryoEM single-particle reconstruction.
II. Atomic Structures of Viruses at Stable and Metastable States by CryoEM
Viruses are supramolecular assemblies with sizes ranging from 30 to 200 nm in diameter. They are the causative agents of major human diseases, including AIDS, swine flu, and some cancers, as well as sexually transmitted diseases. A major portion of viruses are spherical in shape and can be further divided into three categories based on their architectures: icosahedral, icosahedral variants (e.g., tailed bacteriophages), and pleomorphic. The 60-fold structural redundancy of icosahedral viruses provides a rich source of signal in their cryoEM images and reduces the number of particles images required for 3D reconstruction by 60-fold. As a result, cryoEM images of icosahedral viruses are relatively easy to process and fewer particles images are required to obtain a high-resolution 3D structure. Therefore, it is no surprise that icosahedral viruses are extensively studied by single-particle cryoEM, and to date, their structures represent the highest resolution structures determined using this technique (e.g., Jiang et al., 2008; Yu et al., 2008; Zhang et al., 2008b; Chen et al., 2009; Cheng et al., 2010; Liu et al., 2010; Wolf et al., 2010; Zhang et al., 2010b).
Viruses in the Reoviridae family represent one of the largest and most structurally divergent groups of viruses. They are nonenveloped and have a segmented dsRNA genome, enclosed by single, double, or triple pro-teinaceous capsid shells, and with hosts ranging from vertebrates, invertebrates, plants, fungi, and prokaryotes (Reinisch, 2002; Mertens, 2004). These viruses have been favorite subjects of structural studies by both X-ray crystallography and cryoEM. Without a lipid bilayer, these viruses invade cells by penetrating the cell membrane. They do so through a poorly understood process that is accomplished by viral membrane-penetration proteins. In contrast, the mechanism of membrane fusion used by enveloped viruses such as the human immunodeficiency virus (HIV) and the influenza virus is well understood. To survive in a harsh environment, the viral membrane - penetration protein is kept in a dormant, stable state by binding to a “protection protein” in the virion. To penetrate the cell membrane during infection, this viral membrane penetration protein must be converted to a metastable, primed state by proteolytic removal of its protection protein, resulting in formation of an infectious subvirion particle (ISVP). Structural information of both the dormant and primed states is needed to gain insight into the mechanism of this dormant-to-primed conversion of the membrane penetration proteins of the turreted dsRNA reoviruses. Atomic structure in a stable dormant state has been determined by both X-ray and cryoEM. In the absence of an atomic structure at the metastable, primed state of the membrane penetration protein and the molecular details of the dormant-to-primed conversion are unknown.
One such viral structure of particular relevance for consideration here is that of the grass carp reovirus (GCRV), an aquareovirus in the family Reoviridae. Not only does the 3.3 Å resolution of the GCRV ISVP represent the currently highest resolution achieved by single-particle cryoEM, but it also illustrates the power of cryoEM in structural determination of transiently stable or metastable states of viral infections. GCRV is used to study mechanisms of nonenveloped virus infection. During cell infection, GCRV transforms from a stable, dormant state to a metastable state, primed for membrane penetration. Without the atomic structure of the primed state, the penetration mechanism was poorly understood.
Due to the metastable property of the ISVP, cryoEM is particularly suitable for its structural determination because no crystal is required and because freshly prepared samples can be preserved in their native state by flash freezing. Using this method, we have reconstructed the 3D structure of GCRV ISVP to approximately 3.3 Å (Zhang et al., 2010b) (Fig. 1). The density map reveals side-chain densities of all types of amino acids (Fig. 1A–D), except glycine, which has none. The resolution of these side-chain densities has enabled the ab initio construction of a full-atom model of the viral particle, which is composed of 900 molecules of four structural proteins (Fig. 1E). The atomic structure of the primed aquareovirus ISVP reveals that conversion of VP5 is accompanied by an autocleavage at the Asn42–Pro43 bond (purple and green balls in Fig. 1E, respectively), probably due to a nucleophilic attack facilitated by nearby Lys84 and Glu76 residues. The atomic structure also reveals the density of an N-terminal covalently linked myristoyl group in VP5 (red balls in Fig. 1E), the membrane-insertion “finger,” which is sheltered in a hydrophobic pocket. Release of this myristoyl group from the pocket will be required in a later step during membrane penetration. These results suggest a well-orchestrated process of nonenveloped virus entry involving autocleavage of the penetration protein prior to exposure of its membrane-insertion finger.
Fig. 1. CryoEM structure of the “primed” aquareovirus ISVP.

(A) CryoEM density of a VP5 monomer segmented from the 3.3-Å map of the ISVP superimposed with its backbone model. (B) Stereo view of the box from (A), superimposed on its atomic model. (C) CryoEM density of VP3A segmented from the 3.3-Å map of the ISVP and superimposed with its backbone model. (D) CryoEM densities of the four boxed regions in (C) showing side chains. Box 1 also shows a carboxyl oxygen (arrow). Boxes 2 and 3 show that different aromatic amino acids are readily distinguished. (E) Atomic model of the ISVP. Ribbon models of the atomic structures of the six conformers from four structural proteins are shown in the periphery: one VP5, one VP1, two VP6, and two VP3. These are color coded according to amino acid sequence from blue (N-terminus) through green and yellow to red (C-terminus). The black triangle demarcates a VP5 trimer. Reproduced from Zhang et al. (2010b) with permissions.
III. Structures of Molecular Assemblies of Low-Symmetry and Asymmetry
Molecular chaperone complexes have been another favorable class of assemblies for high-resolution cryoEM structural studies. The structures of both group I and group II chaperonins have been determined to near-atomic resolution by single-particle cryoEM with and without imposing symmetry operations. Prior to these cryoEM efforts, the structures of GroEL and GroEL–GroES complexes were solved to about 3 Å resolution by X-ray crystallography (Braig et al., 1994; Xu et al., 1997). Structures of GroEL, a prototypical group 1 chaperonin, were determined by cryoEM to near-atomic resolution by single-particle cryoEM reconstruction at 4.2 and 4.7 Å resolution, by imposing D7 and C7 symmetry, respectively (Ludtke et al., 2008). The Cα model derived from the C7 cryoEM structure revealed differences between the two rings and from existing crystal structures, including an asymmetric salt bridge, density in the nucleotide-binding pocket of only one ring, and small shifts in α-helix positions.
The second example is the cryoEM structure of the 16-subunit homo-oligomeric chaperonin from the mesophilic archaea methanococcus mar-ipaludis (Mm-cpn), a group II chaperonin (Zhang et al., 2010a). The 3D structures of the wild-type and lidless Mm-cpn were determined to 4.3 and 4.8 Å, respectively, both in the closed state (Fig. 2). The resolution of the wild-type Mm-cpn was sufficient for unambiguous segmentation of the density of each subunit and the modeling of the subunits from residues 1 to 532 (Fig. 2B). At this resolution, α-helix pitches, β-strands, and large side-chain densities were visible in the density map (Fig. 2C). These features allowed for the construction of the atomic model based on the cryoEM density. Interestingly, density probably representing nucleotide in the ATP-binding pocket was also seen (Fig. 2D).
Fig. 2. CryoEM structures of the wild-type and lidless (Δlid) Mm-cpn structure in the closed state.

(A) Shaded surface view of the two cryoEM density maps with one subunit colored blue (wild type, WT) and green (lidless, Δlid) at 4.3 and 4.8 Å resolution, respectively. (B) Backbone model of the wild-type closed-state Mm-cpn subunit. The black arrow indicates the nucleotide-binding pocket. Helices are labeled from A to P. (C) Examples of visible side-chain densities (blue mesh) in the wild-type Mm-cpn map. (D) Density map (gray mesh) and backbone model (sticks) around the nucleotide-binding pocket. Reproduced from Zhang et al. (2010a) with permissions.
The eukaryotic chaperonin, TRiC (TCP1-ring complex) has a unique, double-ring organization with different paralogous subunits in each ring and presents a significant challenge for structural determination (Booth et al., 2008; Cong et al., 2010). The asymmetric reconstruction of TRiC structure, obtained at 4.7 Å resolution (Cong et al., 2010; Fig. 3), nicely demonstrates the power of EMAN (Ludtke et al., 1999) in resolving subtle structural differences among subunits of pseudo-symmetric assemblies. The 4.7-Å asymmetric reconstruction revealed a twofold symmetry between the two rings of the complex, which was subsequently exploited for noncrystallographic averaging to further improve the signal/noise ratio and the final resolution of the complex to 4 Å (Cong et al., 2010). The 4-Å map revealed a large portion of side-chain densities in all the eight subunits (Fig. 3C–J). Modeling of the eight subunits was challenging and was aided by homology modeling to obtain initial Cα models of the subunits using the group 1 chaperonin crystal structure. These Cα backbone models were refined against the cryoEM density. The-side-chain density features were used to localize subunit-specific amino acids and assign which subunits correspond to the densities within each of the two rings of TRiC (Cong et al., 2010). Independent biochemical near-neighbor analysis was performed to confirm the cryoEM-derived TRiC subunit arrangement. The atomic model of the TRiC revealed an unevenly distributed positively charged wall lining the closed folding chamber of TRiC that differs strikingly from that of prokaryotic and archaeal chaperonins.
Fig. 3. Match of the side-chain densities with the model for each of the eight TRiC subunits.

(A) Location of this stretch (Sky Blue, including the protruding helix H8 and the connected loop) in a complete TRiC subunit (gray). The three domains are labeled. (B) Sequence alignment of bovine TRiC eight subunits in that apical domain region as shown in (A). Unique sequence stretches of each subunit are highlighted by red characters. Either one or a combination of several such characteristic stretches can serve as a fingerprint for each TRiC subunit. (C) Subunit map (blue meshes) with the optimized model of the best matching CCT8(θ) (red). The residues with the clearly observable side-chain densities are labeled in black or red. Here, the red labels correspond to the residues in the unique stretches of CCT8(θ) as in (B). (D–J) Similar rendering style as in (C) for each of the subunit maps and the corresponding optimized models in the equivalent region. Reproduced from Cong et al. (2010) with permissions from authors and publisher.
IV. Resolving Structures Not Seen by Conventional Methods of Atomic Structure Determination
A recurring observation of high-resolution cryoEM structural studies of large supramolecular assemblies is that cryoEM maps often reveal structural features invisible in the X-ray crystallography structures of individual molecular components at similar resolutions. Expectedly, these new structural features are often related to in situ molecular interactions that are absent in isolated individual molecules.
For example, using cryoEM images recorded on a CCD camera, Cheng et al. reconstructed the GCRV aquareovirus virion to 4.5 Å resolution (Cheng et al., 2010; Zhu et al., 2010) and constructed backbone models for the seven conformers of five aquareovirus proteins using cryoEM density-constrained homology modeling. The cryoEM structure of the aquareovirus revealed their subunit structures very similar to the X-ray structures of the orthoreovirus core (λ1, λ2, and σ2) and coat proteins (μ1 and σ3) (Reinisch et al., 2000; Liemann et al., 2002). But the cryoEM structure also revealed new features not observed in the homologous X-ray structures, including an extended amino-terminal segment in the capsid shell protein VP3B of GCRV (Fig. 4A). This N-terminal segment forms an approximately 120-Å-long α-helical-rich extension bridging across the molecular interface near each twofold symmetry axis, which is devoid of the external cementing structure observed in orthoreoviruses.
Fig. 4. Extended arms and conformational adaptations: newly resolved regions in cryoEM structures that are not resolved by x-ray crystallography of isolated proteins.

(A) The extended N-terminal arm in the capsid shell protein VP3B inserts into two neighboring VP3A molecules across the icosahedral twofold axis (indicated by “2”) (Cheng et al., 2010). The right panel shows a VP3B monomer with its atomic model in colored ribbons (different colors differentiate different domains) and cryoEM density map in gray semitransparent shade. Key amino acids in the extended arm are indicated. (B) Extended N-terminal arm of the rotavirus VP7 revealed by cryoEM (Chen et al., 2009). Structure of a VP6–VP7 heterohexamer, derived from the crystal structures of VP6 (green) (Mathieu et al., 2001) and VP7 (gold) (Aoki et al., 2009), docked into the cryoEM density, and from the model built into cryoEM density for the N-terminal arm. The region containing one VP7 N-terminal extended arm (residues 58–78) is blown up and shown superimposed with its corresponding cryoEM density at 4.5 Å resolution, revealing its interaction with VP6 with key amino acids and β-strands indicated. (C) CryoEM model of the bovine papillomavirus L1 protein showing the extended N-terminal and C-terminal arms (color) of L1 subunits A–E, superposed so that their core β-jelly rolls coincide (gray ribbon). The parts of the C-terminal arms that insert into the subunits of the neighboring pentamer are shown as thicker worms. The cysteines of the interpentamer disulfide are indicated by yellow balls. Inset: icosahedral asymmetric unit showing the pattern of C-terminal loops inserting into neighboring subunit. (D) CryoEM model of the human adenovirus hexon protein. Red ribbons show agreement with the X-ray model (Rux et al., 2003). Blue ribbons show the newly resolved pieces, including the N-terminal and the C-terminal extensions. Region names in the hexon monomer (e.g., VC, FG, etc.) follow Rux et al. (2003). Conformational adaptation of the N-terminal (middle) and C-terminal (right) extensions: (middle) 12 hexon monomers exhibit five types of N-terminal extension in an asymmetric unit: four of type 1, two each of types 2 and 3, one of type 4, and three of type 5; (right) 12 hexon monomers exhibit six types of C-terminal extension: two each of types a, b, c, and d, three of type e, and one of type f. Panels (A–D) are reproduced from Cheng et al. (2010), Chen et al. (2009), Wolf et al. (2010), (Liu et al. (2010)), respectively, with permissions from the authors and publishers.
Also a member of the Reoviridae, rotavirus has been subjected to extensive structural studies by both cryoEM (e.g., Prasad et al., 1990; Zhang et al., 2008b; Chen et al., 2009; Li et al., 2009) and X-ray crystallography (Dormitzer et al., 2004; Aoki et al., 2009; McClain et al.; Prasad et al., 2001). The structure of VP7 bound with a neutralizing Fab was solved by x-ray crystallography to 3.4 Å resolution (Aoki et al., 2009). The latest rotavirus cryoEM reconstruction of the VP7-recoated triple shell particle was determined at approximately 4 Å resolution (Chen et al., 2009; Fig. 4B). This resolution was sufficient for tracing the VP7 polypeptide chain, including the N-terminal region of VP7 that was not seen in its X-ray crystal structure. The three well-ordered, 30-residue, N-terminal “arms” of each VP7 trimer grip the underlying trimer of VP6 of the underlying inner capsid (Fig. 4B).
Even for cases where both cryoEM and X-ray crystallography are used to study the structures of similar supramolecular assemblies, the cryoEM map could also resolve additional structural features. One such example is the structures of papillomaviruses. Papillomaviruses belong to a group of dsDNA viruses associated with epithelial growths and tumors and have a compact capsid assembled from 72 pentamers of the protein L1 (Rayment et al., 1982; Baker et al., 1991; Liddington et al., 1991; Stehle et al., 1994). A cryoEM reconstruction of the bovine papillomavirus was recently obtained at approximately 3.6 Å resolution by merging only approximately 4000 particle images through a careful refinement of their defocus values using the program CTFTILT (Mindell and Grigorieff, 2003; Wolf et al., 2010). The cryoEM map was used to trace the polypeptide chain of L1 in the context of the virion. The long, C-terminal arms loop out from the jelly roll core of the protein subunit and interact (including a disulfide bond) with two subunits in a neighboring pentamer (Fig. 4C). Unlike the invading C-terminal arms resolved in the X-ray structure of polyomaviruses (Liddington et al., 1991), which terminate within the target subunit, those of pappilomavirus L1 insert back into the jelly roll core of the pentamer from which they emerge (Fig. 4C inset). Therefore, they are essentially elaborate loops with variable conformations extending away from the jelly roll core of each L1 to create interpentamer contacts (Fig. 4C, inset). The much shorter N-terminal extension (residues 1–20) also participates in a set of interpentamer contacts, largely with other N-terminal arms. Three of these N-terminal arms are variable and the rest are essentially invariant (Fig. 4C). This high-resolution structure also revealed an error in an earlier model of the virion derived from fitting of atomic coordinates of L1 from small virus-like particles (Chen et al., 2000) into a low-resolution (9 Å) cryoEM structure (Modis et al., 2002).
Similarly, this notion of extended arms was also observed during comparison of the cryoEM structure of the major capsid proteins in the human adenovirus virion (Liu et al., 2010) with those from X-ray crystallography (Roberts et al., 1986; Rux et al., 2003; Zubieta et al., 2005; Fig. 4D). Derived from the cryoEM density map of the whole virion, the atomic models of the human adenovirus penton base and hexon proteins are both in excellent agreement with their respective X-ray structures (Roberts et al., 1986; Rux et al., 2003; Zubieta et al., 2005). In addition, the 3.6 Å cryoEM models (Liu et al., 2010) reveal features not seen in the crystal structures, as well as many in situ interactions absent from the crystal structures of individual proteins in isolation. For example, at the N-terminus of each penton base monomer we resolved amino acids (aa) 37–51, which are not seen in the crystal structure. This string of amino acids interacts with two adjacent protein IIIa monomers and then turns inward to connect with the genome core, thus anchoring the penton base. In the hexon protein, we also observed an N-terminal extension (aa 2–7) and a C-terminal extension (aa 944–950) of the hexon (Fig. 4D). With four types of hexon (H1–H4) in an asymmetric unit, there are 12 hexon monomers (Fig. 4D), but depending on the location of the subunit and adapting to its interaction with neighboring proteins (Fig. 4D), the N-terminal extension shows just five different conformations for its short stretch of amino acids. Some of these conformations interact with minor proteins IIIa and VIII on the inner surface, others with neither. Likewise, the C-terminal extension shows different conformations, six in this case. The first three, like the C-terminal extension type a, interact with protein VIII; the last three do not.
At the top of the hexon in the cryoEM model are the newly resolved structures of four loops (aa 251–256, 271–278, 431–436, 443–444) (Fig. 4D, blue ribbons and labels). The first three are within the hypervariable regions HVR4, HVR5, and HVR7 that are important for type-specific immunogenici-ty (Rux et al., 2003). The one loop (aa 251–256) in the H4 hexon monomer interacts with the tip of the four-helix bundle of protein IX and anchors the latter in the valley between two hexons (Liu et al., 2010).
V. Strategies for Atomic Structure Determination by CryoEM
The process of obtaining a 3D structure from 2D cryoEM images consists of two main tasks: determination/refinement of particle parameters (orientation and center, underfocus values, etc.) and 3D reconstruction through merging of many particle images (DeRosier and Klug, 1968; Crowther et al., 1970; Crowther, 1971). The task can be further divided into several steps to obtain accurate assignment of the orientation and center of each image, followed by 3D reconstruction. Therefore, advancing cryoEM reconstruction to atomic resolution requires careful considerations of many aspects, as described in greater detail below, including sample handling, cryoEM imaging, efficient algorithms, and fast software tools to process tens of thousands of particle images, and atomic modeling tools optimized for use with cryoEM-derived density maps. With continuous improvements in cryoEM instrumentation (e.g., more stable electron beams and sample stages, better electron optics, and larger CCD cameras) and automation of image acquisition (Potter et al., 1999; Carragher et al., 2000; Suloway et al., 2005), and data processing (Lander et al., 2009) by integrating the power of individual software packages such as EMAN (Ludtke et al., 1999), Frealign (Grigorieff, 2007), IMIRS (Liang et al., 2002), Spider (Frank et al., 1981), and IHRSR (Egelman, 2007), in a few years, it might become a routine practice to pursue structural determination of supramolecular assemblies at near-atomic resolutions by cryoEM.
A. Samples Suitable for Atomic Resolution Studies
An obvious requirement for atomic resolution determination by cryoEM single-particle reconstruction is that the specimen under investigation should only contain a structurally homogeneous particle population so that its structural features can be enhanced through averaging of many particle images. In X-ray crystallography, structural homogeneity is intrinsically guaranteed at two stages: first, through the crystallization process that only selects for particles with identical structures and second, by using only those crystals that diffract to atomic resolution. Since cryoEM does not require crystals for structural determination, there is no easy means to ensure structural homogeneity among complexes selected for single-particle analysis. Many factors can contribute to structural heterogeneities across different particles, making them unsuitable for atomic resolution structural studies. First, some supramolecular assemblies, such as enveloped viruses, are naturally pleomorphic (having undefined structure forms, such as influenza virus and HIV) or polymorphic (having many different structural forms). Second, sample handling, such as high speed centrifugation and freeze-and-thaw steps, can often be detrimental to the structural integrity of large complexes leading to heterogeneous structures in a purified sample. Third, certain complexes are less structurally “robust” than others and are more susceptible to structural heterogeneity introduced by sample handling. For example, lipid bilayer is commonly considered to be 2D fluid; therefore, lipid-containing enveloped viruses are usually not as structurally rigid as viruses consisting of only protein capsids. While sample impurity can be readily assessed in cryoEM images, resolution-limiting structural heterogeneity is difficult to sort out computationally. Therefore, in contrast to the requirement for high sample purity in X-ray crystallography, it can be said that structural homogeneity of the sample is more important than purity in high-resolution cryoEM reconstruction.
In addition to structural homogeneity across different particles, there is also a range of particle sizes that is optimal for atomic resolution determination. A larger particle size typically means more mass in each particle, leading to a high signal/noise ratio in each cryoEM image for more accurate alignment of particle parameters. However, when the size exceeds 700 Å in diameter, the phase errors due to the focus variation across the depth of the particle (from top to bottom), if left uncorrected for, become a limiting factor towards atomic resolution reconstruction. (see section below).
B. CryoEM Imaging and Image Assessment
Modern cryo electron microscopes, particularly those equipped with the new generation detached specimen holder with significantly reduced specimen drifting, can be used to record images containing atomic data. A number of factors need to be carefully considered for imaging ice-embedded samples to atomic resolution. For example, the cryoEM instrument should be optimally aligned so that the electron beam is parallel and with minimal beam tilt to minimize phase errors across different particle images. In addition, the contrast transfer function (CTF), including astigmatism, should be corrected for particle images considering defocus gradients both across the image plane and along the depth of the sample. Prior to data processing and structural refinement, the image resolution of cryoEM micrographs should be carefully evaluated by examining the extent of visible CTF rings in the incoherently averaged Fourier transform of particle images (Zhou et al., 1996; Fig. 5).
Fig. 5. CryoEM imaging and image assessment.
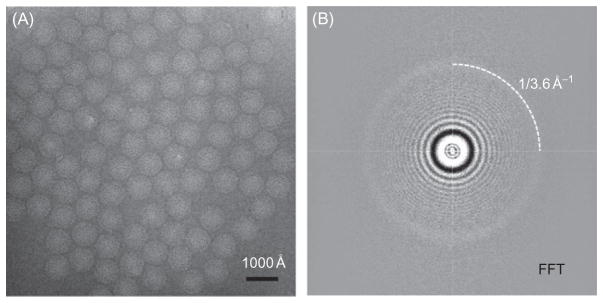
(A) CryoEM-image of the aquareo-virus GCRV ISVP embedded in vitreous ice across holes. The defocus is 1.2 μm under-defocus. (B) Fourier-transform spectrum of the image in (A), showing contrast transfer function rings visible beyond 1/4 Å−1. A strong ring is visible at approximately 1/3.6 Å−1 (dashed arc), indicating the image contains information beyond 3.6 Å. Reproduced from Zhang et al. (2010b) with permission.
Used to enhance image contrast in cryoEM in the absence of a Zernike phase plate (Danev and Nagayama, 2001), underfocusing has the unfortunate effect of convolving the image through an undulating CTF, which is a function of the underfocus value (Figs. 5 and 6). Therefore, the level of underfocusing used during imaging varies due to specimen unevenness and has to be experimentally determined for an accurate deconvolution of the CTF for high-resolution 3D reconstruction. The accuracy of the estimation of the underfocus values directly limits the attainable resolution of the final reconstruction. For example, with an inaccuracy in the defocus value determination of only 0.4 μm, the resolution of the final reconstruction will be limited to about 3.9 Å (Fig. 6). For this reason, the simple CTF correction method of ignoring astigmatism and assuming perfectly circular CTF rings would be insufficient to achieve atomic resolution. Based on CTF rings visible in the Fourier transforms of particle images (Zhou et al., 1996), the two defocus values describing the defocus in cryoEM with astigmatism can be determined using programs such as CTFFIND (Mindell and Grigorieff, 2003).
Fig. 6. Simulated contrast transfer functions (CTF) illustrating the importance of accurate defocus determination.

The CTF of 300 kV images at two slightly different underfocus values (0.80 μm, solid line and 0.76 μm, dashed line) begin canceling each other at resolution of 3.9 Å, indicating an accuracy better than 0.4 μm in defocus determination is required for 3.9 Å resolution reconstruction.
Even though the Fourier transform of a cryoEM image corresponds to the sum of the Fourier values on two spheres (called Ewald sphere curvature) in reciprocal space (DeRosier, 2000; Wan et al., 2004), most current reconstruction methods, which are based on the central projection theorem (Crowther, 1971), assume that the two spheres are flat, as a single-degenerated central section of the 3D Fourier transform of the original object, thus limiting the final resolution of the reconstruction. The resolution limit imposed by the Ewald sphere curvature is estimated by the following equation:
where dm and D denote resolution and thickness of the complex under study, respectively (DeRosier, 2000).
Based on this equation, if the Ewald sphere curvature is not taken into consideration, the achievable resolution would be limited to 4.2 Å for herpesvirus (~1250 Å diameter), ~3.6 Å for adenovirus (~920 Å diameter), and ~3.3 Å for aquareovirus (~780 Å diameter), respectively. However, these limits are only strictly true when the number of images used for reconstruction is small and can be removed by separating the Fourier values on the two spheres as proposed by iterative computational procedures (DeRosier, 2000; Wan et al., 2004; Wolf et al., 2006; Leong et al., 2010). When a large number of particle images is available, particularly in the presence of symmetry, such as the case of icosahedral viruses, the limiting effect might be somewhat alleviated simply by imposing symmetry and averaging many particles at different views during 3D reconstruction. Averaging or symmetrization brings structural information near the central region (“good” information) of the particle to “repair” or average the incorrect structural information (“bad” information) contributed by structures located away from the central region, such as the top and bottom of the particle where the effects of Ewald sphere curvature are the greatest. For this reason, the net result of ignoring the effects of Ewald sphere curvature in large icosahedral virus reconstruction is similar to introducing yet another envelope damping function (or B factor) to the structural factor. If not considered during reconstruction, the total number of required particle images for atomic resolution structural determination will be increased substantially.
C. Data Processing Pipeline with an Iterative Alignment-Reconstruction Refinement Loop
Our scheme of obtaining atomic resolution reconstruction is shown in Fig. 7. An initial model can be obtained using the common-lines approach (Crowther, 1971; Fuller et al., 1996; Liang et al., 2002). Further orientation and center refinement is accomplished by means of a single iterative refine-ment loop basedonprojection matching (shown in the big curvedarrow at the bottom of Fig. 7). This iterative refinement loop can be performed by several different methods, as those implemented in IMIRS (Liang et al., 2002), Frealign (Grigorieff, 2007), and EMAN (Ludtke et al., 1999).
Fig. 7. Flow chart of data processing for atomic resolution cryoEM reconstruction.

Data processing steps are indicated by arrows with modular programs used for each step listed alongside each arrow. The most computational intensive steps are the iterative refine-ment loop at the bottom of the chart. At each iterative refinement loop, the template set containing 2D projections from the latest 3D reconstructions is updated.
In the strategies implemented in IMIRS, the refinement loop iterates between particle alignment and 3D reconstruction in two steps. During the refinement step, computed projections from the current best 3D map are used to refine the center and orientation parameters of high-resolution images (Zhou et al., 1995, 1998) based on the common-lines method (Crowther, 1971; Fuller et al., 1996; Zhou et al., 1998). This procedure has the advantage of refining the center and orientation simultaneously and with high computational efficiency through parallel processing (Zhou et al., 1998). It has been successfully used to reconstruct several structures to atomic resolution. Using only “lines” of information, per contra, the common-lines approach is intrinsically limited in robustness and is sensitive to the noise present in high-resolution images. Consequently, the selection rate for “good” particle images of this method might be less than that of the projection-matching methods (Baker and Cheng, 1996; Grigorieff, 2007). Typically, over 50% of particle images are discarded because their parameters cannot be determined accurately at high resolution due to the presence of high levels of noise, particularly for very close to focus particle images. After each cycle, the effective resolution is estimated and used as a resolution cutoff in the next alignment cycle until the reconstruction converges to a stable one and no further improvement in resolution can be obtained.
D. Computational Aspects of 3D Reconstruction
Based on geometry alone, the number of particle images, N, needed to reconstruct a large complex to atomic resolution is rather small and depends on particle diameter D and the targeted resolution d according to the expression N=πD/d (Crowther et al., 1970). For example, an icosahedral virus 1250 Å in diameter, for which N is reduced 60-fold due to the 5-3-2 symmetry, theoretically requires as few as 17 images to compute a 4-Å map if the images are distributed evenly around a single axis. However, because of the poor statistical definition in low-dose phase-contrast images in cryoEM, particularly those targeting high-resolution that are often recorded under close-to-focus conditions, and also because of structural variations among the macromolec-ular complexes in solution (Kong et al., 2003; Borgnia et al., 2004), thousands of times that number of particle images must actually be used to enhance the high-resolution features for atomic resolution reconstruction. In fact, both empirical experience in improving the resolution of cryoEM reconstructions (Böttcher et al., 1997; Conway et al., 1997; Matadeen et al., 1999; Mancini et al., 2000; Gabashvili et al., 2000; Zhou et al., 2000, 2001a) and theoretical estimation based on comparisons of the scattering power of electrons and X-ray photons in biological samples (Henderson, 1995) indicate that an exponential relationship exists between the number of particle images used and the resolution achieved.
The steep increase in the number of particles is related to the fall-off in the Fourier amplitudes at higher spatial frequencies, which can be considered as a Gaussian function and commonly referred to as the damping or B factor, which approximates the combined influences of instrumentation and user operation as well as the heterogeneity of structural states (Saad et al., 2001; Zhou et al., 2001b). Therefore, we must minimize the B factor to reduce the number of required images as we progress toward better resolution. To do so requires the acquisition of images richer in high-resolution signals and the development of better image processing methods to select “good” particles with smaller B factors and eliminate “bad” particles with larger B factors (Saad et al., 2001).
As a consequence of the exponential increase in image data to be processed, computing an atomic resolution reconstruction of a large particle is highly complex and requires a large amount of computation power. A practical solution to this computational problem in cryoEM 3D reconstruction is through the optimal utilization of the processing capabilities of both commodity graphics hardware (i.e., general purpose graphics processing unit [GPGPU]) and central processing unit (CPU). The Nvidia GPU Tesla contains 240 processing cores, each with 4Gflops computational power. A workstation system can be equipped with at up to 4 such GPUs and has 960 processing cores with 4Tflops computation power, comparable to a mid-size cluster of 1200 CPU cores (AMD Opteron 2.2G). New programs, such as eLite3D (Zhang et al., 2010c) within the framework of the IMIRS package and GPU-enabled versions of existing program packages of Frealign (Li et al., 2010), have made it possible to complete a 3-Å resolution reconstruction in a few days using a single PC with GPUs.
E. Atomic Modeling
The value of a cryoEM density map is quite limited in explaining the mechanisms of biochemical functions in the absence of atomic models. A correct atomic model derived from a cryoEM map significantly increases the information content of the density map. With atomic models, molecular interactions within a supramolecular assembly can be described in chemical terms; specific hypotheses can be formulated for testing experimentally by structural-based mutagenesis (Ge et al., 2010); and from a technical point of view, the iterative alignment-reconstruction refinement loop described in Section V.C can be augmented to also include the atomic model and well-established chemical constraints (such as side-chain rotamers, bond angles and length, van de Waals interactions and electrostatic interactions, etc.).
Prior to modeling, the quality of the map of some protein subunits can be further improved by averaging monomers (one conformer) in each asymmetric unit (He et al., 2001; Zhang et al., 2008b). An empirical B factor can be estimated with trial-and-error method by monitoring the noise level, continuity of backbone densities and features of side-chain densities and used to enhance the appearance of high-resolution features to aid subsequent steps of model building.
The first step of interpreting a cryoEM map is an objective assessment of the quality of the density map with respect to its information content to reveal fine structural features that are consistent with biochemical data (i.e., amino acid sequences) and with respect to the level of noise in the map. Typically, the big map is segmented into small structural components with program such as Chimera (Pettersen et al., 2004) so that features can be examined in detail and subsequently used for model building.
It cannot be emphasized enough that great caution should be exercised when attempting to build models using cryoEM maps only at near-atomic or moderate resolutions (~4 Å). Such maps contain regions with branched densities and only a limited number of side-chain densities, making backbone tracing difficult and prone to mistakes. In addition, atomic model building is difficult to proceed due to the lack of landmarks to guide the registration of amino acid residues. For this reason, only backbone models should be attempted for such maps. Under the favorable situations where highly homologous structures are known to atomic resolution, a homology backbone model can be first obtained by sequence-based comparative modeling. Subsequently, the preliminary backbone models can be refined by optimizing the fit between the cryoEM density map and the coarse model derived from homology modeling (Cheng et al., 2010; Zhu et al., 2010).
In the absence of homologous structural models, two modeling approaches have been used to construct either backbone or full-atom models based on cryoEM density maps. The first approach is to develop a new modeling method that is tailored to the characteristics of cryoEM density maps (Ju et al., 2007; Baker et al., 2010). This is desirable particularly when the cryoEM map is only at near-atomic resolution (Jiang et al., 2008; Ludtke et al., 2008; Cong et al., 2010; Zhang et al., 2010a).
An alternative strategy is to simply adapt existing modeling tools and validation programs/protocols well developed for protein crystallography for model building based on cryoEM density map. This approach was used for building the atomic models for the aquareovirus ISVP (Zhang et al., 2010b) and the human adenovirus (Liu et al., 2010) and is described in detail below. As illustrated in Fig. 8, this approach requires that many discriminative side-chain densities are resolved in the cryoEM density map. A Cα model is first created by following the carbonyl positions visible in the peptide chain of the density map with well-established model building tools like Coot (Emsley and Cowtan, 2004). Amino acids are then identified and serve as landmarks to create a coarse model. Full-atom models are constructed with the help of REMO (Li and Zhang, 2009). The fit of the atomic model to the density map is improved with iterative cycles of model rebuilding using COOT and geometry refinement using O (Jones et al., 1991) until no obvious improvement can be obtained.
Fig. 8. Building models from cryoEM map.

(A) Flowchart of interpreting cryoEM density map through atomic modeling. (B) Steps in manual model building from cryoEM density map. One can use the baton_build utility in (O) to trace the polypeptide chain, register amino acid residues and generate a Cα (backbone) model. A coarse model is then generated by REMO (Li and Zhang, 2009) which is subjected to model refinement.
The initial coarse model is inaccurate (e.g., bad bond length and angles, improper dihedral angles, and close contacts) and must be refined to improve stereochemistry and the fit to the cryoEM density map. The model’s stereochemistry can be rigorously checked in two ways. First, one can visually inspect the fit of the model to the experimental density map using molecular graphics programs and their built-in geometry-regularization utilities. Second, well-established programs in protein crystallography, such as Procheck (Laskowski et al., 1993) and What_Check (Hooft et al., 1996), can be used to identify regions with poor stereochemistry with special attention to nonideal bond lengths and angles, as well as planar groups deviating from ideal geometry and violation of Ramachan-dran plot of main-chain torsion angles.
Finally, the initial models can be further refined in a pseudocrystallo-graphic manner as was first done in the aquareovirus ISVP work (Zhang et al., 2010b). In this approach, densities for individual components are put into artificial P1 crystal lattices, and structure factors (FO and aO) are calculated using the utility program em_map_to_hkl.inp in CNS (Brunger et al., 1998). These structure amplitudes are used as pseudoexperimental FO for the refinement of the models, based on crystallographic conjugate gradient minimization and simulated annealing refinement protocols in CNS/Phenix (Adams et al., 2004). This model refinement further improves model stereochemistry and the fit of the model to the cryoEM density map.
F. Evaluation of CryoEM Structures and Resolution Assessment
Generally speaking, good atomic models of biomacromolecules should make sense in the following four ways. First, the model should adequately fit and explain the experimental cryoEM density map. Second, the model should be consistent with chemical data (e.g., protein sequence), with bond lengths and angles within error ranges, with correct chirality, with flat aromatic rings and flat sp2-hybridized carbon atoms. Third, distances between noncovalently bonded atoms should reflect van der Waals, hydrophobic, and ionic bonds, and covalently bonded atoms should display similar thermal disorder. Fourth, the model should have a reasonable Ramachandran plot, unusual side-chain conformations and buried charges should be justified, and deviations from predictions should be investigated.
Once a cryoEM map reaches near-atomic resolution and becomes rich in high-resolution structural features, the effective resolution of the cryoEM density map can be estimated by examining structural features that are expected to show up at different resolutions (see Figure 1 in Zhou, 2008). The structural feature-based method compares the structural features in a cryoEM map with those seen in perfect structures Gaussian-filtered to different resolution zones or to those seen in X-ray structures determined to similar resolutions. In fact, it can be argued that the structural feature-based method is a more realistic and reliable one.
For low-resolution cryoEM maps where high-resolution structural features such as side-chain densities are not available, the effective resolution can be estimated by measuring the “repeatability” of the 3D reconstruction by computing the Fourier shell correction (FSC) coefficient between two independently determined cryoEM maps as a function of spatial frequency. Rosenthal and Henderson have done a thorough analysis of this method and concluded that a reference-based FSC criterion (Cref =0.5 or FSC=0.143) more closely matches the resolution criterion used in X-ray crystallography (Rosenthal and Henderson, 2003).
Regardless of the methods used for estimating the effective resolution of a cryoEM map, it has been noted that the structures at different locations within a large complex differ in quality and effective resolution. For example, within a virus, densities at the smaller particle radius have better resolution than those located at the outer radius. This radial difference of resolution may be due to the different influence of alignment error at different radii and the different effects of Ewald sphere at different radii (i.e., densities farther away from the middle of the sample are more severely affected than densities close to the center of the particle).
Based on the FSC criterion, the recently determined cryoEM structure of the human adenovirus was estimated to have a resolution of 3.6 Å (Liu et al., 2010; Fig. 8A and B). This assessment is consistent with that estimated from the structural feature-based approach (e.g., side-chain densities shown in Fig. 9B). In this particular case, the structure was also solved by X-ray crystallography at 3.5 Å resolution independently and was simultaneously published in the same issue of Science (Reddy et al., 2010). A direct comparison of the two structures thus offers an unbiased evaluation of the cryoEM resolution criterion which has baffled many structural biologists for years (Fig. 9). Atomic models for three minor proteins were obtained from the 3.6-Å cryoEM map, proteins IIIa, VIII, and IX (Liu et al., 2010). Despite the similarities in the visible side-chain densities (c.f., Fig. 9B and C), the overall resolving power of the 3.5-Å resolution X-ray structure is less than that of the cryoEM map, as only a portion of one minor, protein VIII (Fig. 9C), is resolved in the X-ray structure (Reddy et al., 2010). Similarly, in the 3.6-Å cryoEM map of the sixfold noncrystallography-symmetry-averaged L1 subunits of the bovine pappilomavirus, the definition of structural features corresponds to an experimental X-ray crystallographic density map at about 3.5 Å resolution (Wolf et al., 2010). These independent verifications of the structural feature-based resolution assessment reinforce the notion that, once the resolution of cryoEM reconstructions reaches the realm of near-atomic resolution, it is sufficient and reliable to assess the resolution of a cryoEM map by comparing structural features (e.g., resolvability and shapes of side-chain densities) resolved in the map with those expected at different resolutions based on simulation.
Fig. 9.

Structural feature-based resolution assessment: comparison of 3.6 Å cryoEM mass density map and 3.5 Å X-ray electron density map of the human adenovi-rus. (A, B) CryoEM structure of the human adenovirus at 3.6 Å resolution. (A) Shaded surface representation of the inner surface of one of the 20 triangular facets making up the human adenovirus. The hexon (H1, H2, H3), penton base, and minor proteins IIIa, VI, and VIII are shown in different colors (color codes indicated in the inset). (B) Ribbon model of protein VIII with all three domains (head, neck, body) shown. Upper inset: head domain density (mess) and its atomic model (ribbon), showing cleavage sites G110 and R159 between the N-terminal portion (blue) and the C-terminal portion (red). Lower inset: the helix in the body domain showing the cryoEM density (mess) superimposed with its atomic model (sticks) with some large side chains labeled. (C) Electron density map of the ordered part of protein VIII in the 3.5-Å resolution X-ray structure of human adenovirus (Reddy et al., 2010). The density map is displayed as red mesh and the atomic model is shown by sticks with some large side chains indicated. Panels (A) and (B) are reproduced from Liu et al. (2010) and panel (C) from Reddy et al., 2010), with permissions from authors and publishers.
VI. Conclusions and Future Perspective
The recent demonstration of reaching atomic resolution by single-particle cryoEM represents a significant technological advance in the structural determination of supramolecular machines. CryoEM method is generally applicable to supramolecular assemblies of biological significance, particularly those that are either too flexible to crystallize for X-ray diffraction or too large for NMR to resolve. Single-particle cryoEM is capable of determining, at atomic resolution, the structure of a large complex in its native environment, thus permitting structural studies of metastable or even transient functional intermediate states (e.g., Janssen et al., 2006; Zhang et al., 2010b). This emerging technology should open the door to structural studies of complexes, such as virus-antibody (Roux and Taylor, 2007; Liu et al., 2008), virus-receptor (Olson et al., 1993; Kolatkar et al., 1999; Chiu et al., 2001; Pokidysheva et al., 2006), and other virus-drug complexes that are difficult to crystallize and should have broad applications in biomedical research in general.
With the demonstration of 3.3 Å structure of a large spherical virus by single-particle cryoEM (Zhang et al., 2010b), we are entering an exciting era of atomic modeling by cryoEM without having to rely on the availability of atomic models from X-ray crystallography or NMR. The power of cryoEM lies in its capability to determine 3D structures of metastable and even transiently stable complexes. Future challenges include the application of this exciting technology in determining atomic structures of small complexes and heterogeneous structural population. For small complexes, particularly those with a total molecular mass less than 200 kDa, Zernike phase plate is likely going to play a key role in enhancing the contrast for particle orientation determination as recently shown for sub-nanometer resolution single-particle reconstruction (Danev and Nagayama, 2001; Nagayama and Danev, 2008; Danev et al., 2009; Murata et al., 2010). For heterogeneous structure populations, more powerful image classification methods are becoming available to sort structures into multiple conformational states (Grob et al., 2006; Zhang et al., 2008a; Fischer et al., 2010; Mulder et al., 2010).
Acknowledgments
I would like to thank the following colleagues for making some figures used in this chapter: Xing Zhang for Figs. 1, 5, and 6; Hongrong Liu for Figs. 4D, 7, and 9A and B; and Lei Jin for Fig. 8. Research in my laboratory was supported by grants from the National Institutes of Health (GM071940 and AI069015 to Z. H. Z.). I acknowledge the use of the cryoEM facility at the UCLA Electron Imaging Center for NanoMachines supported in part by NIH (1S10RR23057).
References
- Adams PD, Gopal K, Grosse-Kunstleve RW, Hung LW, Ioerger TR, McCoy AJ, et al. Recent developments in the PHENIX software for automated crystallographic structure determination. J Synchrotron Radiat. 2004;11:53–55. doi: 10.1107/s0909049503024130. [DOI] [PubMed] [Google Scholar]
- Aoki ST, Settembre EC, Trask SD, Greenberg HB, Harrison SC, Dormitzer PR. Structure of rotavirus outer-layer protein VP7 bound with a neutralizing Fab. Science. 2009;324:1444–1447. doi: 10.1126/science.1170481. [DOI] [PMC free article] [PubMed] [Google Scholar]
- Baker ML, Zhang J, Ludtke SJ, Chiu W. Cryo-EM of macromolecular assemblies at near-atomic resolution. Nat Protoc. 2010;5:1697–1708. doi: 10.1038/nprot.2010.126. [DOI] [PMC free article] [PubMed] [Google Scholar]
- Baker TS, Cheng RH. A model-based approach for determining orientations of biological macromolecules imaged by cryoelectron microscopy. J Struct Biol. 1996;116:120–130. doi: 10.1006/jsbi.1996.0020. [DOI] [PubMed] [Google Scholar]
- Baker TS, Newcomb WW, Olson NH, Cowsert LM, Olson C, Brown JC. Structures of bovine and human papillomaviruses. Biophys J. 1991;60:1445–1456. doi: 10.1016/S0006-3495(91)82181-6. [DOI] [PMC free article] [PubMed] [Google Scholar]
- Booth CR, Meyer AS, Cong Y, Topf M, Sali A, Ludtke SJ, et al. Mechanism of lid closure in the eukaryotic chaperonin TRiC/CCT. Nat Struct Mol Biol. 2008;15:746–753. doi: 10.1038/nsmb.1436. [DOI] [PMC free article] [PubMed] [Google Scholar]
- Borgnia MJ, Shi D, Zhang P, Milne JL. Visualization of alpha-helical features in a density map constructed using 9 molecular images of the 1.8 MDa icosahedral core of pyruvate dehydrogenase. J Struct Biol. 2004;147:136–145. doi: 10.1016/j.jsb.2004.02.007. [DOI] [PubMed] [Google Scholar]
- Böttcher B, Wynne SA, Crowther RA. Determination of the fold of the core protein of hepatitis B virus by electron cryomicroscopy. Nature. 1997;386:88–91. doi: 10.1038/386088a0. [DOI] [PubMed] [Google Scholar]
- Braig K, Otwinowski Z, Hegde R, Boisvert DC, Joachimiak A, Horwich AL, et al. The crystal structure of the bacterial chaperonin GroEL at 2.8 A. Nature. 1994;371:578–586. doi: 10.1038/371578a0. [DOI] [PubMed] [Google Scholar]
- Brunger AT, Adams PD, Clore GM, DeLano WL, Gros P, Grosse-Kunstleve RW, et al. Crystallography & NMR system: A new software suite for macromolecular structure determination. Acta Crystallogr D Biol Crystallogr. 1998;54:905–921. doi: 10.1107/s0907444998003254. [DOI] [PubMed] [Google Scholar]
- Carragher B, Kisseberth N, Kriegman D, Milligan RA, Potter CS, Pulokas J, et al. Leginon: an automated system for acquisition of images from vitreous ice specimens. J Struct Biol. 2000;132:33–45. doi: 10.1006/jsbi.2000.4314. [DOI] [PubMed] [Google Scholar]
- Chandramouli P, Topf M, Menetret JF, Eswar N, Cannone JJ, Gutell RR, et al. Structure of the mammalian 80S ribosome at 8.7 A resolution. Structure. 2008;16:535–548. doi: 10.1016/j.str.2008.01.007. [DOI] [PMC free article] [PubMed] [Google Scholar]
- Chen JZ, Settembre EC, Aoki ST, Zhang X, Bellamy AR, Dormitzer PR, et al. Molecular interactions in rotavirus assembly and uncoating seen by high-resolution cryo-EM. Proc Natl Acad Sci USA. 2009;106:10644–10648. doi: 10.1073/pnas.0904024106. [DOI] [PMC free article] [PubMed] [Google Scholar]
- Chen XS, Garcea RL, Goldberg I, Casini G, Harrison SC. Structure of small virus-like particles assembled from the L1 protein of human papillomavirus 16. Mol Cell. 2000;5:557–567. doi: 10.1016/s1097-2765(00)80449-9. [DOI] [PubMed] [Google Scholar]
- Cheng L, Zhu J, Hui WH, Zhang X, Honig B, Fang Q, et al. Backbone model of an aquareovirus virion by cryo-electron microscopy and bioinformatics. J Mol Biol. 2010;397:852–863. doi: 10.1016/j.jmb.2009.12.027. [DOI] [PMC free article] [PubMed] [Google Scholar]
- Chiu CY, Wu E, Brown SL, Von Seggern DJ, Nemerow GR, Stewart PL. Structural analysis of a fiber-pseudotyped adenovirus with ocular tropism suggests differential modes of cell receptor interactions. J Virol. 2001;75:5375–5380. doi: 10.1128/JVI.75.11.5375-5380.2001. [DOI] [PMC free article] [PubMed] [Google Scholar]
- Cong Y, Baker ML, Jakana J, Woolford D, Miller EJ, Reissmann S, et al. 4.0-A resolution cryo-EM structure of the mammalian chaperonin TRiC/CCT reveals its unique subunit arrangement. Proc Natl Acad Sci USA. 2010;107:4967–4972. doi: 10.1073/pnas.0913774107. [DOI] [PMC free article] [PubMed] [Google Scholar]
- Conway JF, Cheng N, Zlotnick A, Wingfield PT, Stahl SJ, Steven AC. Visualization of a 4-helix bundle in the hepatitis B virus capsid by cryo-electron microscopy. Nature. 1997;386:91–94. doi: 10.1038/386091a0. [DOI] [PubMed] [Google Scholar]
- Crowther RA. Procedures for three-dimensional reconstruction of spherical viruses by Fourier synthesis from electron micrographs. Philos Trans R Soc Lond B Biol Sci. 1971;261:221–230. doi: 10.1098/rstb.1971.0054. [DOI] [PubMed] [Google Scholar]
- Crowther RA, DeRosier DJ, Klug A. The reconstruction of a three-dimensional structure from projections and its application to electron microscopy. Proc R Soc Lond. 1970;317:319–340. doi: 10.1098/rspb.1972.0068. [DOI] [PubMed] [Google Scholar]
- Danev R, Glaeser RM, Nagayama K. Practical factors affecting the performance of a thin-film phase plate for transmission electron microscopy. Ultramicro-scopy. 2009;109:312–325. doi: 10.1016/j.ultramic.2008.12.006. [DOI] [PMC free article] [PubMed] [Google Scholar]
- Danev R, Nagayama K. Transmission electron microscopy with Zernike phase plate. Ultramicroscopy. 2001;88:243–252. doi: 10.1016/s0304-3991(01)00088-2. [DOI] [PubMed] [Google Scholar]
- DeRosier DJ. Correction of high-resolution data for curvature of the Ewald sphere. Ultramicroscopy. 2000;81:83–98. doi: 10.1016/s0304-3991(99)00120-5. [DOI] [PubMed] [Google Scholar]
- DeRosier DJ, Klug A. Reconstruction of three-dimensional structures from electron micrographs. Nature. 1968;217:130–134. doi: 10.1038/217130a0. [DOI] [PubMed] [Google Scholar]
- Dormitzer PR, Nason EB, Prasad BV, Harrison SC. Structural rearrangements in the membrane penetration protein of a non-enveloped virus. Nature. 2004;430:1053–1058. doi: 10.1038/nature02836. [DOI] [PMC free article] [PubMed] [Google Scholar]
- Egelman EH. The iterative helical real space reconstruction method: surmounting the problems posed by real polymers. J Struct Biol. 2007;157:83–94. doi: 10.1016/j.jsb.2006.05.015. [DOI] [PubMed] [Google Scholar]
- Emsley P, Cowtan K. Coot: model-building tools for molecular graphics. Acta Crystallogr D Biol Crystallogr. 2004;60:2126–2132. doi: 10.1107/S0907444904019158. [DOI] [PubMed] [Google Scholar]
- Fischer N, Konevega AL, Wintermeyer W, Rodnina MV, Stark H. Ribosome dynamics and tRNA movement by time-resolved electron cryomicro-scopy. Nature. 2010;466:329–333. doi: 10.1038/nature09206. [DOI] [PubMed] [Google Scholar]
- Frank J, Shimkin B, Dowse H. SPIDER—a modular software system for electron image processing. Ultramicroscopy. 1981;6:343–358. [Google Scholar]
- Fuller SD, Butcher SJ, Cheng RH, Baker TS. Three-dimensional reconstruction of icosahedral particles—the uncommon line. J Struct Biol. 1996;116:48–55. doi: 10.1006/jsbi.1996.0009. [DOI] [PubMed] [Google Scholar]
- Gabashvili IS, Agrawal RK, Spahn CM, Grassucci RA, Svergun DI, Frank J, et al. Solution structure of the E. coli 70S ribosome at 11.5 Å. Cell. 2000;100:537–549. doi: 10.1016/s0092-8674(00)80690-x. [DOI] [PubMed] [Google Scholar]
- Ge P, Tsao J, Schein S, Green TJ, Luo M, Zhou ZH. Cryo-EM model of the bullet-shaped vesicular stomatitis virus. Science. 2010;327:689–693. doi: 10.1126/science.1181766. [DOI] [PMC free article] [PubMed] [Google Scholar]
- Golas MM, Sander B, Will CL, Luhrmann R, Stark H. Molecular architecture of the multiprotein splicing factor SF3b. Science. 2003;300:980–984. doi: 10.1126/science.1084155. [DOI] [PubMed] [Google Scholar]
- Grigorieff N. FREALIGN: high-resolution refinement of single particle structures. J Struct Biol. 2007;157:117–125. doi: 10.1016/j.jsb.2006.05.004. [DOI] [PubMed] [Google Scholar]
- Grob P, Cruse MJ, Inouye C, Peris M, Penczek PA, Tjian R, et al. Cryo electron microscopy studies of human TFIID: conformational breathing in the integration of gene regulatory cues. Structure. 2006;14:511–520. doi: 10.1016/j.str.2005.11.020. [DOI] [PubMed] [Google Scholar]
- He J, Schmid MF, Zhou ZH, Rixon F, Chiu W. Finding and using local symmetry in identifying lower domain movements in hexon subunits of the herpes simplex virus type 1 b capsid. J Mol Biol. 2001;309:903–914. doi: 10.1006/jmbi.2001.4711. [DOI] [PubMed] [Google Scholar]
- Henderson R. The potential and limitations of neutrons, electrons and X-rays for atomic resolution microscopy of unstained biological molecules. Q Rev Bio-phys. 1995;28:171–193. doi: 10.1017/s003358350000305x. [DOI] [PubMed] [Google Scholar]
- Hooft RW, Vriend G, Sander C, Abola EE. Errors in protein structures. Nature. 1996;381:272. doi: 10.1038/381272a0. [DOI] [PubMed] [Google Scholar]
- Janssen ME, Kim E, Liu H, Fujimoto LM, Bobkov A, Volkmann N, et al. Three-dimensional structure of vinculin bound to actin filaments. Mol Cell. 2006;21:271–281. doi: 10.1016/j.molcel.2005.11.020. [DOI] [PubMed] [Google Scholar]
- Jiang W, Baker ML, Jakana J, Weigele PR, King J, Chiu W. Backbone structure of the infectious epsilon15 virus capsid revealed by electron cryomicro-scopy. Nature. 2008;451:1130–1134. doi: 10.1038/nature06665. [DOI] [PubMed] [Google Scholar]
- Jones TA, Zou JY, Cowan SW, Kjeldgaard M. Improved methods for building protein models in electron density maps and the location of errors in these models. Acta Crystallogr A. 1991;47(Pt 2):110–119. doi: 10.1107/s0108767390010224. [DOI] [PubMed] [Google Scholar]
- Ju T, Baker ML, Chiu W. Computing a family of skeletons of volumetric models for shape description. Comput Aided Des. 2007;39:352–360. doi: 10.1016/j.cad.2007.02.006. [DOI] [PMC free article] [PubMed] [Google Scholar]
- Kolatkar PR, Bella J, Olson NH, Bator CM, Baker TS, Rossmann MG. Structural studies of two rhinovirus serotypes complexed with fragments of their cellular receptor. EMBO J. 1999;18:6249–6259. doi: 10.1093/emboj/18.22.6249. [DOI] [PMC free article] [PubMed] [Google Scholar]
- Kong Y, Ming D, Wu Y, Stoops JK, Zhou ZH, Ma J. Conformational flexibility of pyruvate dehydrogenase complexes: a computational analysis by quantized elastic deformational model. J Mol Biol. 2003;330:129–135. doi: 10.1016/s0022-2836(03)00555-2. [DOI] [PubMed] [Google Scholar]
- Lander GC, Stagg SM, Voss NR, Cheng A, Fellmann D, Pulokas J, et al. Appion: an integrated, database-driven pipeline to facilitate EM image processing. J Struct Biol. 2009;166:95–102. doi: 10.1016/j.jsb.2009.01.002. [DOI] [PMC free article] [PubMed] [Google Scholar]
- Laskowski RA, MacArthur MW, Moss DS, Thornton JM. PROCHECK: a program to check the stereochemical quality of protein structures. J Appl Cryst. 1993;26:283–291. [Google Scholar]
- Leong PA, Yu X, Zhou ZH, Jensen GJ. Correcting for the ewald sphere in high-resolution single-particle reconstructions. Methods Enzymol. 2010;482:369–380. doi: 10.1016/S0076-6879(10)82015-4. [DOI] [PMC free article] [PubMed] [Google Scholar]
- Li X, Grigorieff N, Cheng Y. GPU-enabled FREALIGN: accelerating single particle 3D reconstruction and refinement in Fourier space on graphics processors. J Struct Biol. 2010;172:407–412. doi: 10.1016/j.jsb.2010.06.010. [DOI] [PMC free article] [PubMed] [Google Scholar]
- Li Y, Zhang Y. REMO: a new protocol to refine full atomic protein models from C-alpha traces by optimizing hydrogen-bonding networks. Proteins. 2009;76:665–676. doi: 10.1002/prot.22380. [DOI] [PMC free article] [PubMed] [Google Scholar]
- Li Z, Baker ML, Jiang W, Estes MK, Prasad BV. Rotavirus architecture at subnanometer resolution. J Virol. 2009;83:1754–1766. doi: 10.1128/JVI.01855-08. [DOI] [PMC free article] [PubMed] [Google Scholar]
- Liang Y, Ke EY, Zhou ZH. IMIRS: a high-resolution 3D reconstruction package integrated with a relational image database. J Struct Biol. 2002;137:292–304. doi: 10.1016/s1047-8477(02)00014-x. [DOI] [PubMed] [Google Scholar]
- Liddington RC, Yan Y, Moulai J, Sahli R, Benjamin TL, Harrison SC. Structure of simian virus 40 at 3.8-A resolution. Nature. 1991;354:278–284. doi: 10.1038/354278a0. [DOI] [PubMed] [Google Scholar]
- Liemann S, Chandran K, Baker TS, Nibert ML, Harrison SC. Structure of the reovirus membrane-penetration protein, Mu1, in a complex with is protector protein, Sigma3. Cell. 2002;108:283–295. doi: 10.1016/s0092-8674(02)00612-8. [DOI] [PMC free article] [PubMed] [Google Scholar]
- Liu H, Jin L, Koh SB, Atanasov I, Schein S, Wu L, et al. Atomic structure of human adenovirus by cryo-EM reveals interactions among protein networks. Science. 2010;329:1038–1043. doi: 10.1126/science.1187433. [DOI] [PMC free article] [PubMed] [Google Scholar]
- Liu J, Bartesaghi A, Borgnia MJ, Sapiro G, Subramaniam S. Molecular architecture of native HIV-1 gp120 trimers. Nature. 2008;455:109–113. doi: 10.1038/nature07159. [DOI] [PMC free article] [PubMed] [Google Scholar]
- Ludtke SJ, Baker ML, Chen DH, Song JL, Chuang DT, Chiu W. De novo backbone trace of GroEL from single particle electron cryomicroscopy. Structure. 2008;16:441–448. doi: 10.1016/j.str.2008.02.007. [DOI] [PubMed] [Google Scholar]
- Ludtke SJ, Baldwin PR, Chiu W. EMAN: semi-automated software for high resolution single particle reconstructions. J Struct Biol. 1999;128:82–97. doi: 10.1006/jsbi.1999.4174. [DOI] [PubMed] [Google Scholar]
- Mancini EJ, Clarke M, Gowen BE, Rutten T, Fuller SD. Cryo electron microscopy reveals the functional organization of an enveloped virus, Semliki Forest virus. Mol Cell. 2000;5:255–266. doi: 10.1016/s1097-2765(00)80421-9. [DOI] [PubMed] [Google Scholar]
- Matadeen R, Patwardhan A, Gowen B, Orlova EV, Pape T, Cuff M, et al. The Escherichia coli large ribosomal subunit at 7.5 A resolution. Struct Fold Des. 1999;7:1575–1583. doi: 10.1016/s0969-2126(00)88348-3. [DOI] [PubMed] [Google Scholar]
- Mathieu M, Petitpas I, Navaza J, Lepault J, Kohli E, Pothier P, et al. Atomic structure of the major capsid protein of rotavirus: implications for the architecture of the virion. EMBO J. 2001;20:1485–1497. doi: 10.1093/emboj/20.7.1485. [DOI] [PMC free article] [PubMed] [Google Scholar]
- McClain B, Settembre E, Temple BR, Bellamy AR, Harrison SC. X-ray crystal structure of the rotavirus inner capsid particle at 3.8 A resolution. J Mol Biol. 2010;397:587–599. doi: 10.1016/j.jmb.2010.01.055. [DOI] [PMC free article] [PubMed] [Google Scholar]
- Mertens P. The dsRNA viruses. Virus Res. 2004;101:3–13. doi: 10.1016/j.virusres.2003.12.002. [DOI] [PubMed] [Google Scholar]
- Mindell JA, Grigorieff N. Accurate determination of local defocus and specimen tilt in electron microscopy. J Struct Biol. 2003;142:334–347. doi: 10.1016/s1047-8477(03)00069-8. [DOI] [PubMed] [Google Scholar]
- Modis Y, Trus BL, Harrison SC. Atomic model of the papillomavirus capsid. EMBO J. 2002;21:4754–4762. doi: 10.1093/emboj/cdf494. [DOI] [PMC free article] [PubMed] [Google Scholar]
- Mulder AM, Yoshioka C, Beck AH, Bunner AE, Milligan RA, Potter CS, et al. Visualizing ribosome biogenesis: parallel assembly pathways for the 30S subunit. Science. 2010;330:673–677. doi: 10.1126/science.1193220. [DOI] [PMC free article] [PubMed] [Google Scholar]
- Murata K, Liu X, Danev R, Jakana J, Schmid MF, King J, et al. Zernike phase contrast cryo-electron microscopy and tomography for structure determination at nanometer and subnanometer resolutions. Structure. 2010;18:903–912. doi: 10.1016/j.str.2010.06.006. [DOI] [PMC free article] [PubMed] [Google Scholar]
- Nagayama K, Danev R. Phase contrast electron microscopy: development of thin-film phase plates and biological applications. Philos Trans R Soc Lond B Biol Sci. 2008;363:2153–2162. doi: 10.1098/rstb.2008.2268. [DOI] [PMC free article] [PubMed] [Google Scholar]
- Olson NH, Kolatkar PR, Oliveira MA, Cheng RH, Greve JM, McClelland A, et al. Structure of a human rhinovirus complexed with its receptor molecule. Proc Natl Acad Sci USA. 1993;90:507–511. doi: 10.1073/pnas.90.2.507. [DOI] [PMC free article] [PubMed] [Google Scholar]
- Pettersen EF, Goddard TD, Huang CC, Couch GS, Greenblatt DM, Meng EC, et al. UCSF Chimera—a visualization system for exploratory research and analysis. J Comput Chem. 2004;25:1605–1612. doi: 10.1002/jcc.20084. [DOI] [PubMed] [Google Scholar]
- Pokidysheva E, Zhang Y, Battisti AJ, Bator-Kelly CM, Chipman PR, Xiao C, et al. Cryo-EM reconstruction of dengue virus in complex with the carbohydrate recognition domain of DC-SIGN. Cell. 2006;124:485–493. doi: 10.1016/j.cell.2005.11.042. [DOI] [PubMed] [Google Scholar]
- Potter CS, Chu H, Frey B, Green C, Kisseberth N, Madden TJ, et al. Leginon: a system for fully automated acquisition of 1000 electron micrographs a day. Ultramicroscopy. 2001;77:153–161. doi: 10.1016/s0304-3991(99)00043-1. [DOI] [PubMed] [Google Scholar]
- Prasad BV, Crawford S, Lawton JA, Pesavento J, Hardy M, Estes MK. Structural studies on gastroenteritis viruses. Novartis Found Symp. 2001;238:26–37. doi: 10.1002/0470846534.ch3. discussion 37–46. [DOI] [PubMed] [Google Scholar]
- Prasad BVV, Burns JW, Marietta E, Estes MK, Chiu W. Localization of VP4 neutralization sites in rotavirus by three-dimensional cryo-electron microscopy. Nature (London) 1990;343:476–479. doi: 10.1038/343476a0. [DOI] [PubMed] [Google Scholar]
- Rayment I, Baker TS, Caspar DLD, Murakami WT. Polyoma virus capsid structure at 22.5 Å resolution. Nature. 1982;295:110–115. doi: 10.1038/295110a0. [DOI] [PMC free article] [PubMed] [Google Scholar]
- Reddy VS, Natchiar SK, Stewart PL, Nemerow GR. Crystal structure of human adenovirus at 3.5 A resolution. Science. 2010;329:1071–1075. doi: 10.1126/science.1187292. [DOI] [PMC free article] [PubMed] [Google Scholar]
- Reinisch KM. The dsRNA Viridae and their catalytic capsids. Nat Struct Biol. 2002;9:714–716. doi: 10.1038/nsb1002-714. [DOI] [PubMed] [Google Scholar]
- Reinisch KM, Nibert ML, Harrison SC. Structure of the reovirus core at 3.6 Å resolution. Nature. 2000;404:960–967. doi: 10.1038/35010041. [DOI] [PubMed] [Google Scholar]
- Roberts MM, White JL, Grutter MG, Burnett RM. Three-dimensional structure of the adenovirus major coat protein hexon. Science. 1986;232:1148–1151. doi: 10.1126/science.3704642. [DOI] [PubMed] [Google Scholar]
- Rosenthal PB, Henderson R. Optimal determination of particle orientation, absolute hand, and contrast loss in single-particle electron cryomicroscopy. J Mol Biol. 2003;333:721–745. doi: 10.1016/j.jmb.2003.07.013. [DOI] [PubMed] [Google Scholar]
- Roux KH, Taylor KA. AIDS virus envelope spike structure. Curr Opin Struct Biol. 2007;17:244–252. doi: 10.1016/j.sbi.2007.03.008. [DOI] [PubMed] [Google Scholar]
- Rux JJ, Kuser PR, Burnett RM. Structural and phylogenetic analysis of adenovirus hexons by use of high-resolution X-ray crystallographic, molecular modeling, and sequence-based methods. J Virol. 2003;77:9553–9566. doi: 10.1128/JVI.77.17.9553-9566.2003. [DOI] [PMC free article] [PubMed] [Google Scholar]
- Saad A, Ludtke SJ, Jakana J, Rixon FJ, Tsuruta H, Chiu W. Fourier amplitude decay of electron cryomicroscopic images of single particles and effects on structure determination. J Struct Biol. 2001;133:32–42. doi: 10.1006/jsbi.2001.4330. [DOI] [PubMed] [Google Scholar]
- Saban SD, Nepomuceno RR, Gritton LD, Nemerow GR, Stewart PL. CryoEM structure at 9A resolution of an adenovirus vector targeted to hemato-poietic cells. J Mol Biol. 2005;349:526–537. doi: 10.1016/j.jmb.2005.04.034. [DOI] [PubMed] [Google Scholar]
- Saban SD, Silvestry M, Nemerow GR, Stewart PL. Visualization of {alpha}-helices in a 6 Angstrom resolution cryoEM structure of adenovirus allows refinement of capsid protein assignments. J Virol. 2006;80:12049–12059. doi: 10.1128/JVI.01652-06. [DOI] [PMC free article] [PubMed] [Google Scholar]
- Stehle T, Yan Y, Benjamin TL, Harrison SC. Structure of murine polyoma-virus complexed with an oligosaccharide receptor fragment. Nature. 1994;369:160–163. doi: 10.1038/369160a0. [DOI] [PubMed] [Google Scholar]
- Suloway C, Pulokas J, Fellmann D, Cheng A, Guerra F, Quispe J, et al. Automated molecular microscopy: the new Leginon system. J Struct Biol. 2005;151:41–60. doi: 10.1016/j.jsb.2005.03.010. [DOI] [PubMed] [Google Scholar]
- Valle M, Zavialov A, Li W, Stagg SM, Sengupta J, Nielsen RC, et al. Incorporation of aminoacyl-tRNA into the ribosome as seen by cryo-electron microscopy. Nat Struct Biol. 2003;10:899–906. doi: 10.1038/nsb1003. [DOI] [PubMed] [Google Scholar]
- Wan Y, Chiu W, Zhou ZH. IEEE Proceedings of ICCCAS. 2004. Chengdu; Sichuan, China: 2004. Full contrast transfer function correction in 3D cryo-EM reconstruction; pp. 960–964. [Google Scholar]
- Wolf M, DeRosier DJ, Grigorieff N. Ewald sphere correction for single-particle electron microscopy. Ultramicroscopy. 2006;106:376–382. doi: 10.1016/j.ultramic.2005.11.001. [DOI] [PubMed] [Google Scholar]
- Wolf M, Garcea RL, Grigorieff N, Harrison SC. Subunit interactions in bovine papillomavirus. Proc Natl Acad Sci USA. 2010;107:6298–6303. doi: 10.1073/pnas.0914604107. [DOI] [PMC free article] [PubMed] [Google Scholar]
- Xu Z, Horwich AL, Sigler PB. The crystal structure of the asymmetric GroEL-GroES-(ADP)7 chaperonin complex. Nature. 1997;388:741–750. doi: 10.1038/41944. [DOI] [PubMed] [Google Scholar]
- Yu X, Jin L, Zhou ZH. 3.88 Å structure of cytoplasmic polyhedrosis virus by cryo-electron microscopy. Nature. 2008;453:415–419. doi: 10.1038/nature06893. [DOI] [PMC free article] [PubMed] [Google Scholar]
- Zhang J, Baker ML, Schroder GF, Douglas NR, Reissmann S, Jakana J, et al. Mechanism of folding chamber closure in a group II chaperonin. Nature. 2010a;463:379–383. doi: 10.1038/nature08701. [DOI] [PMC free article] [PubMed] [Google Scholar]
- Zhang X, Jin L, Fang Q, Hui WH, Zhou ZH. 3.3 A cryo-EM structure of a nonenveloped virus reveals a priming mechanism for cell entry. Cell. 2010b;141:472–482. doi: 10.1016/j.cell.2010.03.041. [DOI] [PMC free article] [PubMed] [Google Scholar]
- Zhang X, Zhang X, Zhou ZH. Low cost, high performance GPU computing solution for atomic resolution cryoEM single-particle reconstruction. J Struct Biol. 2010c;172:400–406. doi: 10.1016/j.jsb.2010.05.006. [DOI] [PMC free article] [PubMed] [Google Scholar]
- Zhang W, Kimmel M, Spahn CM, Penczek PA. Heterogeneity of large macromolecular complexes revealed by 3D cryo-EM variance analysis. Structure. 2008a;16:1770–1776. doi: 10.1016/j.str.2008.10.011. [DOI] [PMC free article] [PubMed] [Google Scholar]
- Zhang X, Settembre E, Xu C, Dormitzer PR, Bellamy R, Harrison SC, et al. Near-atomic resolution using electron cryomicroscopy and single-particle reconstruction. Proc Natl Acad Sci USA. 2008b;105:1867–1872. doi: 10.1073/pnas.0711623105. [DOI] [PMC free article] [PubMed] [Google Scholar]
- Zhang X, Walker SB, Chipman PR, Nibert ML, Baker TS. Reovirus polymerase lambda 3 localized by cryo-electron microscopy of virions at a resolution of 7.6 A. Nat Struct Biol. 2003;10:1011–1018. doi: 10.1038/nsb1009. [DOI] [PMC free article] [PubMed] [Google Scholar]
- Zhou ZH. Towards atomic resolution structural determination by single-particle cryo-electron microscopy. Curr Opin Struct Biol. 2008;18:218–228. doi: 10.1016/j.sbi.2008.03.004. [DOI] [PMC free article] [PubMed] [Google Scholar]
- Zhou ZH, Baker ML, Jiang W, Dougherty M, Jakana J, Dong G, et al. Electron cryomicroscopy and bioinformatics suggest protein fold models for rice dwarf virus. Nat Struct Biol. 2001a;8:868–873. doi: 10.1038/nsb1001-868. [DOI] [PubMed] [Google Scholar]
- Zhou ZH, Liao W, Cheng RH, Lawson JE, McCarthy DB, Reed LJ, et al. Direct evidence for the size and conformational variability of the pyruvate dehydrogenase complex revealed by three-dimensional electron microscopy. J Biol Chem. 2001b;276:21704–21713. doi: 10.1074/jbc.M101765200. [DOI] [PubMed] [Google Scholar]
- Zhou ZH, Chiu W. Determination of icosahedral virus structures by electron cryomicroscopy at subnanometer resolution. Adv Protein Chem. 2003;64:93–124. doi: 10.1016/s0065-3233(03)01003-9. [DOI] [PubMed] [Google Scholar]
- Zhou ZH, Chiu W, Haskell K, Spears H, Jr, Jakana J, Rixon FJ, et al. Refinement of herpesvirus B-capsid structure on parallel supercomputers. Biophys J. 1998;74:576–588. doi: 10.1016/S0006-3495(98)77816-6. [DOI] [PMC free article] [PubMed] [Google Scholar]
- Zhou ZH, Dougherty M, Jakana J, He J, Rixon FJ, Chiu W. Seeing the herpesvirus capsid at 8.5 Å. Science. 2000;288:877–880. doi: 10.1126/science.288.5467.877. [DOI] [PubMed] [Google Scholar]
- Zhou ZH, Hardt S, Wang B, Sherman MB, Jakana J, Chiu W. CTF determination of images of ice-embedded single particles using a graphics interface. J Struct Biol. 1996;116:216–222. doi: 10.1006/jsbi.1996.0033. [DOI] [PubMed] [Google Scholar]
- Zhou ZH, He J, Jakana J, Tatman JD, Rixon FJ, Chiu W. Assembly of VP26 in herpes simplex virus-1 inferred from structures of wild-type and recombinant capsids. Nat Struct Biol. 1995;2:1026–1030. doi: 10.1038/nsb1195-1026. [DOI] [PubMed] [Google Scholar]
- Zhou ZH, Zhang H, Jakana J, Lu XY, Zhang JQ. Cytoplasmic polyhe-drosis virus structure at 8 Å by electron cryomicroscopy: structural basis of capsid stability and mRNA processing regulation. Structure. 2003;11:651–663. doi: 10.1016/s0969-2126(03)00091-1. [DOI] [PubMed] [Google Scholar]
- Zhu J, Cheng L, Fang Q, Zhou ZH, Honig B. Building and refining protein models within cryo-electron microscopy density maps based on homology modeling and multiscale structure refinement. J Mol Biol. 2010;397:835–851. doi: 10.1016/j.jmb.2010.01.041. [DOI] [PMC free article] [PubMed] [Google Scholar]
- Zubieta C, Schoehn G, Chroboczek J, Cusack S. The structure of the human adenovirus 2 penton. Mol Cell. 2005;17:121–135. doi: 10.1016/j.molcel.2004.11.041. [DOI] [PubMed] [Google Scholar]