Abstract
Background
Apoptosis caused by endoplasmic reticulum (ER) stress contributes to atherothrombosis, the underlying cause of cardiovascular disease (CVD). T‐cell death‐associated gene 51 (TDAG51), a member of the pleckstrin homology‐like domain gene family, is induced by ER stress, causes apoptosis when overexpressed, and is present in lesion‐resident macrophages and endothelial cells.
Methods and Results
To study the role of TDAG51 in atherosclerosis, male mice deficient in TDAG51 and apolipoprotein E (TDAG51−/−/ApoE−/−) were generated and showed reduced atherosclerotic lesion growth (56±5% reduction at 40 weeks, relative to ApoE−/− controls, P<0.005) and necrosis (41±4% versus 63±8% lesion area in TDAG51−/−/ApoE−/− and ApoE−/−, respectively; P<0.05) without changes in plasma levels of lipids, glucose, and inflammatory cytokines. TDAG51 deficiency caused several phenotypic changes in macrophages and endothelial cells that increase cytoprotection against oxidative and ER stress, enhance PPARγ‐dependent reverse cholesterol transport, and upregulate peroxiredoxin‐1 (Prdx‐1), an antioxidant enzyme with antiatherogenic properties (1.8±0.1‐fold increase in Prdx‐1 protein expression, relative to control macrophages; P<0.005). Two independent case–control studies found that a genetic variant in the human TDAG51 gene region (rs2367446) is associated with CVD (OR, 1.15; 95% CI, 1.07 to 1.24; P=0.0003).
Conclusions
These findings provide evidence that TDAG51 affects specific cellular pathways known to reduce atherogenesis, suggesting that modulation of TDAG51 expression or its activity may have therapeutic benefit for the treatment of CVD.
Keywords: apoptosis, arteriosclerosis, atherosclerosis, cardiovascular diseases
Introduction
Cardiovascular disease (CVD) is an acute clinical manifestation of atherothrombosis that accounts for the majority of deaths in North America.1 A number of risk factors are known to accelerate CVD, including hypercholesterolemia, smoking, diabetes, hypertension, hyperhomocysteinemia, and obesity. Despite the diversity of these risk factors, the development and progression of atherosclerotic lesions is remarkably similar. Endothelial cell dysfunction and the accumulation of cholesterol‐rich lipoproteins in the vessel wall are early events in atherogenesis, resulting in the recruitment of circulating monocytes, their adhesion to the endothelium, their subsequent differentiation into macrophages, and the accumulation of lipid to form foam cells.2 In humans, these fatty streaks can progress to more advanced lesions characterized by a lipid‐rich necrotic core and a fibrous cap consisting of smooth muscle cells and collagen.
The acute clinical manifestations of atherosclerosis result from plaque rupture, thrombus formation, and vessel occlusion.3 Apoptotic cell death is a key feature of unstable plaques4 and is induced by a number of cellular stress pathways, including oxidative and endoplasmic reticulum (ER) stress.5–7 The distribution of cell death is heterogeneous within advanced lesions, but is most prominent in the lipid‐rich necrotic core that contains a high density of macrophages. Apoptotic cell death increases the risk of plaque rupture by decreasing the number of viable smooth muscle cells necessary for collagen production and compromising the structural integrity of the fibrous cap following release of matrix metalloproteinases from dead macrophages.8 Furthermore, plaque thrombogenicity is enhanced because lesion‐resident cells undergoing apoptosis express active cell surface tissue factor (TF),9 the major physiological initiator of the coagulation cascade.10 Previous studies have demonstrated that the absence of specific proapoptotic factors such as Bax11 or Rb12 decreases macrophage apoptosis as well as necrotic core size in hyperlipidemic mice. Consistent with these findings, a reduction in apoptosis and plaque necrosis was observed in advanced atherosclerotic lesions from ApoE−/− mice deficient in the ER stress effector CHOP.5
TDAG51 is a member of the pleckstrin homology‐like domain family having proapoptotic characteristics.13 Furthermore, TDAG51 is induced by ER stress,14–16 and its overexpression in human vascular endothelial cells induces apoptotic cell death by disrupting cytoskeletal structure and impairing cell adhesion.15 Conversely, deficiency of TDAG51 contributes to apoptosis resistance and growth dysregulation in metastatic melanomas in vivo.17 TDAG51 can also regulate energy metabolism by modulating adipogenesis and hepatic lipogenesis, which correlates with mature‐onset metabolic disease.18 Several lines of evidence implicate TDAG51 in atherosclerotic lesion development. TDAG51 expression is increased in lesion‐resident macrophages and endothelial cells during all stages of atherogenesis.6,15 Furthermore, TDAG51 mRNA is significantly increased in cultured human vascular endothelial cells following exposure to athero‐prone waveform stimulation.19 Although these findings suggest that TDAG51 contributes to the atherosclerotic process, it is currently unknown if TDAG51 is causally related to atherogenesis or if its mechanism of action stems from its previously described role as a proapoptotic factor.
In this report, we investigated whether loss of TDAG51 alters the development and progression of atherosclerosis by crossing TDAG51−/− mice20 with ApoE−/− mice, an established hyperlipidemic mouse model of accelerated atherosclerosis.21 Our findings provide the first in vivo evidence that deficiency of TDAG51 reduces atherosclerotic lesion growth. Furthermore, such inhibition of atherogenesis because of TDAG51 deficiency likely involves the action of PPARγ on specific cellular targets and pathways that are known to affect atherosclerotic lesion development and progression.
Methods
Mice and Dietary Conditions
ApoE−/− mice were obtained from the Jackson Laboratory (Bar Harbor, ME). TDAG51‐deficient (TDAG51−/−) mice have been previously described.20 TDAG51−/− (knockout [KO]) mice were backcrossed >9 generations onto a C57BL/6 background. TDAG51‐deficient mice were crossbred with TDAG51+/+/ApoE−/− mice (also on a C57BL/6 background) to generate TDAG51−/−/ApoE−/− double‐knockout (dKO) mice as well as ApoE−/− littermate controls. Given previous studies showing that the PPARγ ligand effect on atherosclerosis is sex specific toward male mice,22 only male mice were used in this study. Mice were housed with free access to regular chow diet. All experimental procedures using mice were approved by the McMaster University Animal Research Ethics Board.
Mouse Genotyping Using Polymerase Chain Reaction
Polymerase chain reaction (PCR) was performed to assess the presence of wild‐type (WT) and/or disrupted TDAG51 alleles using the following primers: WT 1, WT 2, TDAG51 KO 1, and TDAG51 KO 2. PCR‐amplified products (1‐kbp band, wild‐type TDAG51; 400‐bp band, disrupted TDAG51) were analyzed by agarose gel electrophoresis (AGE). ApoE genotyping was confirmed using primers ApoE 1, ApoE 2, and ApoE 3. PCR‐amplified products (155‐bp band, wild‐type ApoE; 245‐bp band, disrupted ApoE) were analyzed by AGE.
Primers used in this study were WT 1 (5′‐CCG CAG CAC CTC CAA CTC TGC CTG‐3′), WT 2 (5′‐GTC TTC AAA TAC AAT GAA AGA GTC G‐3′), TDAG51 KO 1 (5′‐AAA TGG AAG TAG CAC GTC TCA CTA GTC TCG‐3′), TDAG51 KO 2 (5′‐AGA GCA GCC GAT TGT CTG TTG TGC CCA GTC‐3′), ApoE 1 (5′‐GCC TAG CCG AGG GAG AGC CG‐3′), ApoE 2 (5′‐TGT GAC TTG GGA GCT CTG CAG C‐3′), and ApoE 3 (5′‐GCC GCC CCG ACT GCA TCT‐3′).
Quantitative RT‐PCR
Gene‐specific primer sets for mouse PPARα, ‐γ, and ‐δ were designed by the Genescript Primer Design Program (http://www.genescript.com). Primer sets for mouse ABCA1 and ABCG1 were purchased from Qiagen (Germantown, MD). Sequences for MCP‐1 and TNFα primers were reported previously.23 qRT‐PCR reactions were carried out using SYBR Green, and data was analyzed by the ∆∆C(T) method, normalized to 18s, and shown as fold‐change in expression.
Primers used in this study were MCP‐1 forward primer (5′‐CTC AGC CAG ATG CAG TTA ACG‐3′), MCP‐1 reverse primer (5′‐GGG TCA ACT TCA CAT TCA AAG G‐3′), TNFα forward primer (5′‐TCT CAG CCT CTT CTC ATT CCT‐3′), TNFα reverse primer (5′‐ACT TGG TGG TTT GCT ACG AC‐3′), LXRα forward primer (5′‐GGA GGC AAC ACT TGC ATC CT‐3′), and LXRα reverse primer (5′‐AGG GCT GTA GGC TCT GCT GA‐3′).
Isolation of Peritoneal Macrophages
Wild‐type C57BL/6 and TDAG51−/− mice were injected intraperitoneally with 500 μL of 80 μg/mL concanavalin A.7 Peritoneal macrophages were harvested 3 days postinjection. Macrophages were cultured in RPMI‐1640 containing 10% FBS and 50 ng/mL macrophage colony stimulating factor.
Isolation and Culture of Mouse Lung Microvascular Endothelial Cells
Mouse lung microvascular endothelial cells (MLECs) were isolated and cultured using a protocol derived from previous studies24 and Miltenyi Biotec (Auburn, CA). Briefly, mouse lung cells were incubated with MACS LSEC (CD146) microbeads (130‐092‐007, Miltenyi Biotec) and subsequently eluted from a MACS Separation LS column (130‐042‐401, Miltenyi Biotec). MLECs were cultured in endothelial cell growth medium (CC‐3121; Lonza, Walkersville, MD).
Measurement of Total Cholesterol, Triglyceride, and Glucose
Plasma total cholesterol was measured using an Infinity cholesterol measurement kit (Thermo Electron Corporation, Melbourne, Australia). Triglyceride and glucose levels in mice plasma were determined similarly to the above described cholesterol assay (Thermo Electron Corporation).
Macrophages were pretreated in the presence or absence of 10 μmol/L GW9662 in FBS‐deficient media for 4 hour before incubation with acetyl‐LDL (50 μg/mL) or acetyl‐LDL+GW9662 (10 μmol/L) for 24 to 48 hours. Cellular lipids were isolated via Bligh and Dyer chloroform:methanol extraction25 with subsequent assessment of total and free cholesterol levels using Cholesterol E and Free Cholesterol E kits (Wako Pure Chemical Industries, Ltd, Osaka, Japan). Lipid content was normalized against cellular protein and the data expressed as fold‐change.
Measurement of Cholesterol Efflux in Peritoneal Macrophages
HDL/APOA1‐dependent cholesterol efflux to the medium was determined as described previously.26 Peritoneal macrophages isolated from TDAG51−/− and wild‐type C57BL/6 mice were plated at a density of 5×10⁵ cells/well and loaded with 1 μCi/mL [3H]cholesterol (PerkinElmer Life Sciences) in RPMI‐1640 media containing 5% LPDS for 48 hours. To equilibrate cholesterol pools, cells were washed twice in media containing 2% fatty acid–free BSA and cultured overnight in the same media. Media were removed, and cells were incubated for 1 to 5 hours in media containing 0.2% BSA in the absence or presence of 40 μg/mL HDL. Following incubation, radioactivity of culture supernatants and cell lysates was measured by liquid scintillation. Results were normalized to total cellular protein content and expressed as the percentage of radioactivity in the medium divided by the total radioactivity in the cells and medium.
Lactate Dehydrogenase Release Assay
Peritoneal macrophages and MLECs were incubated in the presence or absence of 2.5 μg/mL tunicamycin, 100 nmol/L thapsigargin, or 10 μmol/L 7‐ketocholesterol (7‐KC) for 24 hours. Lactate dehydrogenase release was measured using a Cytotoxicity Detection Kit (Roche, Laval, Canada).
Detection of Superoxide
Superoxide levels in cells were measured using fluorescent‐dye dihydroethidium (Invitrogen, Carlsbad, CA) as previously described.16 Fluorescence intensity is reported as relative fluorescence units (RFU).
Measurement of Mouse Plasma Lipid Profiles Using FPLC
Mouse plasma was fractionated into lipid components using gel filtration‐fast protein liquid chromatography (FPLC), as described previously.27
Tissue Sample Preparation
Following perfusion–fixation with 10% neutral buffered formalin,6,28 hearts (including the aortic roots) were cut transversely and embedded in paraffin. Serial sections, 4 μm thick, were cut starting from the aortic root origin and collected for measurement of lesion size (hematoxylin/eosin staining) and immunohistochemical analyses.29 In each mouse, the atherosclerotic lesion area was measured in 5 sections separated by 80 μm (ie, within 320 μm from the aortic valve).29 The lesion was traced manually and measured using computer‐assisted image analysis equipment (Olympus BX41 microscope, Olympus DP70 CCD camera, and ImagePro Plus software). Lesion size is expressed as the mean of 5 sections. Therefore, this number is directly proportional to the volume of the lesions in the first 320 μm of the ascending aorta.
Immunohistochemical Analysis
Immunohistochemical staining of atherosclerotic lesions was performed as described previously.6,29 Sections were counterstained with hematoxylin. Human carotid arteries were obtained at the time of endarterectomy from consenting patients. The protocol was approved by the institutional ethics review boards of Hamilton Health Sciences and St. Joseph's Healthcare. Tissue was fixed with formalin and embedded in paraffin. Double immunofluorescence was performed on the sections as described previously.29
Antibodies used for immunostaining were anti‐GRP78 (sc‐1050; Santa Cruz, CA), anti‐cleaved caspase‐3 (9661; Cell Signaling, Danvers, MA), anti‐Mac‐3 (55322; BD Pharmingen, San Diego, CA), anti‐KDEL (SPA‐827; Enzo Life Sciences, Farmingdale, NY), anti‐PDI (SPA‐891; Enzo Life Sciences), anti‐PPARγ (07‐466; Upstate, Billerica, MA), anti‐Prdx‐1 (SA‐356; Enzo Life Sciences), anti‐SMA (A2547; Sigma, St. Louis, MO), and anti‐CD3 (A0452; DAKO, Glostrup, Denmark). Nonspecific immunostaining was not detected in control sections. Controls consisted of nonimmune IgG as the primary antibody or the secondary antibody alone. A TACS 2TdT In Situ Apoptosis Detection Kit (Trevigen, Gaithersburg, MD) was used for TUNEL staining. Collagen was stained with Masson's trichrome (HT‐15‐1KT; Sigma).
Immunostaining was quantified by extracting the blue component of the RGB image, thresholding for the staining, and measuring the stained area as well as the total area of the lesion (by manual tracing) using ImagePro 6.3 software. Results are expressed as a percentage of the total lesion area.
Identification of Insulin and Glucagon in β Cells From Islets of Langerhans
Pancreatic tissue from 25‐week‐old TDAG51+/+/ApoE−/− or TDAG51−/−/ApoE−/− mice was immunostained for insulin (red) or glucagon (green). In brief, paraffin sections were deparaffinized and blocked with 5% normal goat serum (Vector, Burlingame, CA). Subsequently, sections were incubated with mouse anti‐insulin antibody cocktail (MS‐1379; Thermo Fisher, Fremont, CA) diluted 1:200, followed by rabbit anti‐glucagon ready‐to‐use antibody (Zymed, San Francisco, CA), for 1 hour each. A mix of goat anti‐rabbit Alexa 488 and goat anti‐mouse Alexa 594 (Molecular Probes, Eugene, OR), diluted 1:200, was applied for 30 minutes. Slides were mounted with Permafluor (Thermo Fisher) and viewed in a Zeiss Axioplan fluorescence microscope.
Indirect Immunofluorescence of Endogenous TDAG51 Expression in Lesion‐Resident Macrophages
Six‐week‐old TDAG51+/+/ApoE−/− mice were placed on control chow diet for 25 weeks. Mice were euthanized, and hearts containing the aortic roots were removed, embedded in paraffin, sectioned, and immunostained. Primary antibodies were detected using either Alexa 488 or Alexa 594 donkey anti‐goat IgG (Molecular Probes). A Carl Zeiss LSM510 laser‐scanning confocal microscope was used to examine endogenous TDAG51 localization.
Collagen Content in Atherosclerotic Lesions From Aortic Roots
Six‐week‐old TDAG51+/+/ApoE−/− or TDAG51−/−/ApoE−/− mice were placed on control chow diet for 25 weeks. Hearts containing aortic roots were removed, embedded in paraffin, serially sectioned, and stained with Masson's trichrome. For quantification of collagen content, 1 section per mouse, close to the aortic root origin, was assessed. The amount of collagen was quantified by thresholding for the blue color using Image Pro software, and collagen area is expressed as a percentage of the total lesion area in that section.
En Face Oil Red O Staining of Mouse Aortas
Unopened aortas were stained with Oil Red O. Aortas were then opened longitudinally, and the stained area was measured as percentage of the total aorta.
Case–Control Genetic Association Studies
The association between CVD and single‐nucleotide polymorphisms (SNPs) in a 56‐kbp region (chromosome 12, positions 74 680 495 to 74 736 823) that included the entire TDAG51 gene (chromosome 12, positions 74 705 495 to 74 711 823) and 25 kbp upstream and downstream of the gene was examined in 2 case–control studies. We evaluated results from the CVD case–control study published by the Wellcome Trust Case–Control Consortium (WTCCC).30 The WTCCC study included 2000 cases with documented CVD and 3000 controls; all cases and controls were white. The University of California, San Francisco (UCSF) case–control study included 731 myocardial infarction patients and 797 healthy controls, collected by investigators at the UCSF Genomic Resource in Arteriosclerosis.31 The number of cases and controls who were successfully genotyped is reported for each genotype group in Tables 3 and 4.
Statistical Analysis
Experimental values are presented as mean±standard error (SE). Unless otherwise noted, statistical comparisons for all experiments were performed using Mann–Whitney (for 2 groups) and Kruskal–Wallis (for >2 groups) tests. Statistical comparisons for en face Oil Red O staining of mouse aortas and Oil Red O staining of peritoneal macrophages were performed using the unpaired Student t test and ANOVA. P<0.05 was considered statistically significant for all tests.
The association between SNPs and myocardial infarction was performed by logistic regression analysis that adjusted for age and sex. A combined analysis of the results from the UCSF study and the WTCCC study was carried out using the fixed‐effects Mantel–Haenszel method that combined odds ratios across these studies; homogeneity of the odds ratios was assessed by the Breslow–Day test.
Results
Loss of TDAG51 Reduces Atherosclerotic Lesion Development and Progression
To investigate the role of TDAG51 in atherosclerotic lesion development, we generated TDAG51−/−/ApoE−/− double‐knockout male mice (dKO), as well as TDAG51+/+/ApoE−/− littermate/sex controls (Figure 1). To focus on the effect of TDAG51 deficiency, male mice were maintained on a control chow diet, as opposed to a high‐fat chow diet, to minimize the potential contribution of obesity and insulin resistance32 to atherosclerotic lesion development and necrosis.
Figure 1.

Identification of TDAG51−/−/ApoE−/− mice. Mouse genomic DNA was amplified by PCR using specific primer sets, and the PCR products were separated on agarose gels to identify mice containing the wild‐type TDAG51 allele (wt‐TDAG51) (A) or the disrupted TDAG51 allele (ko‐TDAG51) (B). PCR amplification and gel electrophoresis was also used to identify mice that were deleted for the ApoE allele (C). Neg, negative controls for PCR reactions (A through C). Liver tissue obtained from PCR identified TDAG51−/−/ApoE−/− dKO or control TDAG51+/+/ApoE−/− mice was homogenized, and total protein lysates were examined by immunoblotting using an anti‐TDAG51 antibody (D). β‐actin was used as a loading control. TDAG51 indicates T‐cell death‐associated gene 51; PCR, polymerase chain reaction; ApoE, apolipoprotein E; ko, knockout; dKO, double knockout.
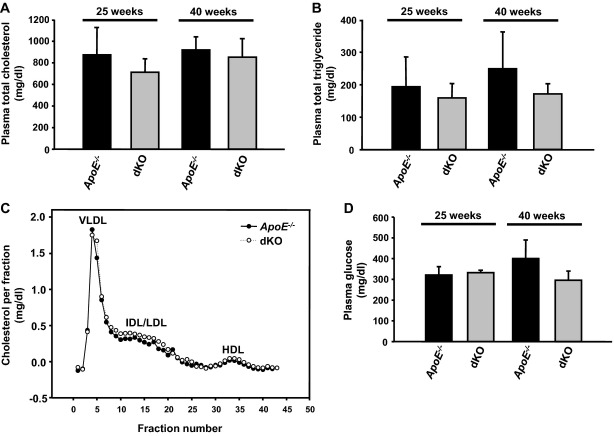
Total plasma lipids, glucose, and inflammatory cytokines, as well as aortic atherosclerotic lesion size and composition, were analyzed at 25 and 40 weeks of age. No significant differences in total plasma cholesterol or triglycerides were observed between dKO and ApoE−/− mice (Figure 2A and 2B). Consistent with these findings, plasma lipid profiles were indistinguishable between these groups at 25 weeks of age (Figure 2C). No significant changes in body weight (data not shown), plasma glucose level (Figure 2D), or morphology of pancreatic β cells from the islets of Langerhans (Figure 3) were observed in dKO and ApoE−/− mice.
Figure 2.
Effect of TDAG51 deficiency on plasma lipoproteins and glucose in ApoE−/− mice. TDAG51−/−/ApoE−/− mice (dKO) and ApoE−/− control mice were fed standard chow diets for 25 or 40 weeks (n=8 to 9 per group). Following euthanization, plasma was collected, and (A) total cholesterol, (B) triglycerides, (C) lipoprotein profiles, and (D) glucose were determined. Plasma lipoprotein profiles were obtained from 25‐week‐old mice by fast protein liquid chromatography. TDAG51 indicates T‐cell death‐associated gene 51; ApoE, apolipoprotein E; dKO, double knockout; IDL, intermediate‐density lipoprotein; LDL, low‐density lipoprotien; HDL, high‐density lipoprotein.
Figure 3.
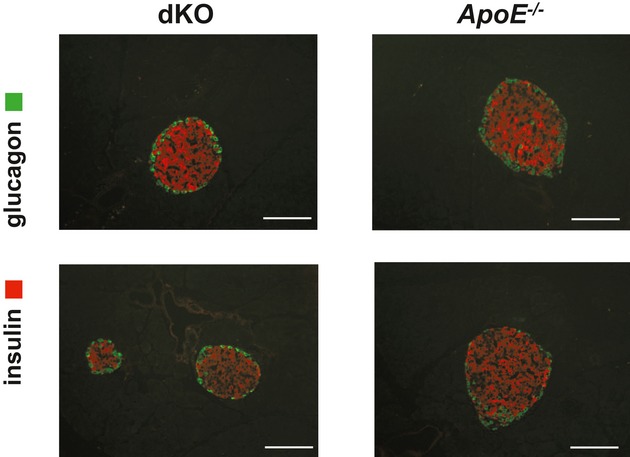
Identification of insulin and glucagon in β cells from the islets of Langerhans. Representative sections from 5 mice per group of pancreatic tissue from 25‐week‐old TDAG51+/+/ApoE−/− (ApoE−/−) or TDAG51−/−/ApoE−/− (dKO) mice immunostained for insulin (red) or glucagon (green). Scale bars, 50 μm. TDAG51 indicates T‐cell death‐associated gene 51; ApoE, apolipoprotein E; dKO, double knockout.
As reported previously,6,15 TDAG51 is expressed in lesion‐resident macrophages and endothelial cells from 25‐week‐old ApoE−/− mice (Figure 4). However, this pattern of expression was absent in atherosclerotic lesions from dKO mice. Paraffin sections from the aortic root of dKO and ApoE−/− mice at 25 or 40 weeks of age were stained with hematoxylin and eosin to assess lesion growth and gross cellular morphology (Figure 5A). Lesion area was reduced by 50% at 25 weeks (0.70±0.14 versus 1.40±0.27 ×105 μm2, P=0.038) and 56% at 40 weeks (2.45±0.29 versus 5.52±0.63 ×105 μm2, P=0.0043) (Figure 5B) in dKO mice, compared with ApoE−/− mice. In addition, en face Oil Red O (ORO) lipid staining (Figure 5C) was decreased by 75% in the aortas of dKO mice at 40 weeks of age (8.9±4.4% versus 2.0±0.9%, P<0.005). Although not significant at 25 weeks, mean necrotic core size was reduced by >50% in the dKO mice compared with ApoE−/− mice (0.12±0.06 versus 0.26±0.06 ×105 μm2, P=0.26) (Figures 5D and 5E), consistent with the reduction in atherosclerotic lesion size. Normalization to lesion area showed a 14.4±3.8% necrotic core area in the dKO mice, compared to 17.5±2.1% in ApoE−/− mice at 25 weeks. At 40 weeks mean necrotic core size in dKO mice was significantly smaller than in ApoE−/− mice (1.0±0.1 versus 3.5±0.6 ×105 μm2, P<0.005; Figure 5D and 5E), and when normalized to lesion area, necrotic cores of dKO mice were reduced compared with ApoE−/− controls (41±4% versus 63±8%, P<0.05). Thus, in the setting of a normal chow diet, ApoE−/− mice lacking TDAG51 exhibited reduced atherosclerotic lesion growth and necrosis.
Figure 4.

Expression of TDAG51 in atherosclerotic lesions. Six‐week‐old TDAG51+/+/ApoE−/− and TDAG51−/−/ApoE−/− mice were fed control chow diet for 25 weeks. Mice were euthanized, and hearts containing aortic roots were removed, embedded in paraffin, sectioned, and immunostained for TDAG51. Indirect immunofluorescence detection of TDAG51 in lesions (arrows) from aortic roots of TDAG51+/+/ApoE−/− mice (A and B). B, Magnified region from A. Representative images from 5 mice are shown. To assess nonspecific immunofluorescence, aortic root sections from TDAG51−/−/ApoE−/− mice were immunostained using an anti‐TDAG51 antibody (C). Scale bars: 100 μm in A and C; 50 μm in B. TDAG51 indicates T‐cell death‐associated gene 51; ApoE, apolipoprotein E.
Figure 5.
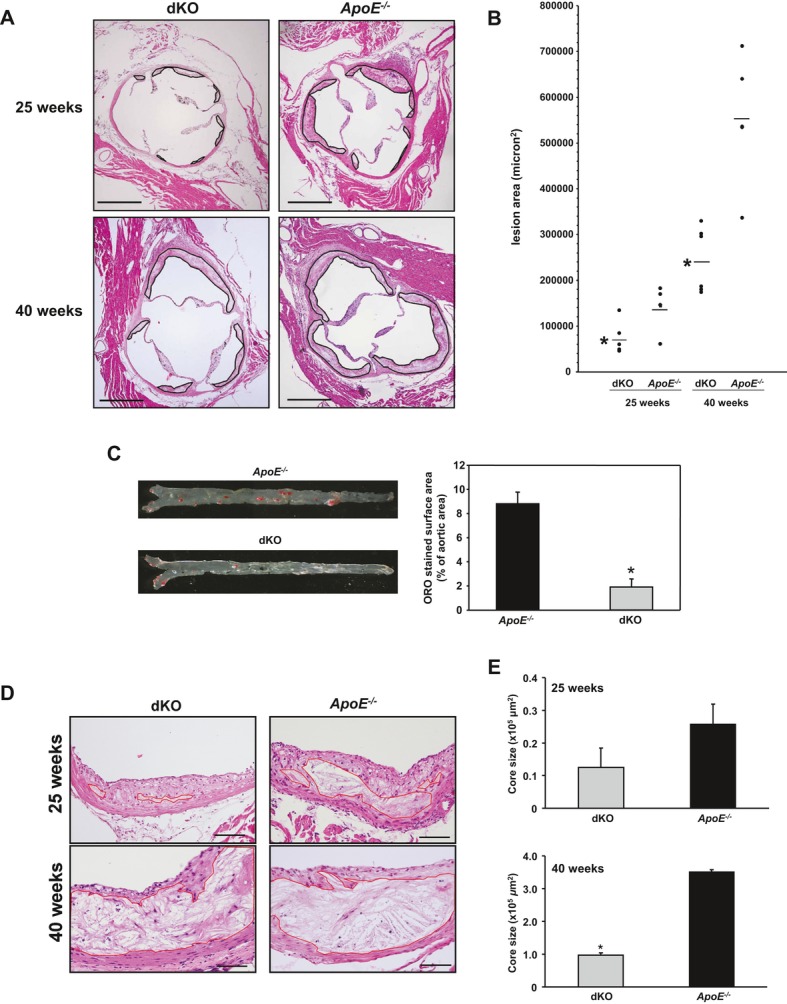
Effect of TDAG51 deficiency on atherosclerotic lesions in ApoE−/− mice. TDAG51−/−/ApoE−/− mice (dKO) and ApoE−/− control mice were fed standard chow diets for 25 or 40 weeks (n=8 to 9 per group). A and B, Aortic root sections were stained with hematoxylin/eosin, and mean atherosclerotic lesion size was determined. Significant reduction (*P<0.05) in lesion size was observed at both 25 and 40 weeks in dKO compared with ApoE−/− control groups. Black line demarcates lesion area. Scale bar=500 μm. C, Representative en face Oil Red O (ORO)‐stained aortas and quantitative assessment showed significant reduction (*P=0.0016) in lipid deposition in aortas from 40‐week‐old dKO mice compared with the control group. For quantitative data, results from 3 independent experiments are shown. D, Representative images are shown of necrotic core sizes in aortic root lesions of 25‐ and 40‐week‐old dKO and ApoE−/− mice (n=5). Red line demarcates necrotic core area. Scale bar=100 μm. E, Necrotic core sizes of 25‐ and 40‐week‐old dKO mice were smaller in aortic root lesions compared with their respective ApoE−/− control groups (n=5). Data are shown as mean necrotic core area±SE (*P<0.005). TDAG51 indicates T‐cell death‐associated gene 51; ApoE, apolipoprotein E; dKO, double knockout.
Immunohistochemical analysis revealed that dKO and ApoE−/− mice developed fatty streaks and mature atherosclerotic lesions, consisting of macrophages and smooth muscle cells, in the atherosclerotic cap region (Figure 6). However, at 25 and 40 weeks of age, there were no significant differences in the content of either macrophages or smooth muscle cells in the lesions of dKO and ApoE−/− mice (Figure 6 and Table 1). In support of the en face lipid staining (Figure 5C) and increased necrotic core size (Figure 5D and 5E), cholesterol crystals were prevalent in the necrotic core regions of the 25‐week‐old ApoE−/− mice (Figure 5D). Collagen content in the lesions, as measured by Masson's trichrome staining, showed high intralesion variability and did not differ significantly between the ApoE−/− and dKO groups (23.4% versus 27.9%, P=0.48; Figure 7). However, at 40 weeks dKO mice exhibited less vascular calcification, as assessed by von Kossa staining, compared with ApoE−/− mice (Figure 8). Inflammatory cytokines are known to influence several cellular processes that accelerate atherosclerotic lesion growth and stability.33 However, loss of TDAG51 had no significant effect on plasma levels of proinflammatory cytokines, including IL‐12, TNF‐α, or MCP‐1, up to 40 weeks (Table 2). These data suggest the decrease in lesion area was primarily a result of reduction in necrotic core size.
Figure 6.
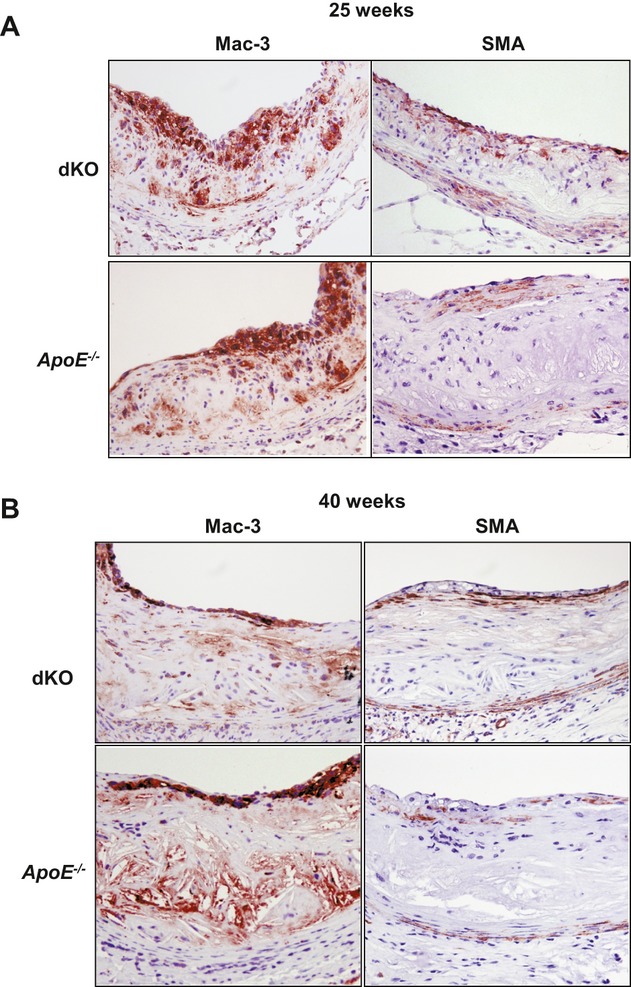
Morphological assessment of atherosclerotic lesions from TDAG51−/−/ApoE−/− (dKO) and ApoE−/− control mice. Atherosclerotic lesions from aortic roots of mice fed control chow diet for 25 or 40 weeks (n=8 to 9 per group) were studied. A, Hearts containing aortic roots of 25‐week‐old mice were removed, embedded in paraffin, sectioned, and immunostained for macrophages (Mac‐3) and smooth muscle cells (SMA). A representative image is shown of 5 mice per group. Microscope magnification ×20. B, Hearts containing aortic roots of 40‐week‐old mice were removed, embedded in paraffin, sectioned, and immunostained for Mac‐3 and SMA. A representative image is shown of 5 mice per group. Microscope magnification ×20. TDAG51 indicates T‐cell death‐associated gene 51; ApoE, apolipoprotein E; dKO, double knockout.
Table 1.
Lesion Composition of TDAG51−/−/ApoE−/− and ApoE−/− Mice
| % Mac‐3 Staining | % SMA Staining | |||||||
|---|---|---|---|---|---|---|---|---|
| dKO | ApoE −/− | n | P | dKO | ApoE −/− | n | P | |
| 25 Weeks | 20.07 | 5.35 | 4 | NS | 3.31 | 2.38 | 5 | NS |
| 40 Weeks | 5.77 | 3.69 | 5 | NS | 0.79 | 0.42 | 5 | NS |
Lesions from 25‐ or 40‐week‐old TDAG51−/−/ApoE−/− (dKO) and ApoE−/− mice were sectioned and probed for Mac‐3 (macrophages) and SMA (smooth muscle actin). Macrophage or smooth muscle cell area was measured, and data are expressed as percentage of lesion area. TDAG51 indicates T‐cell death‐associated gene 51; ApoE, apolipoprotein E; dKO, double knockout; n, mouse number; NS, not significant.
Figure 7.
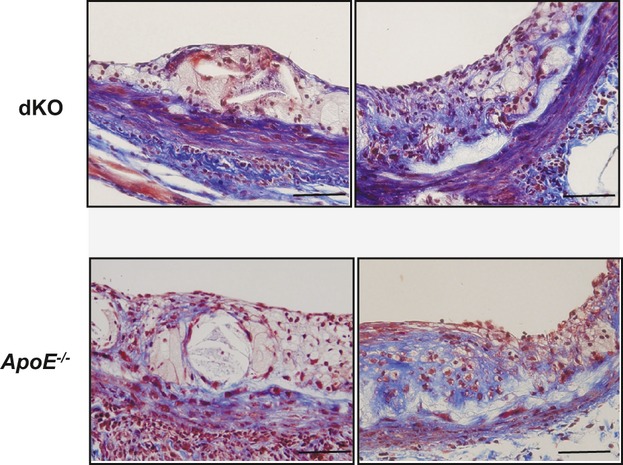
Collagen content in atherosclerotic lesions. Six‐week‐old TDAG51+/+/ApoE−/− (ApoE−/−) and TDAG51−/−/ApoE−/− (dKO) mice were fed control chow diet for 25 weeks. Hearts containing aortic roots were removed, embedded in paraffin, sectioned, and stained with Masson's trichrome. Different sections from the same lesion were shown to demonstrate intralesion variability in collagen positivity (blue color). Representative images from 5 mice per group are shown. Scale bar=50 μm. TDAG51 indicates T‐cell death‐associated gene 51; ApoE, apolipoprotein E; dKO, double knockout.
Figure 8.
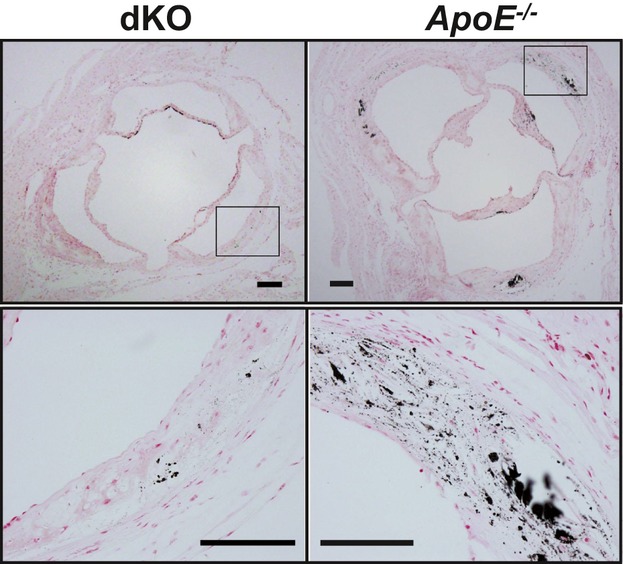
Calcification in atherosclerotic lesions. TDAG51+/+/ApoE−/− (ApoE−/−) and TDAG51−/−/ApoE−/− (dKO) mice were fed chow diet for 40 weeks. Hearts containing aortic roots were removed, sectioned, and stained with von Kossa. Representative images from 3 mice per group are shown. Scale bar=100 μm. TDAG51 indicates T‐cell death‐associated gene 51; ApoE, apolipoprotein E; dKO, double knockout.
Table 2.
Plasma Inflammatory Marker Levels
| TDAG51−/−/ApoE−/− | TDAG51+/+/ApoE−/− | P Value | |
|---|---|---|---|
| 15 Weeks | |||
| IL‐12, pg/mL | 50.2±18.4 (n=3) | 81.3±34.1 (n=3) | NS |
| TNF‐α, pg/mL | 15.3±1.0 (n=3) | 16.6±1.8 (n=3) | NS |
| MCP‐1, pg/mL | 258.2±70.2 (n=3) | 204±51.2 (n=3) | NS |
| IFN‐γ, pg/mL | ND | ND | |
| 25 Weeks | |||
| IL‐12, pg/mL | 47.5±13.0 (n=5) | 60.4±7.4 (n=6) | NS |
| TNF‐α, pg/mL | 19.1±3.7 (n=4) | 16.6±1.8 (n=5) | NS |
| MCP‐1, pg/mL | 185.7±51.9 (n=4) | 133.9±10.9 (n=5) | NS |
| IFN‐γ, pg/mL | ND | ND | |
| 40 Weeks | |||
| IL‐12, pg/mL | 47.7±10.5 (n=5) | 48.7±4.6 (n=6) | NS |
| TNF‐α, pg/mL | 19.0±2.6 (n=6) | 18.5±2.6 (n=6) | NS |
| MCP‐1, pg/mL | 157.3±24.3 (n=5) | 224±46.9 (n=5) | NS |
| IFN‐γ, pg/mL | ND | ND | |
Data are shown as mean±SE. TDAG51 indicates T‐cell death‐associated gene 51; ApoE, apolipoprotein E; IL‐12, interleukin 12; TNF‐α, tumor necrosis factor α; MCP‐1, monocyte chemoattractant protein‐1; IFN‐γ, interferon γ; NS, not significant vs age‐matched groups; ND, not detected.
TDAG51 Deficiency Is Cytoprotective Against ER Stress and Oxidative Stress
TDAG51 expression is increased by ER stress and causes detachment‐induced apoptotic cell death when overexpressed.15,34 Recent studies have reported that reducing ER stress by treatment with the small chemical chaperone 4‐PBA35 or by genetic ablation of CHOP5 attenuates apoptosis, plaque necrosis, and atherogenesis in ApoE−/− mice. To investigate whether the absence of TDAG51 decreases apoptosis in vivo, atherosclerotic lesions were stained for TUNEL and activated caspase‐3.6 TUNEL staining as well as activated caspase‐3 staining was reduced in the necrotic core of advanced lesions from dKO mice, compared with ApoE−/− mice (Figure 9A). In support of these findings, we observed that TDAG51−/− peritoneal macrophages (Figure 9B) were resistant to cell death induced by ER stress and oxidative stress.
Figure 9.
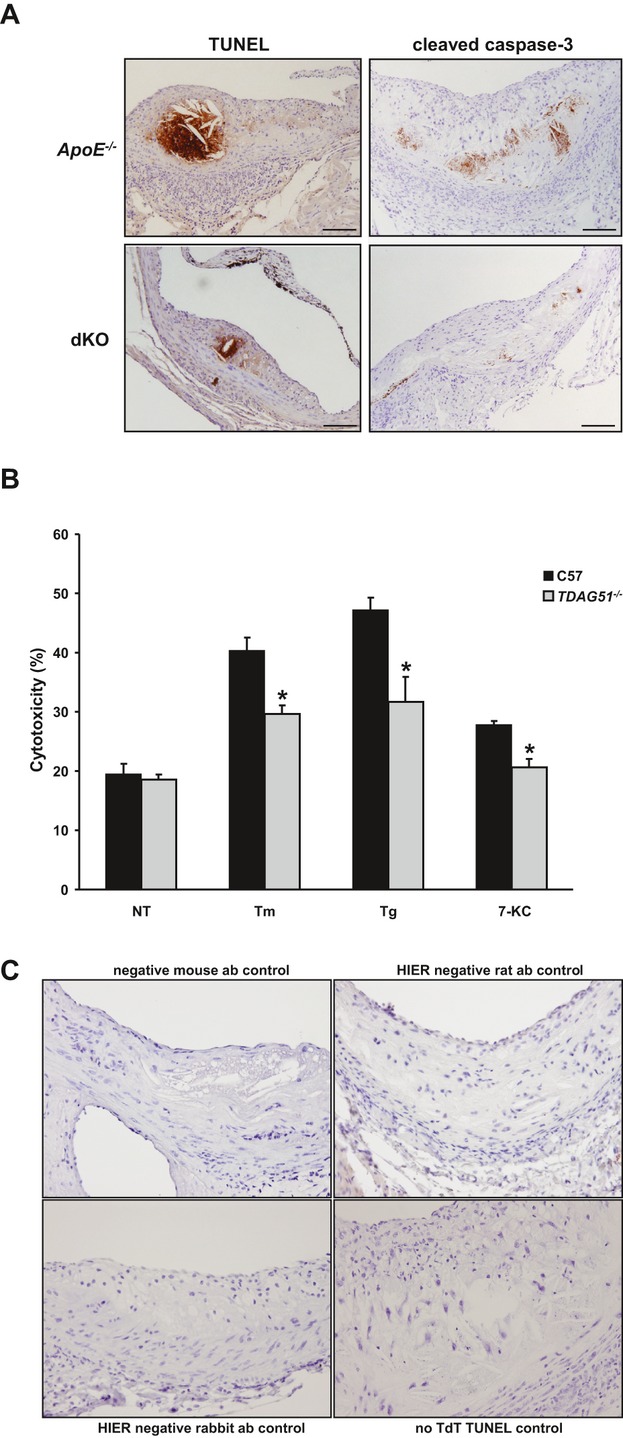
TDAG51 deficiency reduces cell death in atherosclerotic lesions and peritoneal macrophages. TDAG51−/−/ApoE−/− (dKO) or ApoE−/− mice were placed on control chow diet for 25 weeks. A, Representative images of atherosclerotic lesions from 5 mice per group were stained for TUNEL and cleaved caspase‐3. Microscope magnification ×20. B, Peritoneal macrophages isolated from wild‐type C57BL/6 (C57) mice or TDAG51−/− mice were treated with 2.5 μg/mL tunicamycin (Tm), 100 nmol/L thapsigargin (Tg), or 10 μmol/L 7‐ketocholesterol (7‐KC) for 24 hours. Cytotoxicity was determined by measuring LDH release. Mean±SE from 5 independent experiments are shown. *P<0.05 relative to C57 controls. C, Negative controls for IHC sections. Primary antibodies were omitted, and only secondary antibodies were used (anti‐mouse, anti‐rat, or anti‐rabbit, with heat‐induced epitope retrieval [HIER] where specified). Negative control for the TUNEL staining had no terminal deoxynucleotidyl transferase (TdT) added to the staining mixture. TDAG51 indicates T‐cell death‐associated gene 51; ApoE, apolipoprotein E; dKO, double knockout; LDH, lactate dehydrogenase; IHC, immunohistochemistry; PPARγ, peroxisome proliferator‐activated receptor γ; ab, antibody; NT, nontreated.
TDAG51 Negatively Regulates the Expression of PPARγ and Its Downstream Targets
To provide further mechanistic insight into the antiatherogenic effects of TDAG51 deficiency, we investigated the expression of PPARγ because of its involvement in modulating various pathways contributing to atherogenesis, such as inflammation, lipid metabolism, and oxidative stress. Furthermore, we have previously observed an inverse correlation between TDAG51 and PPARγ expression in 3T3‐L1 cells.18 Prior studies have demonstrated the expression of PPARγ in lesion‐resident macrophages from LDLR−/− mice.36 To determine whether deficiency of TDAG51 alters the expression of PPARγ in lesional macrophages, paraffin sections from the aortic roots of chow‐fed dKO and ApoE−/− mice after 15 or 25 weeks were immunostained for PPARγ (Figure 10A). Intense nuclear staining for PPARγ was observed in lesion‐resident macrophages from dKO mice compared with ApoE−/− mice. As a positive control, nuclear staining for PPARγ was observed in adipocytes from dKO and ApoE−/− mice (Figure 10B). Again, the intensity of nuclear staining for PPARγ was increased in adipocytes from dKO mice as well as in cultured TDAG51−/− macrophages (Figure 10C). Furthermore, TDAG51−/− peritoneal macrophages exhibited increased mRNA expression of PPARγ (2.8±0.5‐fold, P<0.05) and its target gene, LXRα (1.9±0.3‐fold, P<0.05), as well as PPARγ‐inducible gene ABCG1 (1.7±0.1‐fold, P<0.05), but not ABCA1, compared with wild‐type macrophages (Figure 11).
Figure 10.

TDAG51 deficiency increases PPARγ expression and nuclear localization in lesion‐resident macrophages. A, TDAG51−/−/ApoE−/− (dKO) or ApoE−/− mice were placed on control chow diet for 15 or 25 weeks. Atherosclerotic lesions from the aortic roots were sectioned and immunostained for PPARγ. Arrows indicate PPARγ‐positive staining macrophages. Representative images from 5 mice per group are shown. Scale bar=50 μm. B, Identification of PPARγ in adipose tissue from TDAG51+/+/ApoE−/− (ApoE−/−) and TDAG51−/−/ApoE−/− (dKO) mice fed chow diet for 40 weeks. Fat pads were removed, embedded in paraffin, sectioned, and immunostained for PPARγ. Arrows indicate positive nuclear immunostaining for PPARγ. Consistent with lesion‐resident TDAG51−/− macrophages, intensity of nuclear PPARγ staining was increased in TDAG51−/− adipocytes. Representative images from 5 mice per group are shown. Scale bar=100 μm. C, Optical sections 0.8 μm in thickness were obtained through TDAG51−/− and C57BL/6 (C57) peritoneal macrophages at the plane of the nuclei (arrows). In C57 macrophages, little PPARγ (green) was visualized within the nucleus, whereas in TDAG51−/− macrophages, PPARγ (green) was found to colocalize (merged green and red producing yellow) with nucleic acids (red) as shown by ethidium bromide (EtBr) staining in the nuclei (arrows). Representative images from 3 independent experiments are shown. Scale bar=10 μm. TDAG51 indicates T‐cell death‐associated gene 51; ApoE, apolipoprotein E; dKO, double knockout; PPARγ, peroxisome proliferator‐activated receptor γ.
Figure 11.
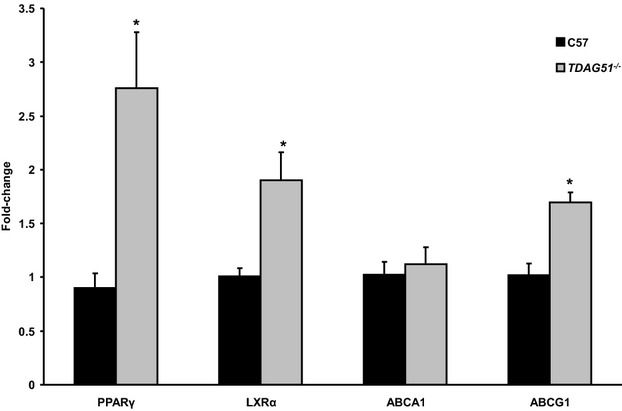
Detection of PPARγ and its target genes in peritoneal macrophages. Total RNA was isolated from male TDAG51−/− or C57BL/6 (C57) peritoneal macrophages and mRNA expression assessed by qRT‐PCR. Data were normalized to 18s, and fold‐change in expression relative to C57 was determined. Results from 5 independent experiments are shown as mean±SE. *P<0.05, relative to C57 controls. PPARγ indicates peroxisome proliferator‐activated receptor γ; TDAG51, T‐cell death‐associated gene 51; qRT‐PCR, quantitative real‐time polymerase chain reaction.
Consistent with these findings, reintroduction of TDAG51 using a retrovirus expression construct caused a significant reduction in PPARγ mRNA expression (P<0.001) in TDAG51−/− mouse embryonic fibroblasts (data not shown). Furthermore, siRNA knockdown of TDAG51 in HeLa cells also showed enhanced PPARγ expression (data not shown).
TDAG51 Deficiency Enhances PPARγ‐Dependent Inhibition of Inflammatory Cytokine Expression in Macrophages
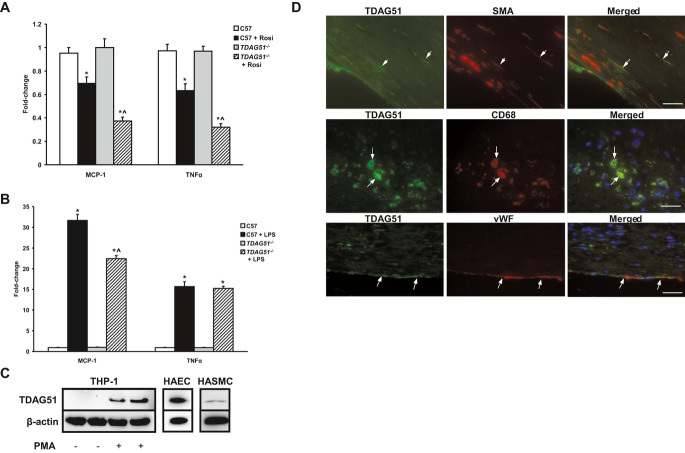
Inflammation has been shown to modulate several processes that contribute to atherogenesis and lesion stability.33 TDAG51−/− peritoneal macrophages exhibited no basal differences in the expression of either MCP‐1 or TNFα relative to controls, as assessed by RT‐PCR (Figure 12A). However, in the presence of the PPARγ agonist rosiglitazone, TDAG51−/− macrophages expressed significantly lower levels of both MCP‐1 and TNFα, relative to wild‐type macrophages (Figure 12A). Furthermore, TDAG51 deficiency caused a significant reduction in LPS‐induced expression of MCP‐1 (22.4±0.8‐fold versus 31.6±1.5‐fold, P<0.05), but not TNF‐α, compared with wild‐type macrophages (Figure 12B). Human THP‐1‐derived macrophages, but not THP‐1 monocytes, as well as aortic endothelial cells (HAECs) and aortic smooth muscle cells (HASMCs), expressed TDAG51 protein (Figure 12C). Consistent with these findings, TDAG51 was also expressed in macrophages (CD68), smooth muscle cells (SMA), and endothelial cells (vWF) in lesions from human carotid arteries, as determined by dual immunohistochemistry (Figure 12D).
Figure 12.
TDAG51 deficiency increases rosiglitazone‐dependent inhibition of inflammatory marker expression in peritoneal macrophages. A, Peritoneal macrophages isolated from TDAG51−/− or C57BL/6 (C57) mice were incubated in the presence or absence of 20 μmol/L rosiglitazone (Rosi). mRNA expression of MCP‐1 and TNF‐α were assessed by qRT‐PCR. Data from 6 independent experiments are shown as mean±SE. *P<0.05 vs nontreated controls; ^P<0.05 vs C57+rosiglitazone. B, Peritoneal macrophages isolated from TDAG51−/− or C57BL/6 (C57) mice were incubated in the presence or absence of 50 ng/mL lipopolysaccharide (LPS). mRNA expression of MCP‐1 and TNF‐α was assessed by qRT‐PCR. Data from 6 independent experiments are shown as mean±SE. *P<0.05 vs controls; ^P<0.05 vs C57+LPS. C, THP‐1 monocytes were incubated in the presence or absence of 100 nmol/L PMA for 48 hours. Following incubation, THP‐1 monocytes and PMA‐derived THP‐1 macrophages were immunoblotted for TDAG51. Untreated human aortic endothelial cells (HAECs) and human aortic smooth muscle cells (HASMCs) were also immunoblotted for TDAG51. β‐actin was used as a loading control. Representative immunoblots from 3 independent experiments are shown. D, Atherosclerotic lesions from human carotid arteries were stained by double immunofluorescence to identify the cell types positive for TDAG51. Some of the smooth muscle cells (positive for smooth muscle actin [SMA]), macrophages (positive for CD68), and endothelial cells (positive for vWF) were also positive for TDAG51 (arrows). Scale bar=100 μm. TDAG51 indicates T‐cell death‐associated gene 51; qRT‐PCR, quantitative real‐time polymerase chain reaction; TNF‐α, tumor necrosis factor α; vWF, von Willebrand factor; MCP‐1, monocyte chemoattractant protein‐1; THP‐1, human monocytic cell line; PMA, phorbol 12‐myristate 13‐acetate.
Loss of TDAG51 Increases Cholesterol Efflux in Cultured Peritoneal Macrophages
Given that PPARγ increases reverse cholesterol transport in lesion‐resident macrophages and is considered atheroprotective,37–38 we examined the effects of TDAG51 deficiency on macrophage foam cell formation and cholesterol efflux. To assess macrophage foam cell formation, peritoneal macrophages were cultured in the absence or presence of acetylated low‐density lipoprotein (LDL), and the accumulation of intracellular lipids was examined by ORO staining (Figure 13A). TDAG51−/− macrophages showed a significant reduction in ORO staining at 48 hours compared with wild‐type macrophages (Figure 13B). TDAG51−/− macrophages also accumulated significantly less cellular total cholesterol (1.8±0.1‐fold versus 3.1±0.1‐fold, P<0.05; Figure 13C) and free cholesterol (0.9±0.1‐fold versus 1.5±0.1‐fold, P<0.05; Figure 13D) after incubation with acetyl‐LDL (50 μg/mL) for 48 hours, relative to wild‐type macrophages. Consistent with the hypothesis that increased PPARγ results in reduced lipid accumulation, the PPARγ antagonist GW9662 (10 μmol/L) increased cellular total cholesterol in both wild‐type and KO macrophages after 48 hours incubation with 50 μg/mL acetyl‐LDL, compared with acetyl‐LDL treatment alone (Figure 13E). To determine whether the reduced lipid accumulation with TDAG51 deficiency was the result of increased cholesterol efflux, macrophages were loaded with [3H]cholesterol, and the percent change in intracellular radiolabeled cholesterol in the presence or absence of high‐density lipoprotein (HDL) was measured (Figure 13F). Cholesterol efflux was significantly increased in TDAG51−/− peritoneal macrophages 2, 3, and 5 hours after the addition of HDL, compared with WT macrophages (Figure 13F). PPARγ agonists induce the expression of ABCG1, a protein transporter mediating cholesterol efflux from macrophages.39 Consistent with these results, ABCG1 mRNA expression, but not ABCA1 expression, was significantly increased in TDAG51−/− peritoneal macrophages compared with wild‐type macrophages (Figure 11). Taken together, these results suggest the cumulative effect of increased cholesterol efflux over time leads to significantly lower intracellular total and free cholesterol levels in TDAG51−/− macrophages.
Figure 13.
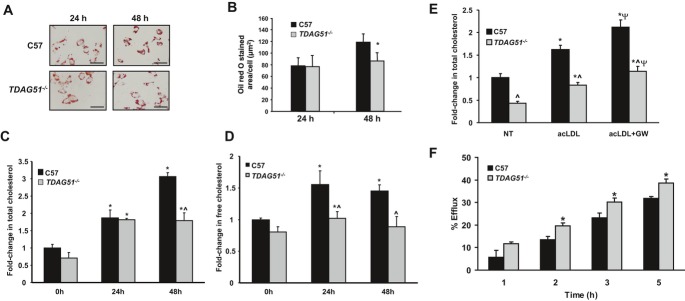
Lipid accumulation and cholesterol efflux in TDAG51−/− peritoneal macrophages. A, Representative images from 3 independent experiments of Oil Red O (ORO) staining of C57BL/6 (C57) or TDAG51−/− macrophages treated with acetylated LDL for 24 or 48 hours. Scale bar=20 μm. The amount of ORO staining was quantified B and is shown as mean±SE from 3 independent experiments. *P<0.05 compared with C57 macrophages. C and D, C57BL/6 (C57) or TDAG51−/− peritoneal macrophages were incubated in the presence or absence of 50 μg/mL acetylated LDL for 24 or 48 hours. Lipids were extracted and cellular total C or free D cholesterol assessed biochemically. Cholesterol was normalized to cellular protein, and fold‐change relative to C57 controls was calculated. *P<0.05 vs 0 hours controls; ^P<0.05 vs C57 at the same point. Data are shown as mean fold‐change±SE (n=6). E, C57BL/6 (C57) or TDAG51−/− peritoneal macrophages were incubated in the presence or absence of 50 μg/mL acetylated LDL or 10 μmol/L GW9662 for 48 hours. Lipids were extracted and cellular total cholesterol assessed. *P<0.05 vs nontreated (NT) controls; ^P<0.05 vs C57 controls; ΨP<0.05 vs acLDL‐treated groups. Data are shown as mean fold‐change±SE (n=10). F, HDL‐dependent cholesterol efflux from TDAG51−/− or C57 peritoneal macrophages. Mean±SE from 5 independent experiments is shown. *P<0.05 compared with C57 controls. TDAG51 indicates T‐cell death‐associated gene 51; LDL, low‐density lipoprotein; HDL, high‐density lipoprotein; acLDL, acetyl‐LDL; acLDL+GW, acetyl‐LDL+GW9662.
Effect of TDAG51 Deficiency on Peroxiredoxin 1 Expression
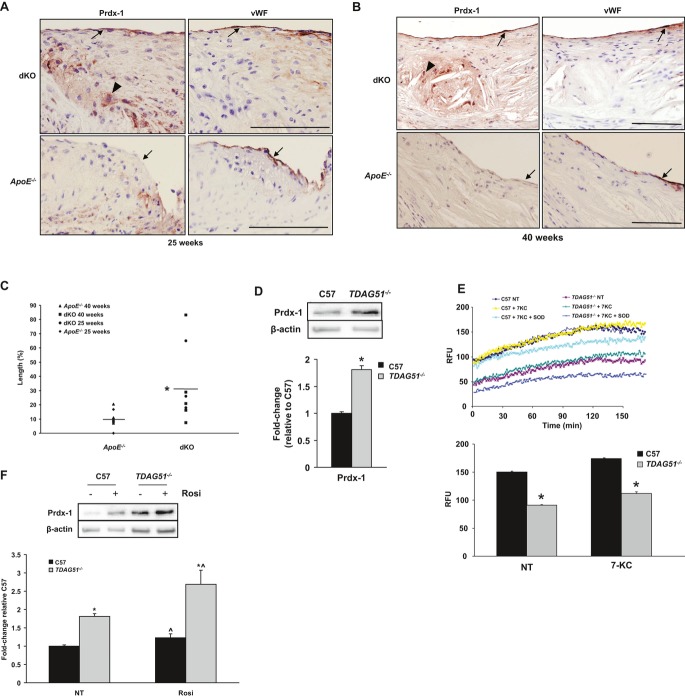
Recent studies have suggested that loss of peroxiredoxin 1 (Prdx‐1), a member of a ubiquitous family of antioxidant enzymes,40 reduces endothelial cell activation and early atherosclerosis.41 Because an increase in Prdx‐1 expression could contribute to the observed cytoprotective effect of TDAG51 deficiency against oxidative stress (Figure 9B), lesions from dKO and ApoE−/− mice were immunostained for Prdx‐1. At both 25 (36.4% versus 8.4%, P=0.10) and 40 (31.3% versus 11.2%, P=0.15) weeks, the percentage of Prdx‐1 immunopositivity in the endothelium was increased in dKO mice compared with ApoE−/− controls (Figure 14A and 14B). Furthermore, when mice from 25 and 40 weeks were combined, dKO mice exhibited significantly more Prdx‐1 immunopositivity than ApoE−/− mice (33.2% versus 10.1%, P=0.015; Figure 14C). In addition, TDAG51−/− peritoneal macrophages (Figure 14D) as well as lung microvascular endothelial cells (Figure 15A) exhibited increased Prdx‐1 protein expression. This correlated with a significant decrease in superoxide levels at basal conditions and improved resistance to 7‐ketocholesterol‐induced oxidative stress (Figures 9B, 14E, and 15B). A significant increase in Prdx‐1 protein was also observed in TDAG51−/− peritoneal macrophages (2.7±0.4‐fold, P<0.05) following treatment with the PPARγ agonist rosiglitazone, compared with wild‐type cells (1.2±0.1‐fold, P<0.05; Figure 14F). Rosiglitazone treatment also induced Prdx‐1 protein expression in microvascular endothelial cells, although no significant differences were observed between TDAG51−/− and wild‐type cells (Figure 15A). Although TDAG51−/− mouse aortic smooth muscle cells also exhibited increased resistance to oxidative stress‐induced cell death in vitro (Figure 16), no differences in lesion smooth muscle cell apoptosis were observed in vivo (Figure 9A).
Figure 14.
TDAG51 deficiency increases Prdx‐1 expression in atherosclerotic lesions and reduces intracellular superoxide levels in TDAG51−/− peritoneal macrophages. TDAG51−/−/ApoE−/− (dKO) or ApoE−/− mice were placed on control chow diet. Atherosclerotic lesions from aortic roots of (A) 25‐week‐old mice or (B) 40‐week‐old mice were sectioned and consecutive sections immunostained for Prdx‐1 and von Willebrand factor (vWF). Arrows indicate endothelium; arrowheads indicate macrophages/foam cells. Scale bar=100 μm. Representative images are shown from 5 mice per group. C, Percentage of Prdx‐1 positivity in endothelium (measured as the length of Prdx1‐positive endothelium divided by the total length of endothelium as immunostained with vWF) of 25‐ and 40‐week‐old dKO and ApoE−/− mice. The averages of 5 sections per mouse were assessed. *P<0.05 compared with ApoE−/− (n=8 to 9 for each genotype). D, Peritoneal macrophages isolated from TDAG51−/− mice exhibited elevated levels of Prdx‐1 protein, as determined by immunoblotting. Data are shown as mean±SE (n=9). *P<0.05 relative to C57BL/6 (C57) macrophages. E, TDAG51−/− peritoneal macrophages displayed lower levels of superoxide at both baseline and when subjected to 10 μmol/L 7‐ketocholesterol (7‐KC). Mean±SE from 6 independent experiments is shown. *P<0.05 relative to C57 macrophages. F, Peritoneal macrophages from C57BL/6 or TDAG51−/− mice were incubated in the presence or absence of 20 μmol/L rosiglitazone (Rosi) for 18 hours and then immunoblotted for Prdx‐1. Data are shown as mean±SE (n=9). *P<0.05 vs C57 controls; ^P<0.05 vs respective nontreated (NT) macrophages. TDAG51 indicates T‐cell death‐associated gene 51; Prdx‐1, peroxiredoxin‐1; ApoE, apolipoprotein E; dKO, double knockout; RFU, relative fluorescence unit.
Figure 15.
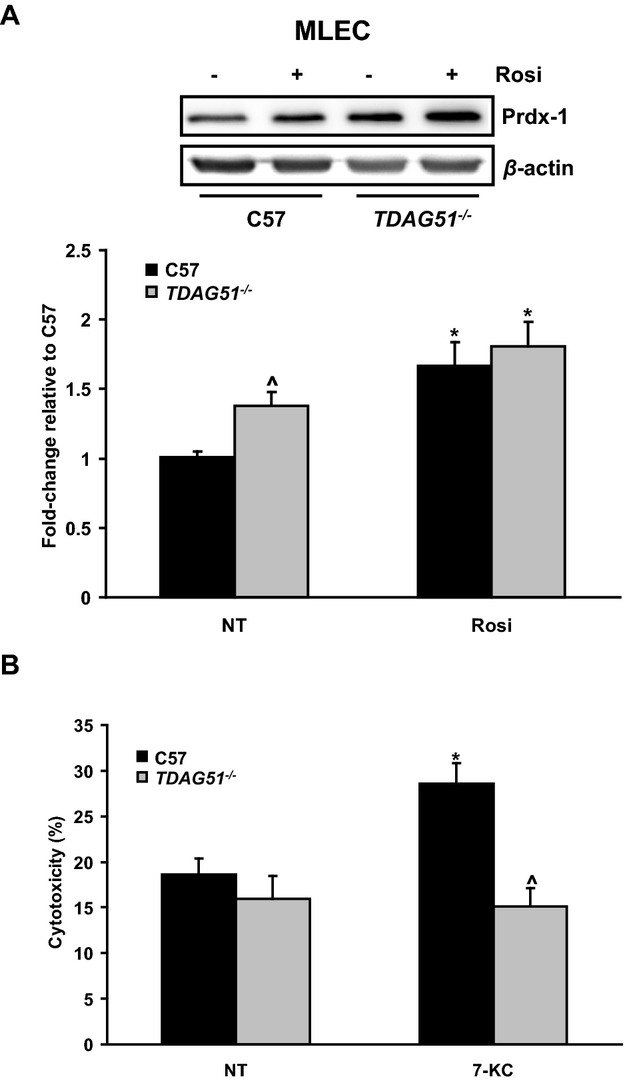
Prdx‐1 expression in TDAG51−/− mouse lung endothelial cells. A, Mouse lung endothelial cells (MLECs) from C57BL/6 (C57) or TDAG51−/− mice were treated in the presence or absence of 20 μmol/L rosiglitazone (Rosi) for 18 hours. After incubation, Prdx‐1 protein levels were assessed by immunoblotting. Data are shown as mean±SE (n=10). *P<0.05 vs respective nontreated (NT) controls; ^P<0.05 vs nontreated C57. B, C57BL/6 and TDAG51−/− mouse lung endothelial cells were incubated in the presence or absence of 5 μmol/L 7‐ketocholesterol (7‐KC) for 24 hours. Cytotoxicity was determined by measuring LDH release. Data are shown as mean±SE (n=7). *P<0.05 vs nontreated C57; ^P<0.05 vs 7‐KC‐treated C57. TDAG51 indicates T‐cell death‐associated gene 51; Prdx‐1, peroxiredoxin‐1; ApoE, apolipoprotein E; LDH, lactate dehydrogenase.
Figure 16.
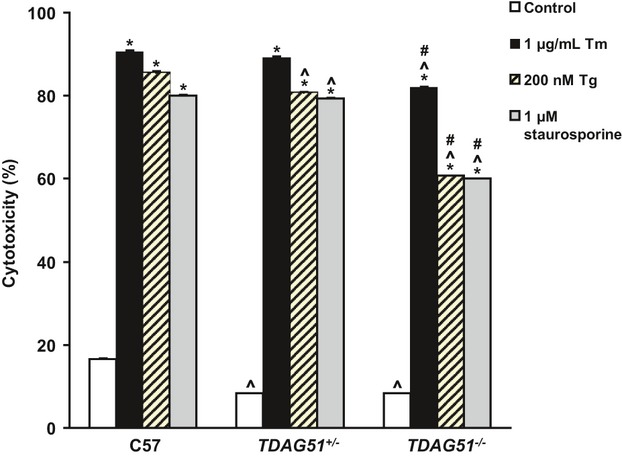
TDAG51 deficiency protects vascular smooth muscle cells (VSMCs) against endoplasmic reticulum (ER) and oxidative stress. VSMCs isolated from C57BL/6 (C57), TDAG51+/−, and TDAG51−/− mice were incubated in the presence or absence of 1 μg/mL tunicamycin (Tm), 200 nmol/L thapsigargin (Tg), or 1 μmol/L staurosporine for 48 hours. Cytotoxicity was determined by measuring LDH release. Results from 4 independent experiments are shown as mean±SE. *P<0.05 relative to respective genotype controls; ^P<0.05 compared with respective C57 group; #P<0.05 compared with respective TDAG51+/− group. TDAG51 indicates T‐cell death‐associated gene 51; LDH, lactate dehydrogenase.
Single‐Nucleotide Polymorphisms in the Human TDAG51 Gene Are Associated With CVD
The WTCCC case–control study of CVD published data for 5 single‐nucleotide polymorphisms (SNPs) in the 56‐kbp region that included the TDAG51 gene.30 Two of these SNPs (rs10880022 and rs2367446) were associated with CVD in this study (Table 3); both remained significant after Bonferroni correction for testing 5 SNPs. We genotyped rs10880022 and rs2367446 in the UCSF study31 and found that rs2367446 was also associated with myocardial infarction (OR, 1.24; 95% CI, 1.04 to 1.48; P=0.019). A combined analysis of rs2367446 in both studies found that it was associated with CVD, with an odds ratio of 1.15 (95% CI, 1.07 to 1.24, P=0.00031; Table 4); this P value remained significant after Bonferroni correction for testing 5 SNPs.
Table 3.
Association of SNPs in the TDAG51 Region With Myocardial Infarction in the WTCCC Study
| SNP | Chromosome | Position | Case | Control | P Value (Additive)* | ||
|---|---|---|---|---|---|---|---|
| Count | MAF | Count | MAF | ||||
| rs10880021 | 12 | 74 684 730 | 1823 | 0.150 | 2824 | 0.143 | 0.31 |
| rs10880022 | 12 | 74 684 852 | 1879 | 0.406 | 2875 | 0.434 | 0.0084 |
| rs2367446 | 12 | 74 685 000 | 1850 | 0.372 | 2811 | 0.343 | 0.0047 |
| rs17835106 | 12 | 74 692 068 | 1923 | 0.171 | 2933 | 0.181 | 0.20 |
| rs7976730 | 12 | 74 734 851 | 1924 | 0.376 | 2936 | 0.376 | 0.97 |
SNP indicates single‐nucleotide polymorphism; TDAG51, T‐cell death‐associated gene 51; WTCCC, Wellcome Trust Case–Control Consortium; MAF, minor allele frequency.
P value is from multivariable logistic regression model.
Table 4.
Association of rs2367446 With CVD
| Study | Case | Control | OR (95% CI)* | P Value* | ||||||
|---|---|---|---|---|---|---|---|---|---|---|
| CC | CT | TT | MAF | CC | CT | TT | MAF | |||
| UCSF | 93 | 321 | 309 | 0.351 | 76 | 333 | 373 | 0.310 | 1.24 (1.04 to 1.48) | 0.019 |
| WTCCC | 248 | 880 | 722 | 0.372 | 325 | 1281 | 1205 | 0.343 | 1.13 (1.04 to 1.23) | 0.005 |
| Combined | 341 | 1201 | 1031 | 0.366 | 401 | 1614 | 1578 | 0.336 | 1.15 (1.07 to 1.24) | 3.1×10⁻⁴ |
CVD indicates cardiovascular disease; UCSF, University of California, San Francisco; WTCCC, Wellcome Trust Case–Control Consortium; MAF, minor allele frequency; OR, odds ratio; CI, confidence interval. CC, CT, TT represent genotype.
P value and OR are from multivariable logistic regression model of UCSF and WTCCC and from Mantel–Haenszel for the combined studies.
Discussion
Several lines of evidence suggest that TDAG51 modulates lesion progression and plaque stability. First, TDAG51 is expressed in athero‐prone vascular endothelial cells19 as well as lesion‐resident macrophages and endothelial cells from ApoE−/− mice with diet‐induced hyperhomocysteinemia.6,15 Second, TDAG51 is expressed in apoptotic cells within the lipid‐rich necrotic core.6,15 Third, overexpression of TDAG51 in cultured human vascular endothelial cells leads to detachment‐induced apoptosis.15,34 Additional observations of increased TDAG51 expression during all stages of atherogenesis in the absence of HHcy6 suggest that other pathophysiological conditions that induce ER stress and/or TDAG51 expression modulate lesion growth and stability. In support of this hypothesis, we have reported that peroxynitrite, a proatherogenic agent generated from nitric oxide and superoxide, induces ER stress, TDAG51 expression, and apoptosis in cultured vascular endothelial cells.16 Given that ER stress plays a major role in lesion progression and plaque stability5–7,5–43 and that TDAG51 is an ER stress‐inducible gene6,14–16 expressed in lesion resident macrophages and endothelial cells, we sought to investigate the causal role of TDAG51 in atherogenesis.
In this study, TDAG51−/−/ApoE−/− dKO male mice showed significant reductions in lesion and necrotic lipid core sizes in aortic roots at 25 and 40 weeks compared with age‐matched ApoE−/− controls. Thus, in the setting of a normal chow diet, ApoE−/− mice lacking TDAG51 exhibited reduced growth of atherosclerotic lesions.
As TDAG51 is expressed in lesion‐resident cells undergoing apoptotic cell death,6,15 a potential mechanism through which TDAG51 deficiency contributes to the reduced atherosclerotic lesion size and necrosis observed in this study is decreased lesional apoptosis. Decreased lesional necrosis from dKO mice was associated with reduced apoptosis, as determined by immunohistochemical staining for TUNEL and cleaved caspase‐3. Our data are consistent with the hypothesis that retardation of the rate of necrotic core and lesion growth is in part a consequence of increased resistance to macrophage cell death resulting from TDAG51 deficiency. Consistent with this hypothesis, peritoneal macrophages isolated from TDAG51−/− mice were resistant to ER and oxidative stress‐induced cell death. Cytoprotection was associated with increased levels of Prdx‐1 in lesions of dKO mice as well as in TDAG51−/− macrophages and endothelial cells. This was accompanied by reduced superoxide levels in TDAG51−/− macrophages at both baseline and when exposed to oxidative stress, a finding consistent with previous studies.44–45 These data suggest that the elevation of Prdx‐1 levels associated with TDAG51 deficiency contributes to increased resistance to oxidative stress‐induced apoptosis, thereby reducing atherosclerotic lesion progression and rupture. This is consistent with the finding that Prdx‐1 deficiency in ApoE−/− mice causes endothelial activation (increased leukocyte rolling, endothelial P‐selectin, and vWF expression) and accelerates atherosclerosis.41 Further studies should clarify whether TDAG51‐mediated endothelial dysfunction contributes to atherogenesis.
It has been previously reported that inhibiting macrophage apoptosis increases atherosclerotic lesion size. Macrophage‐specific deletion of the proapoptotic gene p53 resulted in significantly increased lesion area after 15 or 20 weeks on a high‐fat diet in LDLR−/− mice.46 However, the authors attributed the larger lesion size to increased cell proliferation rather than decreased apoptosis, as no significant differences in apoptosis were observed. Liu et al11 demonstrated that macrophage‐specific deletion of Bax, a proapoptotic protein, decreased macrophage apoptosis and was associated with increased lesion area in LDLR−/− mice after 10 weeks on a Western diet. Alternatively, deletion of the macrophage apoptosis inhibitory factor (AIM) was associated with increased apoptosis and smaller lesion area in LDLR−/− mice after 5 or 12 weeks on a Western diet.47 Given the variability in genetic mouse models, diets used, and stage of atherosclerosis examined, a direct comparison to the current study is not possible. However, in the current study, in which lesions were assessed in dKO mice on a chow diet at later times (25 and 40 weeks) than the above studies (5 to 20 weeks on high‐fat or Western diets), data are consistent with the hypothesis that elevated macrophage apoptosis leads to reduced atherosclerosis at early stages and increased atherosclerosis at later stages of lesion growth. Furthermore, given that the model used in our study was global ablation of the TDAG51 gene, the observed reduction in lesion size may not be solely attributable to decreased macrophage apoptosis; other cell types and mechanisms may be involved.
Previous studies have indicated that PPARγ acts as a positive regulator of antioxidant defenses.48 Consistent with the inverse correlation between TDAG51 deficiency and PPARγ expression, rosiglitazone treatment induced Prdx‐1 protein expression by 23% (P<0.05) in TDAG51−/− macrophages, compared with 12% (P<0.05) in wild‐type macrophages (Figure 14F). These findings are consistent with previous studies showing that 15d‐PGJ2, a natural PPARγ agonist, induces expression of antioxidant proteins including Prdx‐149 and supports the hypothesis that the increased Prdx‐1 expression associated with TDAG51 deficiency is a consequence of elevated expression and/or activity of PPARγ, leading to the reduced atherosclerotic lesion growth observed in the dKO mice. Given the ability of TDAG51 to modulate transcriptional activity,13 we are currently investigating the possibility that TDAG51 modulates PPARγ transcriptional activity and/or nuclear localization.
It is well established that PPARγ activates reverse cholesterol transport in lesion‐resident macrophages.37–38 Furthermore, PPARγ ligands promote the reduction of atherosclerotic lesions,50–51 whereas the conditional knockout of macrophage PPARγ enhances atherosclerosis without altering plasma lipid levels.52 We observed increased cholesterol efflux as well as increased expression of ABCG1 in TDAG51−/− peritoneal macrophages. TDAG51−/− macrophages, compared with wild‐type cells, also accumulated fewer lipids, suggesting a reduction in foam cell formation. We recently reported that TDAG51 deficiency induced age‐associated adipogenesis and hepatic steatosis in TDAG51−/− mice,18 further implicating PPARγ in modulating the effects of TDAG51 deficiency. Taken together, our results suggest that TDAG51 deficiency, despite its effects on adipogenesis and hepatic lipogenesis, reduces atherosclerotic lesion growth via activation of multiple cellular pathways that regulate apoptosis, antioxidant status, and lipid storage/export.
Although studies reporting the beneficial role of PPARγ agonists in mitigating atherogenesis have been fairly consistent in mouse models, some controversy exists over the cardiovascular risk associated with the use of thiazolidinediones (TZDs) in patients. Several reports have indicated rosiglitazone is associated with significantly increased risk of myocardial infarction.53–54 In contrast, others have found the evidence for an association between rosiglitazone and myocardial infarction and CVD mortality to be inconclusive.55 Furthermore, pioglitazone, another PPARγ agonist, was reported to have significantly reduced cardiovascular risk in the PROactive study in diabetic patients with preexisting CVD.56 Given the current debate over the potential beneficial and adverse events associated with TZDs in regard to CVD risk, it remains to be determined whether increased PPARγ associated with TDAG51 deficiency and decreased atherosclerotic lesion growth in a mouse model can be extrapolated to a clinical setting. It should also be noted that this mechanism is likely not the only one that drives the antiatherogenic effect of TDAG51 deficiency. This could reflect TDAG51's role in apoptosis or signaling pathways that modulate macrophage viability and lipid metabolism.
The genetic association results from 2 independent case–control studies31,30 suggest that genetic variants in the TDAG51 region are associated with CVD. This finding is intriguing given the biological evidence for this gene in atherosclerosis. However, meta‐analyses of genomewide association studies57–58 did not find an association between SNPs in the TDAG51 region and CVD at the genomewide significance level (P<5×10⁻⁸). Therefore, the genetic association results we report here may have overestimated the risk associated with the SNPs we examined. Additional studies are thus required to further evaluate whether genetic variations in the TDAG51 gene are associated with altered expression of this gene and CVD. Functional characterization of these SNPs will also be helpful to understand the potential role of these SNPs in CVD. Because rs2367446 is in an intergenic region 20 kbp from TDAG51, it is possible that this SNP affects transcription of the TDAG51 gene.
In summary, we have characterized a previously unknown role for TDAG51 in modulating atherosclerotic lesion development and progression while addressing the underlying cellular mechanisms by which TDAG51 deficiency modulates these processes. Because the effects of TDAG51 are mediated by multiple pathways that affect lesion development and stability, our findings provide a unique opportunity to develop novel therapeutic approaches that decrease the risk of CVD by targeting TDAG51 expression and/or activity.
Source of Funding
This work was supported, in part, by research grants to Richard C. Austin from the Heart and Stroke Foundation of Ontario (PRG‐6502), the Canadian Institutes of Health Research (MOP‐126083, MOP‐111239), and the Ontario Research and Development Challenge Fund. Financial support from St. Joseph's Healthcare Hamilton is acknowledged. Jeffrey G. Dickhout is supported by the St. Joseph's Healthcare Hamilton Division of Nephrology Junior Research Award. Richard C. Austin is a Career Investigator of the Heart and Stroke Foundation of Ontario and holds the Amgen Canada Research Chair in the Division of Nephrology at St. Joseph's Healthcare and McMaster University.
Disclosures
None.
Acknowledgments
We thank the members of the Austin laboratory for their help during completion of this research project as well as expert technical assistance from Hansa Patel. TDAG51 heterozygous mice were kindly provided by Dr Y. Choi, University of Pennsylvania.
References
- 1.Lloyd‐Jones DM. Cardiovascular risk prediction: basic concepts, current status, and future directions. Circulation. 2010; 121:1768-1777 [DOI] [PubMed] [Google Scholar]
- 2.Lusis AJ. Atherosclerosis. Nature. 2000; 407:233-241 [DOI] [PMC free article] [PubMed] [Google Scholar]
- 3.Moore KJ, Tabas I. Macrophages in the pathogenesis of atherosclerosis. Cell. 2011; 145:341-355 [DOI] [PMC free article] [PubMed] [Google Scholar]
- 4.Isner JM, Kearney M, Bortman S, Passeri J. Apoptosis in human atherosclerosis and restenosis. Circulation. 1995; 91:2703-2711 [DOI] [PubMed] [Google Scholar]
- 5.Thorp E, Li G, Seimon TA, Kuriakose G, Ron D, Tabas I. Reduced apoptosis and plaque necrosis in advanced atherosclerotic lesions of ApoE−/− and Ldlr−/− mice lacking chop. Cell Metab. 2009; 9:474-481 [DOI] [PMC free article] [PubMed] [Google Scholar]
- 6.Zhou J, Lhotak S, Hilditch BA, Austin RC. Activation of the unfolded protein response occurs at all stages of atherosclerotic lesion development in apolipoprotein E‐deficient mice. Circulation. 2005; 111:1814-1821 [DOI] [PubMed] [Google Scholar]
- 7.Feng B, Yao PM, Li Y, Devlin CM, Zhang D, Harding HP, Sweeney M, Rong JX, Kuriakose G, Fisher EA, Marks AR, Ron D, Tabas I. The endoplasmic reticulum is the site of cholesterol‐induced cytotoxicity in macrophages. Nat Cell Biol. 2003; 5:781-792 [DOI] [PubMed] [Google Scholar]
- 8.Newby AC. Metalloproteinase expression in monocytes and macrophages and its relationship to atherosclerotic plaque instability. Arterioscler Thromb Vasc Biol. 2008; 28:2108-2114 [DOI] [PubMed] [Google Scholar]
- 9.Wilson KM, McCaw RB, Leo L, Arning E, Lhotak S, Bottiglieri T, Austin RC, Lentz SR. Prothrombotic effects of hyperhomocysteinemia and hypercholesterolemia in ApoE‐deficient mice. Arterioscler Thromb Vasc Biol. 2007; 27:233-240 [DOI] [PubMed] [Google Scholar]
- 10.Mackman N, Taubman M. Tissue factor: past, present, and future. Arterioscler Thromb Vasc Biol. 2009; 29:1986-1988 [DOI] [PMC free article] [PubMed] [Google Scholar]
- 11.Liu J, Thewke DP, Su YR, Linton MF, Fazio S, Sinensky MS. Reduced macrophage apoptosis is associated with accelerated atherosclerosis in low‐density lipoprotein receptor‐null mice. Arterioscler Thromb Vasc Biol. 2005; 25:174-179 [DOI] [PMC free article] [PubMed] [Google Scholar]
- 12.Boesten LS, Zadelaar AS, van Nieuwkoop A, Hu L, Jonkers J, van de Water B, Gijbels MJ, van der Made I, de Winther MP, Havekes LM, van Vlijmen BJ. Macrophage retinoblastoma deficiency leads to enhanced atherosclerosis development in ApoE‐deficient mice. FASEB J. 2006; 20:953-955 [DOI] [PubMed] [Google Scholar]
- 13.Park CG, Lee SY, Kandala G, Choi Y. A novel gene product that couples TCR signaling to Fas(CD95) expression in activation‐induced cell death. Immunity. 1996; 4:583-591 [DOI] [PubMed] [Google Scholar]
- 14.Joo JH, Liao G, Collins JB, Grissom SF, Jetten AM. Farnesol‐induced apoptosis in human lung carcinoma cells is coupled to the endoplasmic reticulum stress response. Cancer Res. 2007; 67:7929-7936 [DOI] [PubMed] [Google Scholar]
- 15.Hossain GS, van Thienen JV, Werstuck GH, Zhou J, Sood SK, Dickhout JG, de Koning AB, Tang D, Wu D, Falk E, Poddar R, Jacobsen DW, Zhang K, Kaufman RJ, Austin RC. TDAG51 is induced by homocysteine, promotes detachment‐mediated programmed cell death, and contributes to the development of atherosclerosis in hyperhomocysteinemia. J Biol Chem. 2003; 278:30317-30327 [DOI] [PubMed] [Google Scholar]
- 16.Dickhout JG, Hossain GS, Pozza LM, Zhou J, Lhotak S, Austin RC. Peroxynitrite causes endoplasmic reticulum stress and apoptosis in human vascular endothelium: implications in atherogenesis. Arterioscler Thromb Vasc Biol. 2005; 25:2623-2629 [DOI] [PubMed] [Google Scholar]
- 17.Neef R, Kuske MA, Prols E, Johnson JP. Identification of the human PHLDA1/TDAG51 gene: down‐regulation in metastatic melanoma contributes to apoptosis resistance and growth deregulation. Cancer Res. 2002; 62:5920-5929 [PubMed] [Google Scholar]
- 18.Basseri S, Lhotak S, Fullerton MD, Palanivel R, Jiang H, Lynn EG, Ford RJ, Maclean KN, Steinberg GR, Austin RC. Loss of TDAG51 results in mature‐onset obesity, hepatic steatosis, and insulin resistance by regulating lipogenesis. Diabetes. 2013; 62:158-169 [DOI] [PMC free article] [PubMed] [Google Scholar]
- 19.Dai G, Kaazempur‐Mofrad MR, Natarajan S, Zhang Y, Vaughn S, Blackman BR, Kamm RD, Garcia‐Cardena G, Gimbrone MA., Jr Distinct endothelial phenotypes evoked by arterial waveforms derived from atherosclerosis‐susceptible and ‐resistant regions of human vasculature. Proc Natl Acad Sci USA. 2004; 101:14871-14876 [DOI] [PMC free article] [PubMed] [Google Scholar]
- 20.Rho J, Gong S, Kim N, Choi Y. TDAG51 is not essential for Fas/CD95 regulation and apoptosis in vivo. Mol Cell Biol. 2001; 21:8365-8370 [DOI] [PMC free article] [PubMed] [Google Scholar]
- 21.Zhang SH, Reddick RL, Piedrahita JA, Maeda N. Spontaneous hypercholesterolemia and arterial lesions in mice lacking apolipoprotein E. Science. 1992; 258:468-471 [DOI] [PubMed] [Google Scholar]
- 22.Li AC, Brown KK, Silvestre MJ, Willson TM, Palinski W, Glass CK. Peroxisome proliferator‐activated receptor gamma ligands inhibit development of atherosclerosis in LDL receptor‐deficient mice. J Clin Invest. 2000; 106:523-531 [DOI] [PMC free article] [PubMed] [Google Scholar]
- 23.Kyaw T, Tay C, Hosseini H, Kanellakis P, Gadowski T, MacKay F, Tipping P, Bobik A, Toh BH. Depletion of B2 but not B1a B cells in BAFF receptor‐deficient ApoE mice attenuates atherosclerosis by potently ameliorating arterial inflammation. PLoS ONE. 2012; 7:e29371. [DOI] [PMC free article] [PubMed] [Google Scholar]
- 24.Marelli‐Berg FM, Peek E, Lidington EA, Stauss HJ, Lechler RI. Isolation of endothelial cells from murine tissue. J Immunol Methods. 2000; 244:205-215 [DOI] [PubMed] [Google Scholar]
- 25.Bligh EG, Dyer WJ. A rapid method of total lipid extraction and purification. Can J Biochem Physiol. 1959; 37:911-917 [DOI] [PubMed] [Google Scholar]
- 26.Makowski L, Brittingham KC, Reynolds JM, Suttles J, Hotamisligil GS. The fatty acid‐binding protein, aP2, coordinates macrophage cholesterol trafficking and inflammatory activity. Macrophage expression of aP2 impacts peroxisome proliferator‐activated receptor gamma and IkappaB kinase activities. J Biol Chem. 2005; 280:12888-12895 [DOI] [PMC free article] [PubMed] [Google Scholar]
- 27.Rigotti A, Trigatti BL, Penman M, Rayburn H, Herz J, Krieger M. A targeted mutation in the murine gene encoding the high density lipoprotein (HDL) receptor scavenger receptor class B type I reveals its key role in HDL metabolism. Proc Natl Acad Sci USA. 1997; 94:12610-12615 [DOI] [PMC free article] [PubMed] [Google Scholar]
- 28.Zhou J, Moller J, Danielsen CC, Bentzon J, Ravn HB, Austin RC, Falk E. Dietary supplementation with methionine and homocysteine promotes early atherosclerosis but not plaque rupture in ApoE‐deficient mice. Arterioscler Thromb Vasc Biol. 2001; 21:1470-1476 [DOI] [PubMed] [Google Scholar]
- 29.Lhotak S, Zhou J, Austin RC. Immunohistochemical detection of the unfolded protein response in atherosclerotic plaques. Methods Enzymol. 2011; 489:23-46 [DOI] [PubMed] [Google Scholar]
- 30.Wellcome Trust Case Control Consortium Genome‐wide association study of 14,000 cases of seven common diseases and 3,000 shared controls. Nature. 2007; 447:661-678 [DOI] [PMC free article] [PubMed] [Google Scholar]
- 31.Shiffman D, Kane JP, Louie JZ, Arellano AR, Ross DA, Catanese JJ, Malloy MJ, Ellis SG, Devlin JJ. Analysis of 17,576 potentially functional SNPs in three case‐control studies of myocardial infarction. PLoS ONE. 2008; 3:e2895. [DOI] [PMC free article] [PubMed] [Google Scholar]
- 32.Surwit RS, Kuhn CM, Cochrane C, McCubbin JA, Feinglos MN. Diet‐induced type II diabetes in C57BL/6J mice. Diabetes. 1988; 37:1163-1167 [DOI] [PubMed] [Google Scholar]
- 33.Libby P, Ridker PM, Hansson GKLeducq Transatlantic Network on Atherothrombosis Inflammation in atherosclerosis: from pathophysiology to practice. J Am Coll Cardiol. 2009; 54:2129-2138 [DOI] [PMC free article] [PubMed] [Google Scholar]
- 34.Hayashida N, Inouye S, Fujimoto M, Tanaka Y, Izu H, Takaki E, Ichikawa H, Rho J, Nakai A. A novel HSF1‐mediated death pathway that is suppressed by heat shock proteins. EMBO J. 2006; 25:4773-4783 [DOI] [PMC free article] [PubMed] [Google Scholar]
- 35.Erbay E, Babaev VR, Mayers JR, Makowski L, Charles KN, Snitow ME, Fazio S, Wiest MM, Watkins SM, Linton MF, Hotamisligil GS. Reducing endoplasmic reticulum stress through a macrophage lipid chaperone alleviates atherosclerosis. Nat Med. 2009; 15:1383-1391 [DOI] [PMC free article] [PubMed] [Google Scholar]
- 36.Tontonoz P, Nagy L, Alvarez JG, Thomazy VA, Evans RM. PPARgamma promotes monocyte/macrophage differentiation and uptake of oxidized LDL. Cell. 1998; 93:241-252 [DOI] [PubMed] [Google Scholar]
- 37.Chawla A, Boisvert WA, Lee CH, Laffitte BA, Barak Y, Joseph SB, Liao D, Nagy L, Edwards PA, Curtiss LK, Evans RM, Tontonoz P. A PPAR gamma‐LXR‐ABCA1 pathway in macrophages is involved in cholesterol efflux and atherogenesis. Mol Cell. 2001; 7:161-171 [DOI] [PubMed] [Google Scholar]
- 38.Chinetti G, Lestavel S, Bocher V, Remaley AT, Neve B, Torra IP, Teissier E, Minnich A, Jaye M, Duverger N, Brewer HB, Fruchart JC, Clavey V, Staels B. PPAR‐alpha and PPAR‐gamma activators induce cholesterol removal from human macrophage foam cells through stimulation of the ABCA1 pathway. Nat Med. 2001; 7:53-58 [DOI] [PubMed] [Google Scholar]
- 39.Li AC, Binder CJ, Gutierrez A, Brown KK, Plotkin CR, Pattison JW, Valledor AF, Davis RA, Willson TM, Witztum JL, Palinski W, Glass CK. Differential inhibition of macrophage foam‐cell formation and atherosclerosis in mice by PPARalpha, beta/delta, and gamma. J Clin Invest. 2004; 114:1564-1576 [DOI] [PMC free article] [PubMed] [Google Scholar]
- 40.Lim MJ, Chae HZ, Rhee SG, Yu DY, Lee KK, Yeom YI. The type II peroxiredoxin gene family of the mouse: molecular structure, expression and evolution. Gene. 1998; 216:197-205 [DOI] [PubMed] [Google Scholar]
- 41.Kisucka J, Chauhan AK, Patten IS, Yesilaltay A, Neumann C, Van Etten RA, Krieger M, Wagner DD. Peroxiredoxin1 prevents excessive endothelial activation and early atherosclerosis. Circ Res. 2008; 103:598-605 [DOI] [PMC free article] [PubMed] [Google Scholar]
- 42.Zhou J, Werstuck GH, Lhotak S, de Koning AB, Sood SK, Hossain GS, Moller J, Ritskes‐Hoitinga M, Falk E, Dayal S, Lentz SR, Austin RC. Association of multiple cellular stress pathways with accelerated atherosclerosis in hyperhomocysteinemic apolipoprotein E‐deficient mice. Circulation. 2004; 110:207-213 [DOI] [PubMed] [Google Scholar]
- 43.Tabas I. The role of endoplasmic reticulum stress in the progression of atherosclerosis. Circ Res. 2010; 107:839-850 [DOI] [PMC free article] [PubMed] [Google Scholar]
- 44.Conway JP, Kinter M. Dual role of peroxiredoxin I in macrophage‐derived foam cells. J Biol Chem. 2006; 281:27991-28001 [DOI] [PubMed] [Google Scholar]
- 45.Schreibelt G, van Horssen J, Haseloff RF, Reijerkerk A, van der Pol SM, Nieuwenhuizen O, Krause E, Blasig IE, Dijkstra CD, Ronken E, de Vries HE. Protective effects of peroxiredoxin‐1 at the injured blood‐brain barrier. Free Radic Biol Med. 2008; 45:256-264 [DOI] [PubMed] [Google Scholar]
- 46.Merched AJ, Williams E, Chan L. Macrophage‐specific p53 expression plays a crucial role in atherosclerosis development and plaque remodeling. Arterioscler Thromb Vasc Biol. 2003; 23:1608-1614 [DOI] [PubMed] [Google Scholar]
- 47.Arai S, Shelton JM, Chen M, Bradley MN, Castrillo A, Bookout AL, Mak PA, Edwards PA, Mangelsdorf DJ, Tontonoz P, Miyazaki T. A role for the apoptosis inhibitory factor AIM/Spalpha/Api6 in atherosclerosis development. Cell Metab. 2005; 1:201-213 [DOI] [PubMed] [Google Scholar]
- 48.Chung SS, Kim M, Youn BS, Lee NS, Park JW, Lee IK, Lee YS, Kim JB, Cho YM, Lee HK, Park KS. Glutathione peroxidase 3 mediates the antioxidant effect of peroxisome proliferator‐activated receptor gamma in human skeletal muscle cells. Mol Cell Biol. 2009; 29:20-30 [DOI] [PMC free article] [PubMed] [Google Scholar]
- 49.Itoh K, Mochizuki M, Ishii Y, Ishii T, Shibata T, Kawamoto Y, Kelly V, Sekizawa K, Uchida K, Yamamoto M. Transcription factor NRF2 regulates inflammation by mediating the effect of 15‐deoxy‐delta(12,14)‐prostaglandin J(2). Mol Cell Biol. 2004; 24:36-45 [DOI] [PMC free article] [PubMed] [Google Scholar]
- 50.Collins AR, Meehan WP, Kintscher U, Jackson S, Wakino S, Noh G, Palinski W, Hsueh WA, Law RE. Troglitazone inhibits formation of early atherosclerotic lesions in diabetic and nondiabetic low density lipoprotein receptor‐deficient mice. Arterioscler Thromb Vasc Biol. 2001; 21:365-371 [DOI] [PubMed] [Google Scholar]
- 51.Chen Z, Ishibashi S, Perrey S, Osuga J, Gotoda T, Kitamine T, Tamura Y, Okazaki H, Yahagi N, Iizuka Y, Shionoiri F, Ohashi K, Harada K, Shimano H, Nagai R, Yamada N. Troglitazone inhibits atherosclerosis in apolipoprotein E‐knockout mice: pleiotropic effects on CD36 expression and hdl. Arterioscler Thromb Vasc Biol. 2001; 21:372-377 [DOI] [PubMed] [Google Scholar]
- 52.Babaev VR, Yancey PG, Ryzhov SV, Kon V, Breyer MD, Magnuson MA, Fazio S, Linton MF. Conditional knockout of macrophage PPARgamma increases atherosclerosis in C57BL/6 and low‐density lipoprotein receptor‐deficient mice. Arterioscler Thromb Vasc Biol. 2005; 25:1647-1653 [DOI] [PubMed] [Google Scholar]
- 53.Nissen SE, Wolski K. Effect of rosiglitazone on the risk of myocardial infarction and death from cardiovascular causes. N Engl J Med. 2007; 356:2457-2471 [DOI] [PubMed] [Google Scholar]
- 54.Loke YK, Kwok CS, Singh S. Comparative cardiovascular effects of thiazolidinediones: systematic review and meta‐analysis of observational studies. BMJ. 2011; 342:d1309. [DOI] [PMC free article] [PubMed] [Google Scholar]
- 55.Diamond GA, Bax L, Kaul S. Uncertain effects of rosiglitazone on the risk for myocardial infarction and cardiovascular death. Ann Intern Med. 2007; 147:578-581 [DOI] [PubMed] [Google Scholar]
- 56.Dormandy J, Bhattacharya M, van Troostenburg de Bruyn ARPROactive investigators Safety and tolerability of pioglitazone in high‐risk patients with type 2 diabetes: an overview of data from proactive. Drug Saf. 2009; 32:187-202 [DOI] [PubMed] [Google Scholar]
- 57.Schunkert H, Konig IR, Kathiresan S, Reilly MP, Assimes TL, Holm H, Preuss M, Stewart AF, Barbalic M, Gieger C, Absher D, Aherrahrou Z, Allayee H, Altshuler D, Anand SS, Andersen K, Anderson JL, Ardissino D, Ball SG, Balmforth AJ, Barnes TA, Becker DM, Becker LC, Berger K, Bis JC, Boekholdt SM, Boerwinkle E, Braund PS, Brown MJ, Burnett MS, Buysschaert I, Cardiogenics. Carlquist JF, Chen L, Cichon S, Codd V, Davies RW, Dedoussis G, Dehghan A, Demissie S, Devaney JM, Diemert P, Do R, Doering A, Eifert S, Mokhtari NE, Ellis SG, Elosua R, Engert JC, Epstein SE, de Faire U, Fischer M, Folsom AR, Freyer J, Gigante B, Girelli D, Gretarsdottir S, Gudnason V, Gulcher JR, Halperin E, Hammond N, Hazen SL, Hofman A, Horne BD, Illig T, Iribarren C, Jones GT, Jukema JW, Kaiser MA, Kaplan LM, Kastelein JJ, Khaw KT, Knowles JW, Kolovou G, Kong A, Laaksonen R, Lambrechts D, Leander K, Lettre G, Li M, Lieb W, Loley C, Lotery AJ, Mannucci PM, Maouche S, Martinelli N, McKeown PP, Meisinger C, Meitinger T, Melander O, Merlini PA, Mooser V, Morgan T, Muhleisen TW, Muhlestein JB, Munzel T, Musunuru K, Nahrstaedt J, Nelson CP, Nothen MM, Olivieri O, Patel RS, Patterson CC, Peters A, Peyvandi F, Qu L, Quyyumi AA, Rader DJ, Rallidis LS, Rice C, Rosendaal FR, Rubin D, Salomaa V, Sampietro ML, Sandhu MS, Schadt E, Schafer A, Schillert A, Schreiber S, Schrezenmeir J, Schwartz SM, Siscovick DS, Sivananthan M, Sivapalaratnam S, Smith A, Smith TB, Snoep JD, Soranzo N, Spertus JA, Stark K, Stirrups K, Stoll M, Tang WH, Tennstedt S, Thorgeirsson G, Thorleifsson G, Tomaszewski M, Uitterlinden AG, van Rij AM, Voight BF, Wareham NJ, Wells GA, Wichmann HE, Wild PS, Willenborg C, Witteman JC, Wright BJ, Ye S, Zeller T, Ziegler A, Cambien F, Goodall AH, Cupples LA, Quertermous T, Marz W, Hengstenberg C, Blankenberg S, Ouwehand WH, Hall AS, Deloukas P, Thompson JR, Stefansson K, Roberts R, Thorsteinsdottir U, O'Donnell CJ, McPherson R, Erdmann J, CARDIoGRAM Consortium. Samani NJ. Large‐scale association analysis identifies 13 new susceptibility loci for coronary artery disease. Nat Genet. 2011; 43:333-338 [DOI] [PMC free article] [PubMed] [Google Scholar]
- 58.Coronary Artery Disease Genetics Consortium A genome‐wide association study in Europeans and South Asians identifies five new loci for coronary artery disease. Nat Genet. 2011; 43:339-344 [DOI] [PubMed] [Google Scholar]


