

Abstract
Objectives. We determined whether racial/ethnic disparities existed in coverage by type of 100% smoke-free private workplace, restaurant, and bar laws from 2000 to 2009.
Methods. We combined US census population data and the American Nonsmokers’ Rights Foundation US Tobacco Control Database to calculate the percentage of individuals in counties covered by each type of law by race/ethnicity from 2000 to 2009.
Results. More of the US Hispanic and Asian populations were covered by 100% smoke-free restaurant and bar laws than non-Hispanic White and non-Hispanic Black populations. Asian coverage by smoke-free bars laws increased from 36% to 75%, and Hispanic coverage increased from 31% to 62%, compared with 6% to 41% for non-Hispanic Blacks and 8% to 49% for non-Hispanic Whites.
Conclusions. Hispanics and Asians benefited more from the rapid spread of smoke-free law coverage, whereas non-Hispanic Blacks benefited less. These ethnic disparities suggest a likely effect of geographic region and may provide a basis for more effective, community-based, and tailored policy-related interventions, particularly regarding areas with high concentrations of non-Hispanic Blacks.
Secondhand smoke causes disease, including lung cancer, heart disease, and breast cancer.1–3 Implementation of strong smoke-free laws is followed by drops in hospital admissions for heart attacks4–8 and decreased smoking prevalence.9 Regional studies have suggested that the implementation of clean indoor air and tobacco control policies is not evenly distributed across the United States; communities with high education and income are more likely to adopt 100% smoke-free laws than communities with lower education and income; disparities also exist by race/ethnicity.10–14 In Massachusetts, areas with large minority populations were less likely to have smoke-free laws,12 whereas in Texas large minority urban areas were more likely to have smoke-free coverage.13 Blue-collar and service workers were less likely to be covered by smoke-free laws than white-collar workers.15–17
Although several investigators have studied the effects of smoke-free laws at a national level, there have been important limitations in how coverage was assessed. Some studies relied only on state laws,18–20 despite the fact that states with weak or no state laws often have strong local laws. Other studies relied on individual survey responses about law coverage, such as the initial outcomes index that measures clean indoor air laws in incorporated places (such as towns) that is combined with a state-level aggregate of individual responses regarding smoke-free coverage from the Tobacco Use Supplement to the Current Population Survey.21–23 Some studies have not considered the fact that some county laws cover incorporated areas inside the county,24 and other studies have not considered subcounty coverage at all.25
In states in which county laws apply only to unincorporated areas in the county, the incorporated areas (cities or towns that function as administrative units that provide “governmental functions for a concentration of people”26) can pass laws. Assuming that county laws apply everywhere in these counties introduces 2 kinds of misclassification errors: (1) if a county law exists but does not cover incorporated areas, the number of people covered by the law will be overstated, and (2) if no county law exists, but laws in incorporated cities do, the number of people covered by the law will be underestimated. Because population is not evenly distributed across counties but often clustered in cities and towns, reliance on county-level laws can miss large, subcounty population clusters. For example, the largest city in Alabama, Birmingham, has a 100% smoke-free law, but neither the State of Alabama nor Jefferson County (which includes Birmingham) have 100% smoke-free laws. Thus, relying on the county law would completely miss coverage for the largest city in the state.
Measures of policy coverage have varied in earlier studies. For example, in 1 study respondent zip code was used as a means of determining respondent location and thus subcounty clean indoor air law coverage. (This level of geocode information is usually available only for privately funded data sets.27) Two studies have accounted for subcounty law coverage by using the existence of a city-level law as a proxy for county coverage (in these cases, the publicly funded data sets only included county-level geocodes).28,29 Other studies accounted for subcounty smoke-free law coverage by calculating the percentage of individuals in a county covered by clean indoor air laws30,31 using state laws and local ordinances in the single years of 199232 or 200733; none accounted for changes in population over time.
METHODS
We examined disparities in coverage of smoke-free laws by race/ethnicity in the United States from 2000 to 2009. To overcome the limitations of previous measures of coverage, we estimated the probability of an individual being covered by a smoke-free law in any US county, taking into account the presence of state, county, and local laws and whether county laws covered incorporated areas, and used the resulting measure to calculate the total number of non-Hispanic Whites, non-Hispanic Blacks, Asians, and Hispanics (all races) covered by a 100% smoke-free law in the United States from 2000 to 2009.
Percentage of a County Covered by 100% Smoke-Free Laws
We combined 2 data sets—the Cities and Towns: Vintage 2009 All States, All Geographies34 data file and the American Nonsmokers’ Rights Foundation US Tobacco Control Database35—to calculate the percentage of county population covered by 100% smoke-free private workplace, restaurant, and bar laws.
Census Estimated Population Data.
The census-estimated population (CEP) Cities and Towns: Vintage 2009 All States, All Geographies (cities and towns), data34 provide population estimates (as of July 1 each year) for all census-designated places within the United States from 2000 to 2009, except for Indian reservations and tribal-owned land. This data file contains population estimates for every incorporated place or incorporated place part within a county and for the balance of the county (the remaining area not within the boundary of an incorporated place, which is commonly referred to as the unincorporated area of a county).
American Nonsmokers’ Rights Foundation United States Tobacco Control Database.
The American Nonsmokers’ Rights Foundation (ANRF) database is a compilation of tobacco control ordinances, bylaws, and board of health regulations.35 ANRF has defined a 100% smoke-free law as one that prohibits smoking indoors without exception (i.e., no-smoking rooms or venue-size exceptions). ANRF analysts code each law by its strength, including whether it made an area 100% smoke-free. (The supplemental online appendix contains details of the coding scheme.) This distinction is applied if the law covers all nongovernmental workplaces (private workplaces), restaurants, and bars within the jurisdiction.
We used the ANRF data to create 3 data sets, 1 for each of the 3 venues (workplace, restaurant, bar). We used state laws, county laws and their jurisdiction (all or just unincorporated county area), and subcounty laws to create a record for each month and year the law was in effect, starting with the month the law took effect. We then merged this data set with the appropriate locality-level data from the CEP cities and towns data by geocode and year for each venue.
We accounted for whether minor civil divisions, a type of subcounty locality, could function as legal entities to pass smoke-free laws. Minor civil divisions may be incorporated or unincorporated areas that may be affected by county-level laws differently. Using the merged data set, we calculated the total number of individuals covered by subcounty smoke-free laws in incorporated and unincorporated areas for each county. We then combined the results of this calculation with our state law database to calculate the total number of individuals covered by 100% smoke-free laws by county, using the algorithms in Table 1. We divided the results by the total county population to obtain a number between 0 and 1, which estimates the proportion of the county population covered by a smoke-free law for (1) each of the 3 venues and (2) all 3 venues.
TABLE 1—
Algorithm for Calculating Ratio of Individuals Within a County Covered by a 100% Smoke-Free Law: United States, 2000–2009
| Law Type | Calculation |
| 100% smoke-free state law | Population covered = (total county population) |
| 100% smoke-free county law, with county jurisdiction for entire county area | Population covered = (total county population) |
| 100% smoke-free county law, with county jurisdiction limited to unincorporated areas only | Population covered = (unincorporated county population covered) + (incorporated population covered by a subcounty law) |
| No 100% state or county law | Population covered = (incorporated population covered by a subcounty law) + (unincorporated population covered by a subcounty law) |
Percentage of a Race/Ethnicity Covered by 100% Smoke-Free Laws
The CEP cities and towns data file does not provide age, sex, and race estimates for census-designated places; these estimates are only available at the county level in the CEP County Characteristics: Vintage 2009 Sex, Race, and Hispanic Origin (county characteristics) database. We used the CEP data file titled “6 race group, 5 race alone and one multiple race”36 to estimate racial/ethnic coverage in a way that most closely matched racial/ethnic categories in the 2000 and 2010 censuses. We extracted the total number of non-Hispanic Whites only, non-Hispanic Blacks, Asians only, and Hispanics (all races) per county from this file. We did not calculate the number of non-Hispanic Native American/Alaska Natives because data were not available to determine whether they were located on a reservation where laws could significantly differ from those of surrounding counties.
To obtain the total number of individuals within each of the 3 racial groups covered by 100% smoke-free laws within each county, we computed
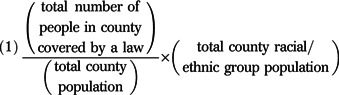 |
for each of the 3 ethnic/racial groups for (1) each of the 3 law venues and (2) all 3 venues. We then summed the total number of non-Hispanic Whites, non-Hispanic Blacks, Asians, and Hispanics in the United States covered by 100% smoke-free workplace, restaurant, and bar laws for all counties in the CEP cities and towns data file.
RESULTS
The total US population covered by 100% smoke-free restaurant, bar, and private workplace laws increased between 2000 and 2009, with more people covered by restaurant laws than by workplace or bar laws (Figure 1). In 2000, more of the population was covered by 100% smoke-free restaurant and bar laws (13% and 12%, respectively) than by 100% smoke-free private workplace laws (3%). By 2009, the proportions of people covered by smoke-free restaurant, bar, and workplace laws reached 63%, 52%, and 54%, respectively. These changes represent an absolute increase of 50% for restaurants, 40% for bars, and 51% for private workplaces. Coverage by smoke-free policies increased over time for all venues and racial/ethnic groups. A larger proportion of Asians and Hispanics than non-Hispanic Whites and non-Hispanic Blacks were covered by restaurant and bar laws (Figure 2).
FIGURE 1—

Percentage of population covered by a 100% smoke-free law by race/ethnicity for (a) private workplaces, (b) restaurants, and (c) bars: United States, 2000–2009.
Note. NH = non-Hispanic. Results are based on July of each year.
FIGURE 2—

Percentage of population covered by a 100% smoke-free law by race/ethnicity for all 3 venues (workplaces, restaurants, and bars): United States, 2000–2009.
Note. NH = non-Hispanic. Results are based on July of each year.
In part because of the initial coverage patterns, non-Hispanic Whites experienced the greatest increase in coverage, and Hispanics experienced the least (Figure 2). In 2000, 31% of Hispanics were covered by both smoke-free restaurant and smoke-free bar laws, which increased to 74% for restaurants and 62% for bars in 2009. Coverage for Asians increased from 37% for restaurants and 36% for bars in 2000 to 81% and 75%, respectively, in 2009. Non-Hispanic Blacks enjoyed less coverage than non-Hispanic Whites and Hispanics, with 54% of non-Hispanic Blacks being covered by a restaurant law and 41% being covered by a bar law in 2009 (an increase from 6% for both laws in 2000).
The proportion of the population covered by 100% smoke-free workplace, restaurant, and bar laws increased dramatically between 2000 and 2009, from less than 1% to 36% for the general population, with Asians most likely to be covered by comprehensive laws covering all 3 venues (Figure 2).
DISCUSSION
Although 100% smoke-free law coverage increased across the total US population from 2000 to 2009, more individuals were covered by 100% smoke-free restaurant laws than by 100% smoke-free bar or workplace laws, probably because passing restaurant laws has been easier than passing bar laws.37 We found substantial differences in 100% smoke-free restaurant and bar law coverage, with Asians and Hispanics having higher coverage than others. Although we also found differences in coverage for workplace laws, they were not as disparate as restaurant and bar laws.
The geographic distribution of laws likely explains our different findings for smoke-free coverage by racial/ethnic status for restaurant and bar laws, which helps to explain disparate findings in earlier studies. These studies showed that in Texas, cities with minority populations were more likely to be covered, whereas in Massachusetts, areas with more minority populations were less likely to be covered.12,13 In 2000, the majority of Hispanics in the United States lived in the West, Southwest, and New York,38 which were early adopters of strong smoke-free laws.35 Likewise, in 2000, 75% of all individuals who identified themselves as Asian lived in 10 states (California, New York, Hawaii, Texas, New Jersey, Illinois, Washington, Florida, Virginia, and Massachusetts). In 2000, a large proportion of Asians (34% of the total US population) and Hispanics (34% of the total US population) lived in California. California has had statewide 100% smoke-free restaurant and bar laws since 1998, but not an exemption-free 100% state workplace law, although many cities and counties have passed such laws.33,38,39 Conversely, in 2000 most non-Hispanic Blacks lived in the South (where many tobacco-growing states are located) and in some Midwestern states such as Michigan and Illinois,40 where fewer 100% smoke-free laws existed in the first half of the decade. By incorporating measures of subcounty coverage, researchers will be able to more accurately capture disparities in policy coverage.
Limitations
We described a longitudinal analysis in which county-level tobacco smoke-free laws were aggregated up from local laws and down from state laws. The advantage of this procedure is that levels of jurisdiction that are likely to pass a law (such as a city or county) are accounted for in the results. Our calculations assumed that racial/ethnic groups were evenly distributed across each county. However, the demographic distribution of people by race would be better accounted for by a zip code–level analysis as opposed to a county-level analysis aggregated up from local and down from state data. In addition, the CEP data do not include Indian reservations and tribal-owned land, thus these results cannot be generalized to people living in these geographic locations.
Conclusions
Although 100% smoke-free law coverage has significantly increased in the overall US population and as of 2012 more than half of US states have passed smoke-free laws, our findings suggest that a larger proportion of Hispanics are covered by restaurant and bar laws, whereas non-Hispanic Blacks had historically lower coverage throughout 2000–2009. These findings are significant because they suggest that non-Hispanic Blacks benefited less from the rapid spread of smoke-free law coverage that occurred within this period. This result is most likely related to the distribution of the non-Hispanic Black population within the United States. Disparities in smoke-free law coverage may be decreasing because of progress in passing smoke-free laws in regions with large non-Hispanic Black populations: Florida implemented 100% smoke-free laws (workplaces, restaurants, and gaming establishments) in 2003, Louisiana (workplaces and restaurants) and Illinois (workplaces, restaurants, bars, and gaming establishments) in 2007, and North Carolina (restaurants and bars) and Michigan (workplaces, restaurants, and bars) in 2010.33,41,42
Understanding the distribution of tobacco-related risks to nonsmokers by minority status is particularly important because smoke-free laws reduce secondhand smoke exposure in the general population, leaving the possibility that poor smoke-free law coverage may further endanger the health of a vulnerable population. This information may provide a basis for more effective, community-based, and tailored policy-related interventions, particularly regarding areas with high concentrations of non-Hispanic Blacks.
Acknowledgments
This research was supported by the National Cancer Institute (CA-113710, CA-61021) and the California Tobacco Related Disease Research Program (20FT-0077).
Human Participant Protection
No human subjects protection was required.
References
- 1.US Department of Health and Human Services Health Consequences of Involuntary Exposure to Tobacco Smoke: A Report of the Surgeon General. Atlanta, GA: US Department of Health and Human Services, Centers for Disease Control and Prevention; 2006 [Google Scholar]
- 2.US Department of Health and Human Services How Tobacco Smoke Causes Disease: The Biology and Behavioral Basis for Smoking-Attributable Disease: A Report of the Surgeon General. Atlanta, GA: US Department of Health and Human Services, Centers for Disease Control and Prevention; 2010 [Google Scholar]
- 3. California Environmental Protection Agency, Office of Environmental Health Hazard Assessment, California Air Resources Board. Proposed Identification of Environmental Tobacco Smoke as a Toxic Air Contaminant. Part B: Health Effects. Sacramento, CA: California Environmental Protection Agency, Office of Environmental Health Hazard Assessment, Air Toxicology and Epidemiology Branch; 2005.
- 4.Lightwood JM, Glantz SA. Declines in acute myocardial infarction after smoke-free laws and individual risk attributable to secondhand smoke. Circulation. 2009;120(14):1373–1379 [DOI] [PMC free article] [PubMed] [Google Scholar]
- 5.Meyers DG, Neuberger JS, He J. Cardiovascular effect of bans on smoking in public places: a systematic review and meta-analysis. J Am Coll Cardiol. 2009;54(14):1249–1255 [DOI] [PubMed] [Google Scholar]
- 6.Hahn EJ. Smokefree legislation: a review of health and economic outcomes research. Am J Prev Med. 2010;39(6):S66–S76 [DOI] [PubMed] [Google Scholar]
- 7.Tan C, Glantz S. Association between implementation of smoke-free legislation and hospitalizations for cardiac, cerebrovascular, and respiratory diseases: a meta-analysis. Circulation. 2012;126:2177–2183 [DOI] [PMC free article] [PubMed] [Google Scholar]
- 8.Institute of Medicine Secondhand Smoke Exposure and Cardiovascular Effects: Making Sense of the Evidence. Washington, DC: National Academies Press; 2010 [PubMed] [Google Scholar]
- 9.Hopkins DP, Razi S, Leeks KD, Priya Kalra G, Chattopadhyay SK, Soler RE. Smokefree policies to reduce tobacco use: a systematic review. Am J Prev Med. 2010;38(2):S275–S289 [DOI] [PubMed] [Google Scholar]
- 10.Bartosch WJ, Pope GC. Local restaurant smoking policy enactment in Massachusetts. J Public Health Manag Pract. 1999;5(1):63–73 [DOI] [PubMed] [Google Scholar]
- 11.Skeer M, George S, Hamilton W, Cheng D, Siegel M. Town-level characteristics and smoking policy adoption in Massachusetts: are local restaurant smoking regulations fostering disparities in health protection? Am J Public Health. 2004;94(2):286–292 [DOI] [PMC free article] [PubMed] [Google Scholar]
- 12.Deverell M, Randolph C, Albers A, Hamilton W, Siegel M. Diffusion of local restaurant smoking regulations in Massachusetts: identifying disparities in health protection of population subgroups. J Public Health Manag Pract. 2006;12(3):262–269 [DOI] [PubMed] [Google Scholar]
- 13.Gingiss PM, Boerm M, Huang P, Hermer L. Smoke-free ordinances in Texas worksites, restaurants, and bars, 2000-2007. Am J Prev Med. 2009;36(2):91–95 [DOI] [PubMed] [Google Scholar]
- 14.Ferketich AK, Liber A, Pennell M, Nealy D, Hammer J, Berman M. Clean indoor air ordinance coverage in the Appalachian region of the United States. Am J Public Health. 2010;100(7):1313–1318 [DOI] [PMC free article] [PubMed] [Google Scholar]
- 15.Arheart KL, Lee DJ, Dietz NAet al. Declining trends in serum cotinine levels in US worker groups: the power of policy. J Occup Environ Med. 2008;50(1):57–63 [DOI] [PubMed] [Google Scholar]
- 16.Gerlach KK, Shopland DR, Hartman AM, Gibson JT, Pechacek TF. Workplace smoking policies in the United States: results from a national survey of more than 100,000 workers. Tob Control. 1997;6(3):199–206 [DOI] [PMC free article] [PubMed] [Google Scholar]
- 17.Shopland DR, Anderson CM, Burns DM, Gerlach KK. Disparities in smoke-free workplace policies among food service workers. J Occup Environ Med. 2004;46(4):347–356 [DOI] [PubMed] [Google Scholar]
- 18.Tauras JA, Chaloupka FJ, Farrelly MCet al. State tobacco control spending and youth smoking. Am J Public Health. 2005;95(2):338–344 [DOI] [PMC free article] [PubMed] [Google Scholar]
- 19.Givel M. Punctuated equilibrium in limbo: The tobacco lobby and U.S. state policymaking from 1990 to 2003. Policy Stud J. 2006;34(3):405–415 [Google Scholar]
- 20.Jemal A, Thun M, Yu XQet al. Changes in smoking prevalence among U.S. adults by state and region: Estimates from the Tobacco Use Supplement to the Current Population Survey, 1992-2007. BMC Public Health. 2011;11:512. [DOI] [PMC free article] [PubMed] [Google Scholar]
- 21.Bandiera FC, Caban-Martinez AJ, Arheart KLet al. Secondhand smoke policy and the risk of depression. Ann Behav Med. 2010;39(2):198–203 [DOI] [PMC free article] [PubMed] [Google Scholar]
- 22.Pierce JP, White MM, Messer K. Changing age-specific patterns of cigarette consumption in the United States, 1992-2002: association with smoke-free homes and state-level tobacco control activity. Nicotine Tob Res. 2009;11(2):171–177 [DOI] [PMC free article] [PubMed] [Google Scholar]
- 23.Jemal A, Cokkinides VE, Shafey O, Thun MJ. Lung cancer trends in young adults: an early indicator of progress in tobacco control (United States). Cancer Causes Control. 2003;14(6):579–585 [DOI] [PubMed] [Google Scholar]
- 24.Shetty KD, DeLeire T, White C, Bhattacharya J. Changes in U.S. hospitalization and mortality rates following smoking bans. J Policy Anal Manage. 2010;30(1):6–28 [DOI] [PubMed] [Google Scholar]
- 25.Dove MS, Dockery DW, Connolly GN. Smoke-free air laws and asthma prevalence, symptoms, and severity among nonsmoking youth. Pediatrics. 2011;127(1):102–109 [DOI] [PMC free article] [PubMed] [Google Scholar]
- 26. US Census Bureau, Geography Division. Geographic terms and concepts—place. Available at: http://www.census.gov/geo/www/2010census/gtc/gtc_place.html. Published February 11, 2011. Accessed February 28, 2012.
- 27.Wakefield MA, Chaloupka FJ, Kaufman NJ, Orleans CT, Barker DC, Ruel EE. Effect of restrictions on smoking at home, at school, and in public places on teenage smoking: cross sectional study. BMJ. 2000;321(7257):333–337 [DOI] [PMC free article] [PubMed] [Google Scholar]
- 28.Dinno A, Glantz S. Tobacco control policies are egalitarian: a vulnerabilities perspective on clean indoor air laws, cigarette prices, and tobacco use disparities volume. Soc Sci Med. 2009;68(8):1439–1447 [DOI] [PMC free article] [PubMed] [Google Scholar]
- 29.Cheng KW, Glantz SA, Lightwood JM. Association between smokefree laws and voluntary smokefree-home rules. Am J Prev Med. 2011;41(6):566–572 [DOI] [PMC free article] [PubMed] [Google Scholar]
- 30.Chaloupka FJ, Pacula RL. Sex and race differences in young people’s responsiveness to price and tobacco control policies. Tob Control. 1999;8(4):373–377 [DOI] [PMC free article] [PubMed] [Google Scholar]
- 31.Chaloupka FJ, Grossman M. Price, Tobacco Control Policies and Youth Smoking. National Bureau of Economic Research Working Paper No. 5740 Cambridge, MA: National Bureau of Economic Research;1996 [Google Scholar]
- 32.National Cancer Institute Major Local Tobacco Control Ordinances in the United States. Monograph 3 Bethesda, MD: US Department of Health and Human Services, Public Health Service, National Institutes of Health; 1993 [Google Scholar]
- 33. American Nonsmokers’ Rights Foundation. Summary of 100% Smokefree State Laws and Population Protected by 100% U.S. Smokefree Laws. Available at: http://no-smoke.org/pdf/SummaryUSPopList.pdf. Published January 2, 2012. Accessed March 12, 2012.
- 34.U.S. Census Bureau Population Division City and Town Totals: Vintage 2009 All States, All Geography. Washington, DC: US Census Bureau; 2010 [Google Scholar]
- 35.US Tobacco Control Laws Database Berkeley, CA: American Nonsmokers Rights Foundation; 2010 [Google Scholar]
- 36.US Census Bureau, Population Division County Characteristics: Vintage 2009 Sex, Race, and Hispanic Origin. Washington, DC: US Census Bureau; 2010 [Google Scholar]
- 37.Dearlove JV, Bialous SA, Glantz SA. Tobacco industry manipulation of the hospitality industry to maintain smoking in public places. Tob Control. 2002;11(2):94–104 [DOI] [PMC free article] [PubMed] [Google Scholar]
- 38.Guzmán B. The Hispanic Population: Census 2000 Brief. Washington, DC: US Department of Commerce, Economics and Statistics Administration, US Census Bureau; 2001 [Google Scholar]
- 39.Barnes JS, Bennett CE. The Asian Population: Census 2000 Brief. Washington, DC: US Department of Commerce, Economics and Statistics Administration, US Census Bureau; 2002 [Google Scholar]
- 40.McKinnon J. The Black Population: Census 2000 Brief. Washington, DC: US Department of Commerce, Economics and Statistics Administration, US Census Bureau; 2001 [Google Scholar]
- 41.Kennedy A, Sullivan S, Hendlin Y, Barnes RL, Glantz SA. Tobacco Control in Florida 1999-2011: The Good, the Bad, and the Ugly. San Francisco, CA: Center for Tobacco Control Research and Education, University of California; 2011 [Google Scholar]
- 42.Sullivan S, Barnes RL, Glantz SA. Shifting Attitudes Towards Tobacco Control in Tobacco Country: Tobacco Industry Political Influence and Tobacco Policy Making in South Carolina. San Francisco, CA: Center for Tobacco Control Research and Education, University of California; 2011 [Google Scholar]