

Abstract
Tuberculosis (TB) surveillance among the homeless is not supported by the political will necessary for TB elimination. We merged the first stakeholder-accepted enumeration of homeless persons with existing surveillance data to assess TB risk among the homeless in Houston, Texas. The average incidence per 100 000 was 411 among homeless and 9.5 among housed persons. The homeless were more likely than the housed to be US-born, clustered, and in a larger-sized cluster. Multivariate analysis revealed that TB rates among the homeless were driven not by comorbidities but by social determinants. Homeless patients were hospitalized more days than the housed and required more follow-up time. Reporting of TB rates for populations with known health disparities could help reframe TB prevention and better target limited funds.
“We watch in wonder as life expectancy and good health continue to increase in parts of the world and in alarm as they fail to improve in others.”
—World Health Organization report on health equity1(p3)
Nineteenth-century surgeon George Bodington described tuberculosis (TB) as “a disease found amongst the lower classes of society.”2(pi) The disparity is most pronounced in a comparison of the 1999 to 2000 TB incidence in the United States (4.8/100 000 population)3 with the reported TB incidence in the 22 highest-burden countries (40–400/100 000).4 However, higher rates among the homeless could lead to a resurgence of TB in the United States.
TB infection is the result of exposure to the bacterium Mycobacterium tuberculosis, most often transmitted through airborne droplet nuclei (particles measuring 1–5 μm in diameter).5 Once acquired, TB infection can be either quiescent and categorized as latent or active and contagious. Individuals with active pulmonary disease who are infected with M. tuberculosis and are sputum smear positive are the most infectious and can transmit disease through activities such as coughing, singing, and talking.6 Tracing of TB transmission is possible through isolation and molecular characterization, which provide a fingerprint of the microorganism similar to a human fingerprint. Cases are termed clustered when 2 or more matching fingerprints are identified. Clustered cases are suspected to have a shared transmission risk factor.
TB incidence in the United States decreased yearly from 1995 to 2004 and reached 4.9 cases per 100 000 population in 2004.7 This was preceded by a resurgence of TB in 1992, which correlated with decreased funding for TB control programs and the emergence of HIV.8 As a result of the resurgence, public health efforts were redirected and included prevention strategies such as housing for persons who were HIV infected.9 Housing was not provided for the HIV negative, however, and the annual proportion of TB cases among the homeless remained steady.10
US-born homeless persons share many risk factors for TB dissemination with individuals who live in the 22 countries the World Health Organization has identified as having a high TB burden.11 Similar risk factors among these geographically distinct groups are a history of poverty, immune-deregulating substance abuse and poor nutrition, challenged sleep patterns, and increased exposure to public places through their reliance on communal travel and living.12,13 These populations live under the stress of the unknown, with limited access to basic necessities. In the United States, the lack of housing for the homeless has been attributed to the country’s current economic state,14,15 mental illness,16–18 substance abuse,16,17,19 and a lack of affordable housing resulting from gentrification and urban renewal.15,20 Politically recognizing homeless populations through a published and stakeholder-accepted count has been a social achievement most city and national leaders have been unable to accomplish. The enumerations performed at the national level during the 1990 Census were widely rejected by homeless stakeholders,21 and the count from the 2000 Census was never publicly released by the Census Bureau.22 The official explanation for withholding the count was that homeless advocates and stakeholders strongly opposed the count methods and results.21,22
In 2004, officials in Houston, Texas, determined that enumeration of the homeless was needed for policy development and planning purposes.16 Fueling the support for a yearly homeless count separate from the census were hurricanes Katrina in August 2005 and Rita in September 2005. In addition, a homeless count would allow for more accurate financial projections needed by the mayor and other city officials,16 because in Houston, the most frequently cited reason for homelessness is loss of a job.16,23 Both homeless stakeholders and governmental officials accepted the reported counts, and we used them to analyze TB risk among homeless persons in Houston from 1995 to 2004. With denominator data (enumeration), we were able to calculate the rate of TB disease among this high-risk population. TB incidence among the homeless would no longer have to be reported as a proportion of all TB cases, but could be reported as the more intuitive risk of TB among the homeless.
METHODS
We conducted a retrospective study of a population-based surveillance project to calculate the incidence and kernel density of TB among housed and homeless persons and to examine the characteristics and TB risk factors associated with being homeless and diagnosed with TB while living in Houston and its surrounding Harris County from October 1995 to September 2004.
Study Population
The study population belonged to the Houston Tuberculosis Initiative (HTI) and was a subset of the 4312 TB cases in Houston during the HTI study period, 1995 to 2004. We confirmed all suspected TB cases with Centers for Disease Control and Prevention diagnostic guidelines by either clinical or laboratory methods. The HTI excluded persons who had resided in Houston for less than 3 months and were considered to be prevalent TB cases (n = 69), who refused to participate (n = 220), or who were unable to be located (n = 361). Social and philanthropic programs protect children from homelessness. Although children with TB are known to be indicative of recent transmission, we excluded persons younger than 18 years (n = 315) from our analysis because their risk of homelessness could not be assessed. We excluded 3 additional participants because they had missing or vague housing information. Our final sample size was 3344 (Figure 1).
FIGURE 1—
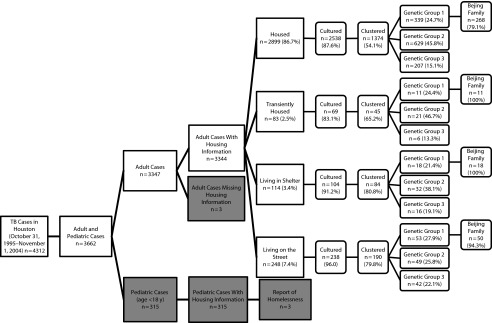
Study participant flowchart: Houston Tuberculosis Initiative, 1996–2003.
The HTI classified participants according to their reported history of homelessness 6 months prior to TB diagnosis. Participants (including couch surfers, persons staying temporarily in someone else's home) who self-reported living in a house, mobile home, or condominium with no report of living currently or in the previous 6 months in a shelter or on the street were considered housed. If individuals reported homelessness in the 6 months prior to diagnosis, we further categorized them as transient, sheltered, or on the street. We created these categories with data from both the HTI questionnaire and the 2005 Houston Homeless Enumeration Report 11. The definitions were (1) transient—self-reported currently living in a hotel, nursing home, mental facility, or correctional facility, with no report of living currently or in the previous 6 months in a shelter or on the street; (2) sheltered—self-reported living in a shelter, with no report of living currently or in the previous 6 months on the street; and (3) on the street—self-reported living on the street currently or in the previous 6 months.
Analyses
After participant or proxy consent, trained interviewers administered a standardized questionnaire in the participant’s language of choice (interviewers translated, and no one was excluded because of a language barrier). The questionnaire asked for demographic information (ethnicity, gender, foreign-born status, and age), social history (homelessness, incarceration, employment, education, etc.), behavioral history (smoking, alcohol, drug use, and sexual experiences), and personal medical history. We collected other medical history from medical charts and public health records. In addition, we molecularly characterized participants' isolates (when available) with internationally recognized methods.
We genetically grouped participants according to polymorphisms at codons 463 of the katG gene and 95 of the gyrA gene and further typed by insertion sequence (IS) 6110 restriction length polymorphism profiling. We spacer oligonucletide typed (spoligotyped) samples with fewer than 5 IS6110 copies.24,25 We considered only samples in the same genetic group (and where appropriate the same spoligotype) with identical IS6110 banding profiles to be clustered. Samples belonging to the Beijing family, a large family of clusters (prints) in Houston, all shared a spoligotype pattern, 000000000003771.
We calculated the frequencies of reported covariates for all 4 study groups (housed, n = 2899; transient, n = 83; sheltered, n = 114; and on the street, n = 248); these are shown in Table 1. We excluded from analysis independent variables with small sample sizes, such as Native American race (n = 1), or those with missing values (more than 15% of the HTI sample). We calculated χ2 values and their corresponding P values from contingency tables for each variable. We used multivariate and multinomial models to calculate odds ratios (ORs) and relative risk ratios (RRRs), respectively. We used a multinomial model to distinguish the relationships between the stratified levels of homelessness and TB disease. We analyzed all variables in the multivariate and multinomial models as dichotomous, except race and drug use, which were categorical, and age, which we modeled as continuous. We constructed multivariate and multinomial models with only variables known to be TB risk factors or any variable that affected the measured effect size by more than 10%. We used the measured effect size, its respective 95% confidence interval (CI), and the corresponding model stability to construct the models that would best explain the relationship between TB infection and homelessness. We considered P ≤ .05 to be statistically significant.
TABLE 1—
Overview of Study Population by Housing Status: Houston Tuberculosis Initiative, 1995–2004
| Homeless |
||||||
| Variable | Total Sample (n = 3344), No. (%) | Housed (n = 2899), No. (%) | Transient (n = 83), No. (%) | Sheltered (n = 114), No. (%) | On the Street (n = 248), No. (%) | |
| Demographic characteristics | ||||||
| Gender | ||||||
| Male | 2308 (69.0) | 1904 (65.7) | 65 (78.3) | 99 (86.8) | 240 (96.8) | |
| Female | 1036 (31.0) | 995 (34.3) | 18 (21.7) | 15 (13.2) | 8 (3.2) | |
| Race | ||||||
| Black | 1303 (39.1) | 1064 (36.9) | 40 (48.2) | 68 (59.7) | 131 (53.0) | |
| White | 550 (16.5) | 410 (14.2) | 24 (28.9) | 36 (31.6) | 80 (32.4) | |
| Hispanic | 1037 (31.1) | 983 (34.1) | 13 (15.7) | 9 (7.9) | 32 (13.0) | |
| Asian | 440 (13.2) | 429 (14.9) | 6 (7.2) | 1 (0.9) | 4 (1.6) | |
| Age, y | ||||||
| < 20 | 51 (1.5) | 51 (1.76) | 0 | 0 | 0 | |
| 20–29 | 520 (15.6) | 501 (17.3) | 4 (4.8) | 9 (7.9) | 6 (2.4) | |
| 30–39 | 764 (22.9) | 665 (22.9) | 21 (25.3) | 30 (26.3) | 48 (19.4) | |
| 40–49 | 857 (25.6) | 680 (23.5) | 27 (32.5) | 42 (36.8) | 108 (43.6) | |
| 50–59 | 558 (16.7) | 447 (15.4) | 15 (18.1) | 28 (24.6) | 68 (27.4) | |
| ≥ 60 | 594 (17.8) | 555 (19.1) | 16 (19.3) | 5 (4.4) | 18 (7.3) | |
| Risk factors | ||||||
| Foreign-born | 1292 (38.6) | 1248 (43.1) | 13 (15.7) | 10 (8.8) | 21 (8.5) | |
| Drug use | 1210 (36.2) | 910 (31.4) | 45 (54.2) | 83 (72.8) | 172 (69.4) | |
| Alcohol use | 1221 (36.5) | 923 (31.8) | 49 (59.0) | 67 (58.8) | 182 (73.4) | |
| Smoking | 2132 (63.8) | 1739 (60.0) | 68 (81.9) | 97 (85.1) | 228 (91.9) | |
| History of incarceration | 1615 (48.3) | 1237 (42.7) | 60 (72.3) | 99 (86.8) | 219 (88.3) | |
| Transactional sex | 290 (8.7) | 195 (6.7) | 9 (10.8) | 29 (25.4) | 57 (23.0) | |
| Never married | 2215 (66.2) | 1805 (62.3) | 73 (88.0) | 104 (91.2) | 233 (94.0) | |
| Bus rider | 1169 (35.0) | 879 (30.3) | 34 (41.0) | 81 (71.1) | 175 (70.6) | |
| Work in a labor pool | 383 (11.5) | 191 (6.6) | 17 (20.5) | 49 (43.0) | 126 (50.8) | |
| HIV positive | 608 (18.2) | 501 (17.3) | 22 (26.5) | 33 (29.0) | 52 (21.0) | |
| Military service | 600 (17.9) | 455 (15.7) | 24 (28.9) | 35 (30.7) | 86 (34.7) | |
| Frequent church visits | 541 (16.2) | 474 (16.4) | 4 (4.8) | 24 (21.1) | 39 (15.7) | |
| Disease attributes | ||||||
| Pulmonary | 2796 (83.6) | 2386 (82.3) | 68 (81.9) | 104 (91.2) | 238 (96.0) | |
| Previous TB history | 264 (7.9) | 206 (7.1) | 7 (8.4) | 14 (12.3) | 37 (14.9) | |
| Cough | 2493 (74.6) | 2131 (73.5) | 58 (69.9) | 94 (82.5) | 210 (84.7) | |
| Fever | 2008 (60.1) | 1723 (59.4) | 50 (60.2) | 79 (69.3) | 156 (62.9) | |
| Smear positive | 1461 (43.7) | 1231 (42.5) | 36 (43.4) | 57 (50.0) | 137 (55.2) | |
| Received DOT | 2794 (83.5) | 2418 (83.4) | 61 (73.5) | 105 (92.1) | 210 (84.7) | |
| Molecular characteristics | ||||||
| Clustered | 1693 (50.6) | 1374 (47.4) | 45 (54.2) | 84 (73.7) | 190 (76.6) | |
| Group 1 | 742 (22.2) | 646 (22.3) | 17 (20.5) | 20 (17.5) | 59 (23.8) | |
| Group 2 | 1254 (37.5) | 1120 (38.6) | 29 (34.9) | 37 (32.5) | 68 (27.4) | |
| Group 3 | 409 (12.2) | 334 (11.5) | 10 (12.1) | 19 (16.7) | 46 (18.6) | |
| Beijing family | 572 (17.1) | 446 (15.4) | 17 (20.5) | 28 (24.6) | 81 (32.7) | |
| Genotypic cluster p1 | 148 (4.4) | 98 (3.4) | 4 (4.8) | 10 (8.8) | 36 (14.5) | |
| Genotypic cluster p3 | 81 (2.4) | 44 (1.5) | 3 (3.6) | 6 (5.3) | 28 (11.3) | |
| Genotypic cluster p33 | 79 (2.4) | 60 (2.1) | 3 (3.6) | 4 (3.5) | 12 (4.8) | |
| Genotypic cluster p16 | 41 (1.2) | 20 (0.7) | 5 (6.0) | 6 (5.3) | 10 (4.0) | |
| Genotypic cluster p22 | 23 (0.7) | 12 (0.4) | 3 (3.6) | 3 (2.6) | 5 (2.0) | |
| Genotypic cluster p242 | 16 (0.5) | 0 | 2 (2.4) | 4 (3.5) | 10 (4.0) | |
Note. DOT = directly observed therapy; TB = tuberculosis.
Homeless persons, Black persons, those who have been incarcerated, and drug users are all at an increased risk for HIV and therefore have an increased risk for TB.22 HIV is a known risk factor for TB and the single greatest risk factor for progression from quiescent TB infection to active disease.21 To control for potential confounding, we derived adjusted ORs after controlling for the interaction between HIV and TB. Other potential confounders we statistically assessed were Black race,19,26,27 age, income less than $10 000,16,28 foreign birth,29,30 male gender, incarceration, and substance abuse.31–34 Dichotomous variables coded in the data set as categorical (yes, no, or unknown) we recoded as yes or no, moving the unknown to missing where appropriate. We measured all proportions, accounting for any missing values present in the variable.
We derived crude rates of TB incidence for each study year in the housed and homeless.35 We used the January 2005 homeless enumeration as a denominator to calculate incidence among the homeless. This homeless enumeration was the first widely accepted homeless count and was the result of a systematic approach to the census to ensure a total count of all homeless persons. City officials organized 3 research teams, engaged stakeholders and current or previously homeless persons, and sought to identify and count every homeless individual. The final enumeration was completed on a January night and was the result of several different preliminary counts conducted to locate all homeless persons by correctly identifying all encampments, shelters, crack houses, bridges, and other forms of shelter used by the Houston homeless. The first count identified 12 005 homeless persons, the most ever in Houston. In addition to the count, 2200 homeless persons were surveyed and their responses were used to generate a demographic profile of Houston’s homeless.16
For our analysis, we also used the 2000 Census data as a denominator.36 This census was a total count of all housed persons in the United States and was an appropriate denominator for the housed population because the decennial census data were widely accepted by stakeholders and were used during the HTI study period as the basis for calculating the level of aid awarded to care for the disenfranchised and for the distribution of other funding dollars. The 2000 Census was also conducted in the middle of our study period. We calculated category-specific TB rates for the housed and homeless TB cases by gender, race, and age.36 For the homeless, we calculated directly adjusted rates from the published counts from the 2005 homeless enumeration.16 For the housed, we directly adjusted crude rates from the Harris County counts from the 2000 US Census.37
For geospatial analysis, we geocoded all participants’ addresses and mapped them by point and by census tract. Data from the 2000 US Census provided census tract population counts, from which we calculated TB incidence per tract. We used first-order statistics to find spatial orientation and the distribution of TB cases for each year. We used second-order statistics to identify locations of high concentration of TB cases, and we compared maps among each year between 1995 and 2004. We performed all analyses with Stata version 9.0 (StataCorp LP, College Station, TX), Microsoft Excel 2007 (Microsoft Corp, Redmond, WA), and ArcView and Spatial Analyst version 9.3.1 (ESRI, Redlands, CA).
RESULTS
Harris County is made up of 649 census tracts,36 which are served by 2 health departments: Harris County Public Health and Environmental Services and the Houston Department of Health and Human Services. The yearly rate of TB during the study period reported by the county department ranged from 11.9 to 25.6 and by the city from 15.8 to 38.4 per 100 000 population.26 These rates were more than double the rates for the United States and nearly double the rate for Texas for every study year. The average rate of TB was 9.5 among housed persons and 411 among homeless persons per 100 000 (Figure 2).
FIGURE 2—

Impact of housing status on tuberculosis (TB) incidence, by year: Houston Tuberculosis Initiative, 1996–2003.
Regardless of their housing status, HTI study participants were more likely to be male (69%), Black (39%), US-born (61%), and older than 40 years (62%; Table 1). Most had a household income of more than $10 000 (58%), were HIV negative (82%), and reported alcohol use (36.5%). One third reported weekly bus riding. Participants had pulmonary TB disease (83.0%), received directly observed therapy (83%), and reported common TB symptoms of cough (75%), night sweats (54%), weight loss (62%) and fever (60%) upon presentation. The most common TB comorbid conditions were diabetes mellitus (16%), HIV infection (18%), and liver disease (18%).
Molecular characterization showed that among HTI participants, 51% belonged to a cluster with a majority of members belonging to genetic group 2 (52%) and print group 1 (p1; n = 148).38 A history of homelessness was reported by 17.5% (n = 588) of study participants, and 13% (n = 445) reported being homeless in the 6 months prior to diagnosis. Of those reporting homelessness, 18.7% were transiently homeless, 26% were sheltered within 6 months of their TB diagnosis, and 54% reported living on the street within 6 months of TB diagnosis. Among respondents reporting homelessness, 54% were Black, 31% were White, 57% reported daily alcohol use, and 24% were HIV infected. The average age for the homeless was 46 years. This racial profile differed from the demographics reported overall for the Houston homeless: 65% Black and 22% White.16
We detected genotypic clusters among 71% of homeless and 47% of housed respondents (P < .01). The size of the clusters increased linearly from the transient to the on-the-street groups (Figure 3a). Univariate analysis revealed that homeless participants were more likely than housed participants to belong to the Beijing family and specifically to the p3, p22, p24, and p33 clusters. Multinomial analysis comparing stratified levels of homelessness confirmed that belonging to the p3, p16, or p22 cluster of the Beijing family was significantly associated with homelessness (P < .01; Figure 1, Tables 1 and 2) Belonging to p1 was significantly associated with living on the street (P < .05). Furthermore, spatial analysis of groups p1 and p3 revealed geographic clustering of cases and geographic clustering of p3 by bus ridership among both homeless and housed respondents.
FIGURE 3—
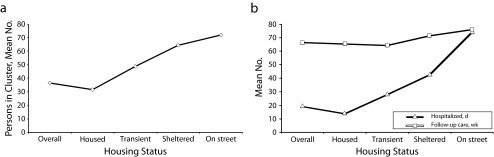
Impact of housing status on tuberculosis by (a) number of persons per cluster and (b) health care burden: Houston Tuberculosis Initiative, 1995–2004.
TABLE 2—
Risk Factors Associated With Being Homeless and Diagnosed With Tuberculosis: Houston Tuberculosis Initiative, 1995–2004
| Multivariate Model |
Multinomial Model |
|||
| Variable | All Homeless, OR (95% CI; P) | Transient Homeless, RRR (95% CI; P) | Sheltered Homeless, RRR (95% CI; P) | On the Street Homeless, RRR (95% CI; P) |
| Gender male | 2.68 (1.69, 4.23; < .01) | 0.97 (0.46, 2.04; .93) | 2.03 (0.96, 4.27; .06) | 7.44 (3.24, 17.05; < .01) |
| White race | 1.86 (1.34, 2.58; < .01) | 1.61 (0.73, 3.13; .16) | 1.81 (1.05, 3.09; .03) | 2.07 (1.39, 3.09; < .01) |
| Age | 1.00 (0.99, 1.02; .56) | 1.02 (1.00, 1.04; .06) | 1.00 (0.98, 1.02; .89) | 1.00 (0.98, 1.01; .6) |
| Foreign-born | 0.84 (0.46, 2.67; .56) | 0.83 (0.26, 2.63; .75) | 1.15 (0.36, 3.69; .82) | 0.74 (0.35, 1.58; .44) |
| Injection drug use | 2.18 (1.45, 3.28; < .01) | 2.60 (1.20, 5.66; .02) | 2.65 (1.29, 5.45; .01) | 1.95 (1.17, 3.24; .01) |
| Noninjection drug use | 1.57 (1.11, 2.22; .01) | 1.08 (0.51, 2.27; .84) | 2.09 (1.10, 3.96; .02) | 1.53 (0.99, 2.37; .05) |
| Daily alcohol use | 1.40 (1.06, 1.83; .02) | 1.47 (0.83, 2.61; .19) | 0.85 (0.53, 1.35; .49) | 1.77 (1.25, 2.50; < .01) |
| Transactional sex | 1.84 (1.29, 2.64; < .01) | 0.67 (0.25, 1.77; .41) | 2.26 (1.31, 3.90; < .01) | 2.12 (1.38, 3.26; < .01) |
| Frequent bus rider | 2.57 (1.94, 3.39; < .01) | 1.11 (0.63, 1.96; .73) | 3.49 (2.09, 5.82; < .01) | 3.07 (2.15, 4.37; < .01) |
| Military service | 1.69 (1.23, 2.31; < .01) | 1.60 (0.85, 3.02; .14) | 1.56 (0.90, 2.72; .12) | 1.82 (1.25, 2.66; < .01) |
| History of incarceration | 2.67 (1.79, 3.97; < .01) | 2.85 (1.29, 6.31; .01) | 3.02 (1.36, 6.66; < .01) | 2.58 (1.52, 4.38; < .01) |
| Unemployed | 1.62 (1.22, 2.15; < .01) | 1.21 (0.68, 2.17; .51) | 1.73 (1.05, 2.86; .03) | 1.74 (1.22, 2.48; < .01) |
| HIV positive | 0.69 (0.19, 0.96; .03) | 0.92 (0.46, 1.85; .81) | 0.77 (0.45, 1.32; .34) | 0.58 (0.38, 0.90; .01) |
| Pulmonary TB | 1.60 (0.93, 2.76; .09) | 0.72 (0.32, 1.60; .41) | 2.25 (0.78, 6.51; .13) | 2.43 (1.06, 5.57; .04) |
| Genotypic cluster p1 | 2.60 (1.68, 4.01; < .01) | 1.44 (0.48, 4.26; .52) | 1.93 (0.91, 4.11; .09) | 3.33 (2.00, 5.52; < .01) |
| Genotypic cluster p3 | 5.73 (3.31, 9.92; < .01) | 3.09 (0.88, 10.89; .08) | 3.04 (1.15, 8.04; .03) | 9.16 (4.88, 17.19; < .01) |
| Genotypic cluster p33 | 1.81 (0.97, 3.39; .06) | 2.08 (0.60, 7.18; .25) | 1.37 (0.45, 4.17; .58) | 1.97 (0.92, 4.24; .08) |
| Genotypic cluster p16 | 5.25 (2.52, 10.91; < .01) | 9.60 (3.18, 28.96; < .01) | 4.50 (1.50, 13.57; < .01) | 4.46 (1.79, 11.09; < .01) |
| Genotypic cluster p22 | 5.75 (2.15, 15.39; < .01) | 9.31 (2.22, 38.87; < .01) | 5.46 (1.30, 22.93; .02) | 4.58 (1.37, 15.31; .01) |
| Genotypic cluster p24 | 1.52 (0.56, 4.11; .41) | 1.49 (0.18, 12.68; .71) | 0.55 (0.07, 4.61; z59) | 2.14 (0.71, 6.50; .18) |
Note. CI = confidence interval; OR = odds ratio; RRR = relative risk ratio; TB = tuberculosis. Associations were determined through univariate, multivariate, and multinomial logistic regression; P ≤ .05 was considered significant.
Multivariate and Multinomial Analysis
After univariate and multivariate analysis, we found that being White, male, unmarried, or unemployed; reporting a history of military service; engaging in transactional sex; riding the bus; reporting a history of incarceration or injection or noninjection drug use; and belonging to genotypic clusters p1, p3, p16, p22, or p33 all remained positively associated with homelessness (OR > 1.4). The homeless were less likely than those with stable housing to be HIV infected (OR = 0.69; Table 2).
Multinomial analysis allowed for a more detailed look into the varied levels of homelessness and showed that the homeless in all categories were more likely than the housed to report a history of incarceration (RRR > 2.6) or injection drug use (RRR > 1.9) and to belong to genotypic clusters p3, p16, or p22 (RRR > 3.0; Table 2). Transient respondents differed from the sheltered and on-the-street populations in that they were not more likely than housed respondents to be male or White, nor were the transient homeless at an increased risk for noninjection drug use, unemployment, transactional sex, riding the bus, or daily alcohol use. Sheltered participants were more likely to be White (RRR = 1.81) and to report frequent bus riding; they also had the highest risk of noninjection drug use among all homeless respondents (RRR = 2.09; Table 2). Participants who were on the street were more likely than other homeless persons to report drug use, daily alcohol use, military service, a history of incarceration, and transactional sex (Table 2). They were 7.4 times as likely as the housed to be male, twice as likely to be White, 3 times as likely to frequently use public transportation, and 9 times as likely to belong to a print group shown after multivariate analysis to be associated with bus ridership (unpublished data).
Tuberculosis Incidence
Our analysis of the 2005 enumeration of the Houston homeless population (n = 12 005)16 showed that the interpolated yearly TB disease incidence varied from 267 to 575 per 100 000 population over the 9-year study period. We confirmed these homeless rates geographically by calculating incidence with census tract population data and geographic information system tools and found census tract–specific incidences of 174 to 252 per 100 000 population. Density mapping of TB cases by housed, homeless, and transient subgroups revealed a maximum of 54 cases per census tract for the HTI study period. The application of kernel density smoothing revealed a maximum of 57 homeless persons with TB per square mile. These values are equal to those seen in TB-endemic countries and are 2 to 5 times as high as the reported incidence in HIV-positive persons.
Directly adjusting the crude TB rates revealed further details regarding TB among the homeless. For instance, directly adjusting for race showed that Whites carried a disproportionate burden of TB among the homeless. The TB incidence among homeless Whites was 10 times the TB incidence among homeless Blacks. Over the study period, the adjusted rate among homeless Whites was 452 per 100 000 population and ranged from 203 to 639 per 100 000 over the individual study years. In the adjusted study period, homeless Blacks had an incidence of 61.7 per 100 000 persons, with a range of 40 to 80 per 100 000 persons for the individual study years. Direct adjustments for age and gender revealed a disproportionate burden of TB among homeless men (housed, 16.7 vs homeless, 355.3/100 000 population). Among the housed, TB incidence age adjustments were consistent with the average TB rate in all groups, except for respondents aged 60 years and older in the early HTI study years.
In the homeless, age adjustments did not account for the difference in incidences across age groups. The age adjustments suggested clustering of cases by age group and study year. Additional direct adjustments of crude rates for age, race, and gender indicated a potential unknown outbreak among White homeless men aged 50 to 60 years. These adjustments did not eliminate the sharp increase in TB incidence among the homeless in 2003 (Figure 2). Further analysis with epidemic curves for print groups revealed the sharp increase in unsheltered homeless respondents with the p3 genotype during 2003.
In addition to the increased rate of TB clustering and transmission among the homeless, the mean number of days hospitalized and follow-up time required was 4 times as high among unsheltered as sheltered homeless persons. An important finding was the increasing trend for care required as stability of housing decreased (13.6 days for the housed to > 70 days for unsheltered homeless persons; Figure 3b).
DISCUSSION
Homelessness has begun to be recognized as an economic and social issue relevant to society as a whole.16 However, TB surveillance among the homeless lacks the national political support needed for TB elimination. The homeless interact with the general population in public settings such as churches, transit systems, and corner stores. They represent a plausible source for inner-city transmission of TB across socially diverse populations, as shown in cities such as New York, New York; San Francisco, California; and Budapest, Hungary.10,39,40 Nutritional deficiencies, substance abuse, the absence of restful sleep and safety are all additional risk factors that impair immune function and place any individual at an increased risk of infection.32,41–44 Homelessness has been shown among HIV-positive persons to interfere with therapies.43 Housing has a positive impact on infection and HIV outcomes, and differences in CD4 counts and viral loads have been found among housed and homeless HIV-positive persons.43,45 Such findings highlight the important impact that housing has on an individual, on the number of comorbidities, and therefore on societal cost, a finding that has been shown among HIV-negative persons as well.14,30,42 We found that participants with TB who lived on the street were less likely than housed participants to have HIV. The protective nature of HIV positivity for homelessness highlights the effectiveness of local housing programs for HIV-positive persons and warrants further exploration into housing solutions irrespective of HIV status.
We found an average TB incidence among the homeless that was 100 times the US reported rate of 4.9 cases per 100 000 population. The homeless were more likely than the housed to be US-born, clustered, and part of a larger-sized cluster. Molecular characterization of M. tuberculosis has proven useful in the identification of hundreds of unique isolates and has provided unprecedented geographic and genetic information.46–48 The number and size of genotypic clusters measured among housed HTI respondents were lower than for all participants combined, and the number of persons clustered among those on the street was more than double that in housed cases. Epidemic curves of the resulting print groups revealed a previously unreported probable outbreak among unsheltered homeless persons.
Homeless persons with TB were more likely to report weekly bus ridership. Buses and other forms of public transit have been shown to be means of TB transmission.49–56 In Houston, the public transit system runs like veins through the city, connecting affluent and economically disadvantaged neighborhoods, and can provide shelter to those lacking it on a hot summer day.57 Subsidized public transport is intended to help improve the lifestyle and access to care of those without private transportation. However, this enclosed shared air space is also a known mode of TB transmission, and protective measures are needed to filter contaminated air.
Stratified Levels of Homelessness
The homeless share many known demographic and lifestyle risk factors for TB infection, including substance abuse, HIV infection, poverty, older age, and lack of stable health care. We found that the 3 subpopulations of the homeless (transiently homeless, sheltered in a defined public shelter, and living on the street) each had added risk of TB transmission across economically diverse groups. The transiently homeless are mainly homeless because of poverty.58 This subpopulation is often part of the city’s workforce.59,60 Marginal incomes leave this population 1 financial hardship away from homelessness. The unsheltered are known to form encampments, some as large as 200 persons,16 and to congregate throughout the day. These individuals are chronically homeless, and in Houston most belong to the estimated 40% of the homeless who have been homeless for more than 3 years. Strong social networks exist among the chronically homeless, another proven risk factor for TB transmission.61
Multivariate and multinomial analysis revealed that homeless rates were driven not by comorbidities but by social determinants and that persons who lived on the street had the greatest TB risk. Homeless respondents were hospitalized more days and required more follow-up time than those who reported a steady housing situation. The homeless represent an example of the increased targeting of prevention dollars that could occur if TB rates were reported for specific populations with known health disparities rather than as a generalized rate normalized over a diverse population.
In the multinomial model, we stratified homelessness into 3 independent risk groups and compared each group with the base category of housed persons with TB. Stratification revealed inherent differences among this commonly grouped population. The finding that male gender and White race were significantly higher among the homeless has been previously reported.17,61–63 However, the finding that these demographic features did not apply to all homeless subpopulations is new. Prognostic variables were being older than 40 years, White race, alcohol use, alcohol detoxification, liver disease, drug use, bus ridership, and transactional sex. Among homeless individuals, male gender, being older than 40 years, and daily alcohol use were only significantly higher among individuals living on the street. This finding suggests that White men with TB are less likely to participate in housing and shelter systems, or it may reflect a preference given to women, children, and minorities. The relative risk for male gender of 6.4 revealed that a homeless woman was more likely than a homeless man to be sheltered or transiently housed.
Individuals on the street avoid the risk of transmission inherent in bunkhouses and shelters, but have an increased risk of TB infection with increased alcohol consumption, a known TB risk factor. HIV was the only variable that was significant in the multivariate analysis that had no significant effect in the comparison of homeless subpopulations with housed participants. Liver disease was only significant among sheltered persons, an indication that those on the street are likely not receiving adequate medical care. Other lifestyle risk factors that were not present in the transient group were drug use, frequent bus ridership, and transactional sex.
Limitations
The HTI was able to capture only 85% of all TB cases. We used both the 2000 census and the 2005 homeless count as denominators, and although both were total counts, neither count was yearly, which necessitated imputation for derived incidences. The 2005 count was, however, the largest homeless count to date, and so we believe that the estimates reported in this analysis (although alarming) are the most conservative possible.
Our findings are the result of systematic surveillance, making them specific to Houston and not nationally representative. More studies are needed to understand the burden of TB among other homeless populations within the United States.
Conclusions
Our results show that, although surveillance efforts have successfully reduced the TB burden in some populations, the homeless still bear a disproportionate burden of TB disease. The incidence found in the homeless is reflective of the TB rates found in the United States prior to industrialization.2 The high rates suggest that TB control efforts have failed to significantly address the TB epidemic among those who are most impoverished; they also indicate the important roles that politicians have in public health. Before 1993, information on homelessness, HIV, and other risk factors was not collected by the Centers for Disease Control and Prevention.62,63 In 2005, the first reports to describe the previous decade of TB surveillance among the homeless as a proportion of all TB cases were published.10,63 However, we still have no nationwide understanding of the TB risk among our homeless populations. TB outbreaks among homeless populations are socially and economically damaging.30,61,64,65 Outbreaks have been attributed to lack of health insurance14,65–68 and delay in seeking treatment14,20,30; they have also been associated with recurrent infection. 61
Like Houston, New York, San Francisco, and Budapest have all reported high TB burdens and particular strains among their homeless.10,39,40 New York’s strategies of screening, increased surveillance, ultraviolet technologies, and nutritional focus have thus far been effective in reducing the city's TB burden.39 Statistically relevant spatial analysis would augment current data collection and reporting techniques. The combination of these methods will at first no doubt cause political unrest because of the unsettlingly high rates of TB likely to be discovered, but they will also spur the political will necessary to bring change.
The societal cost of a high TB burden among the homeless extends beyond transmission to clinical outcomes. Homeless persons with TB had twice the mean hospital stay of all other TB patients, adding exponentially to the cost of TB care. TB costs in 1991 were estimated to be $2300 to $8000 for outpatient and $18 588 for inpatient care.64 A more recent cost analysis that included pulmonary impairment after TB and quality-adjusted life-years reports the societal cost per TB illness to be $376 255.63 Such high estimated costs and findings of increased transmission and hospitalization (Figure 3a and 3b) among the homeless warrant a reframing of our surveillance methods and reporting of TB risk among the homeless. Standard surveillance efforts must be funded to include resources such as geographic information system mapping, rapid assessment techniques, social network searches, and improved diagnostics for all homeless subpopulations.
Our data suggest that in addition to certain endemic strains, isolated populations also affect geographical TB rate differences. Furthermore, our findings show that TB rates in the United States are affected by poverty and that the TB organism may have found its US niche, surviving in a host that is invisible to society but that surrounds and intermingles with all members of that society. The Centers for Disease Control and Prevention’s approach to reporting of rates of TB in other at-risk populations, such as HIV-positive persons, has proven to be successful in curbing incidence. Our findings are particularly relevant during a national recession that is forcing many Americans to face homelessness for the first time.17,20,45 If the goal of TB elimination is to be realized, the surveillance approach must target all populations, regardless of race or HIV status, whose poverty, food insecurity, and other socially determined risk factors place them at a substantially higher risk for all infectious disease.
Acknowledgments
This research was supported in part by the National Institute on Drug Abuse (grant DA-0923) and the National Institute of Allergy and Infectious Disease (contract N01-AO-02738).
We thank all Houston and Harris County TB patients who participated in the HTI, along with the field staff and City of Houston Department of Health and Human Services, Bureau of TB Control contact investigators. Also a special thanks to Jan M. Risser and Keith Burau for their guidance and support.
Human Participant Protection
This study was approved by the Methodist Hospital Institute institutional review board.
References
- 1. Commission on Social Determinants of Health. Closing the Gap in a Generation: Health Equity Through Action on the Social Determinants of Health. Final Report on the Commission of Social Determinants of Health. Geneva, Switzerland: World Health Organization; 2008. Available at: http://www.who.int/social_determinants/thecommission/finalreport/en/index.html. Accessed January 13, 2010.
- 2.Bodington G. An Essay on the Treatment and Care of Pulmonary Consumption. London, UK: Longman, Orme, Brown, Green, and Longmans; Birmingham, 1890 [Google Scholar]
- 3.Bennett DE, Courval JM, Onorato Iet al. Prevalence of tuberculosis infection in the United States population: the National Health and Nutrition Examination Survey, 1999–2000. Am J Respir Crit Care Med. 2008;177(3):348–355 [DOI] [PubMed] [Google Scholar]
- 4.Global Tuberculosis Control: Surveillance, Planning, Financing. Geneva, Switzerland: World Health Organization; 2008 [Google Scholar]
- 5.Sepkowitz KA. How contagious is tuberculosis? Clin Infect Dis. 1996;23(5):954–962 [DOI] [PubMed] [Google Scholar]
- 6.Fennelly KP, Martyny JW, Fulton KE, Orme IM, Cave DM, Heifets LB. Cough-generated aerosols of Mycobacterium tuberculosis: a new method to study infectiousness. Am J Respir Crit Care Med. 2004;169(5):604–609 [DOI] [PubMed] [Google Scholar]
- 7.Centers for Disease Control and Prevention Tuberculosis morbidity—United States, 1995. MMWR Morb Mortal Wkly Rep. 1996;45(18):365–370 [PubMed] [Google Scholar]
- 8.Centers for Disease Control and Prevention Trends in tuberculosis—United States, 2004. MMWR Morb Mortal Wkly Rep. 2005;54(10):245–249 [PubMed] [Google Scholar]
- 9.Centers for Disease Control and Prevention Reported HIV status of tuberculosis patients—United States, 1993–2005. MMWR Morb Mortal Wkly Rep. 2007;56(42):1103–1106 [PubMed] [Google Scholar]
- 10.Haddad MB, Wilson TW, Ijaz K, Marks SM, Moore M. Tuberculosis and homelessness in the United States, 1994–2003. JAMA. 2005;293(22):2762–2766 [DOI] [PMC free article] [PubMed] [Google Scholar]
- 11. World Health Organization. Report 2007: Annex 1: profiles of high-burden countries. 2007. Available at: http://www.finddiagnostics.org/export/sites/default/me. Accessed March 15, 2009.
- 12.Craig GM, Booth H, Story Aet al. The impact of social factors on tuberculosis management. J Adv Nurs. 2007;58(5):418–424 [DOI] [PubMed] [Google Scholar]
- 13.Story A, Murad S, Roberts W, Verheyen M, Hayward AC, London Tuberculosis Nurses Network Tuberculosis in London: the importance of homelessness, problem drug use and prison. Thorax. 2007;62(8):667–671 [DOI] [PMC free article] [PubMed] [Google Scholar]
- 14.Kushel MB, Gupta R, Gee L, Haas JS. Housing instability and food insecurity as barriers to health care among low-income Americans. J Gen Intern Med. 2006;21(1):71–77 [DOI] [PMC free article] [PubMed] [Google Scholar]
- 15.Wolch JR, Dear M, Akita A. Explaining homelessness. J Am Plann Assoc. 1988;54(4):443–453 [Google Scholar]
- 16. Blue Ribbon Commission to End Chronic Homelessness. Coalition for the Homeless of Houston/Harris County. Houston/Harris County Enumeration/Needs Assessment. Available at: http://www.homelesshouston.org/images/hh/Documents/Downloads/Final%20Strategic%20Plan%20May%202006.pdf. Accessed November 11, 2010.
- 17. National Alliance to End Homelessness. United States Conference of Mayors report: hunger and homelessness up sharply in major U.S. cities. 2005. Available at: http://usmayors.org/hungersurvey/2005/HH2005FINAL.pdf. Accessed November 11, 2010.
- 18.Wright D, Sathe N, Spangnola K. State Estimates of Substance Use From the 2004–2005 National Survey on Drug Use and Health. Rockville, MD: Substance Abuse and Mental Health Services Administration, Office of Applied Studies; 2007 [Google Scholar]
- 19.Nyamathi A, Berg J, Jones T, Leake B. Predictors of perceived health status of tuberculosis-infected homeless. West J Nurs Res. 2005;27(7):896–910; discussion 911–914 [DOI] [PubMed] [Google Scholar]
- 20.Reid KW, Vittinghoff E, Kushel MB. Association between the level of housing instability, economic standing and health care access: a meta-regression. J Health Care Poor Underserved. 2008;19(4):1212–1228 [DOI] [PubMed] [Google Scholar]
- 21.Fact Sheet for the 1990 Decennial Census Count of Persons in Emergency Shelters for the Homeless and Visible in Street Locations. Washington, DC: Bureau of the Census; 1992 [Google Scholar]
- 22. Associated Press. Census Bureau sued over homeless count. New York Times. October 11, 1992. Available at: http://www.nytimes.com/1992/10/11/us/census-bureau-sued-over-homeless-count.html. Accessed April 11, 2009.
- 23.Miskel JF. Disaster Response and Homeland Security: What Works, What Doesn’t. Westport, CT: Praeger Security Internatinal; 2006 [Google Scholar]
- 24.Soini H, Pan X, Amin A, Graviss EA, Siddiqui A, Musser JM. Characterization of Mycobacterium tuberculosis isolates from patients in Houston, Texas, by spoligotyping. J Clin Microbiol. 2000;38(2):669–676 [DOI] [PMC free article] [PubMed] [Google Scholar]
- 25.Tanaka MM, Francis AR. Detecting emerging strains of tuberculosis by using spoligotypes. Proc Natl Acad Sci U S A. 2006;103(41):15266–15271 [DOI] [PMC free article] [PubMed] [Google Scholar]
- 26.Serpa JA, Teeter LD, Musser JM, Graviss EA. Tuberculosis disparity between US-born Blacks and Whites, Houston, Texas, USA. Emerg Infect Dis. 2009;15(6):899–904 [DOI] [PMC free article] [PubMed] [Google Scholar]
- 27.Toker-Blue H. Epidemiology of Mycobacterium Tuberculosis in Harris County [master's thesis]. Houston: University of Texas Health Science Center at Houston School of Public Health; 2004 [Google Scholar]
- 28.Munch Z, Van Lill SW, Booysen CN, Zietsman HL, Enarson DA, Beyers N. Tuberculosis transmission patterns in a high-incidence area: a spatial analysis. Int J Tuberc Lung Dis. 2003;7(3):271–277 [PubMed] [Google Scholar]
- 29.Taylor Z, Nolan CM, Blumberg HM, American Thoracic Society, Centers for Disease Control and Prevention, Infectious Diseases Society of America Controlling tuberculosis in the United States. Recommendations from the American Thoracic Society, CDC, and the Infectious Diseases Society of America. MMWR Recomm Rep. 2005;54(RR-12):1–81 [PubMed] [Google Scholar]
- 30.Bierman AS, Dunn JR. Swimming upstream. Access, health outcomes, and the social determinants of health. J Gen Intern Med. 2006;21(1):99–100 [DOI] [PMC free article] [PubMed] [Google Scholar]
- 31.Centers for Disease Control and Prevention Reported HIV status of tuberculosis patients—United States, 1993–2005. 2007;56(42):1103–1106 [PubMed] [Google Scholar]
- 32.Howard AA, Klein RS, Schoenbaum EE, Gourevitch MN. Crack cocaine use and other risk factors for tuberculin positivity in drug users. Clin Infect Dis. 2002;35(10):1183–1190 [DOI] [PubMed] [Google Scholar]
- 33.Kamholz SL. Resurgence of tuberculosis: the perspective a dozen years later. J Assoc Acad Minor Phys. 1996;7(3):83–86 [PubMed] [Google Scholar]
- 34.Perlman DC, Salomon N, Perkins MP, Yancovitz S, Paone D, Des Jarlais DC. Tuberculosis in drug users. Clin Infect Dis. 1995;21(5):1253–1264 [DOI] [PubMed] [Google Scholar]
- 35. Department of State Health Services, Texas population data. Texas population estimates and projections. 1999. Available at: http://www.dshs.state.tx.us/chs/popdat/ST1999.shtm. Accessed October 15, 2010.
- 36.US Census Bureau. State and county population and demographic factors by census tract and zip code. Available at: http://www.census.gov. Accessed October 15, 2010 [Google Scholar]
- 37.Anderson RN, Rosenberg HM. Age standardization of death rates: implementation of the year 2000 standard. Natl Vital Stat Rep. 1998;47(3):1–16, 20 [PubMed] [Google Scholar]
- 38.Grimes CZ. Epidemiology of Culture Positive Mycobacterium Tuberculosis—Molecular Characterization and Smear Status [dissertation]. Houston, TX: University of Texas Health Science Center at Houston School of Public Health; 2006 [Google Scholar]
- 39.McAdam JM, Bucher SJ, Brickner PW, Vincent RL, Lascher S. Latent tuberculosis and active tuberculosis disease rates among the homeless, New York, New York, USA, 1992–2006. Emerg Infect Dis. 2009;15(7):1109–1111 [DOI] [PMC free article] [PubMed] [Google Scholar]
- 40.Lukács J, Tubak V, Mester Jet al. Conventional and molecular epidemiology of tuberculosis in homeless patients in Budapest, Hungary. J Clin Microbiol. 2004;42(12):5931–5934 [DOI] [PMC free article] [PubMed] [Google Scholar]
- 41.Driver CR, Macaraig M, McElroy PDet al. Which patients’ factors predict the rate of growth of Mycobacterium tuberculosis clusters in an urban community? Am J Epidemiol. 2006;164(1):21–31 [DOI] [PubMed] [Google Scholar]
- 42.Dye C, Williams BG. The population dynamics and control of tuberculosis. Science. 2010;328(5980):856–861 [DOI] [PubMed] [Google Scholar]
- 43.Leaver CA, Bargh G, Dunn JR, Hwang SW. The effects of housing status on health-related outcomes in people living with HIV: a systematic review of the literature. AIDS Behav 2007;11(6 suppl):85–100 [DOI] [PubMed] [Google Scholar]
- 44.Martineau AR, Honecker FU, Wilkinson RJ, Griffiths CJ. Vitamin D in the treatment of pulmonary tuberculosis. J Steroid Biochem Mol Biol. 2007;103(3–5):793–798 [DOI] [PubMed] [Google Scholar]
- 45.Buchanan D, Kee R, Sadowski LS, Garcia D. The health impact of supportive housing for HIV-positive homeless patients: a randomized controlled trial. Am J Public Health. 2009;99(suppl 3):S675–S680 [DOI] [PMC free article] [PubMed] [Google Scholar]
- 46.Wootton SH, Gonzalez BE, Pawlak Ret al. Epidemiology of pediatric tuberculosis using traditional and molecular techniques: Houston, Texas. Pediatrics 2005;116(5):1141–1147 [DOI] [PubMed] [Google Scholar]
- 47.Sreevatsan S, Pan X, Stockbauer KEet al. Restricted structural gene polymorphism in the Mycobacterium tuberculosis complex indicates evolutionarily recent global dissemination. Proc Natl Acad Sci U S A. 1997;94(18):9869–9874 [DOI] [PMC free article] [PubMed] [Google Scholar]
- 48.Gutacker MM, Mathema B, Soini Het al. Single-nucleotide polymorphism-based population genetic analysis of Mycobacterium tuberculosis strains from 4 geographic sites. J Infect Dis. 2006;193(1):121–128 [DOI] [PubMed] [Google Scholar]
- 49.Extremera Montero F, Moyano Acost R, Gómez Pozo Bet al. Exposicion a Mycobacterium tuberculosis durante un viaje en autobús [Exposure to Mycobacterium tuberculosis during a bus travel]. Med Clin (Barc). 2001;116(5):182–185 [DOI] [PubMed] [Google Scholar]
- 50.Phillips L, Carlile J, Smith D. Epidemiology of a tuberculosis outbreak in a rural Missouri high school. Pediatrics. 2004;113(6):e514–e519 [DOI] [PubMed] [Google Scholar]
- 51.Sacks JJ, Brenner ER, Breeden DC, Anders HM, Parker RL. Epidemiology of a tuberculosis outbreak in a South Carolina junior high school. Am J Public Health. 1985;75(4):361–365 [DOI] [PMC free article] [PubMed] [Google Scholar]
- 52.Neira-Munoz E, Smith J, Cockcroft P, Basher D, Abubakar I. Extensive transmission of Mycobacterium tuberculosis among children on a school bus. Pediatr Infect Dis J. 2008;27(9):835–837 [DOI] [PubMed] [Google Scholar]
- 53.Curtis AB, Ridzon R, Vogel Ret al. Extensive transmission of Mycobacterium tuberculosis from a child. N Engl J Med. 1999;341(20):1491–1495 [DOI] [PubMed] [Google Scholar]
- 54.Yusuf HR, Braden CR, Greenberg AJ, Weltman AC, Onorato IM, Valway SE. Tuberculosis transmission among five school bus drivers and students in two New York counties. Pediatrics. 1997;100(3):E9. [DOI] [PubMed] [Google Scholar]
- 55.Feske ML, Teeter LD, Musser JM, Graviss EA. Including the third dimension: a spatial analysis of TB cases in Houston Harris County. Tuberculosis (Edinb). 2011;91(suppl 1):S24–S33 [DOI] [PubMed] [Google Scholar]
- 56.Feske ML, Teeter LD, Musser JM, Graviss EA. Giving TB wheels: public transportation as a risk factor for tuberculosis transmission. Tuberculosis (Edinb). 2011;91(suppl 1):S16–S23 [DOI] [PubMed] [Google Scholar]
- 57.Lomax JN. Metro vice president to homeless: stay off our train. Houston Press. November 6, 2009. Available at: http://blogs.houstonpress.com/hairballs/2009/11/metro_vice_president_to_homele.php. Accessed November 11, 2010 [Google Scholar]
- 58.Phelan JC, Link BG. Who are “the homeless”? Reconsidering the stability and composition of the homeless population. Am J Public Health. 1999;89(9):1334–1338 [DOI] [PMC free article] [PubMed] [Google Scholar]
- 59.Gray L. Helping hard-core homeless. Houston Chronicle. August 22, 2007. Available at: http://www.chron.com/news/article/Helping-hard-core-homeless-1812790.php. Accessed November 11, 2010 [Google Scholar]
- 60.Takahashi LM, Wolch JR. Differences in health and welfare between homeless and homed welfare applicants in Los Angeles County. Soc Sci Med. 1994;38(10):1401–1413 [DOI] [PubMed] [Google Scholar]
- 61.Klovdahl AS, Graviss EA, Yaganehdoost Aet al. Networks and tuberculosis: an undetected community outbreak involving public places. Soc Sci Med. 2001;52(5):681–694 [DOI] [PubMed] [Google Scholar]
- 62.Moss AR, Hahn JA, Tulsky JP, Daley CL, Small PM, Hopewell PC. Tuberculosis in the homeless. A prospective study. Am J Respir Crit Care Med. 2000;162(2 pt 1):460–464 [DOI] [PubMed] [Google Scholar]
- 63.Brewer TF, Heymann SJ. Long time due: reducing tuberculosis mortality in the 21st century. Arch Med Res. 2005;36(6):617–621 [DOI] [PubMed] [Google Scholar]
- 64.Miller TL, McNabb SJ, Hilsenrath P, Pasipanodya J, Drewyer G, Weis SE. The societal cost of tuberculosis: Tarrant County, Texas, 2002. Ann Epidemiol. 2010;20(1):1–7 [DOI] [PubMed] [Google Scholar]
- 65.Brown RE, Miller B, Taylor WRet al. Health-care expenditures for tuberculosis in the United States. Arch Intern Med. 1995;155(15):1595–1600 [PubMed] [Google Scholar]
- 66.Pollack CE, Lynch J. Health status of people undergoing foreclosure in the Philadelphia region. Am J Public Health. 2009;99(10):1833–1839 [DOI] [PMC free article] [PubMed] [Google Scholar]
- 67.American College of Obstetricians and Gynecologists, Committee on Health Care for Underserved Women Committee opinion no. 454: healthcare for homeless women. Obstet Gynecol. 2010;115(2 pt 1):396–399 [DOI] [PubMed] [Google Scholar]
- 68.Oren E, Winston CA, Pratt R, Robison VA, Narita M. Epidemiology of urban tuberculosis in the United States, 2000–2007. Am J Public Health. 2011;101(7):1256–1263 [DOI] [PMC free article] [PubMed] [Google Scholar]