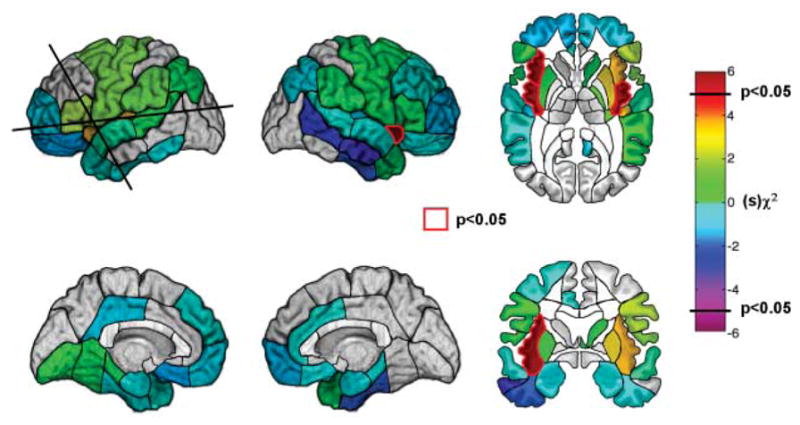
Fig. 3.

Whole-brain region-by-region logistic regression analysis. The color of each region corresponds to a χ2 statistic given the sign of regression coefficient obtained from the logistic regression analysis. The only regions that were assigned a color were those for which the number of patients was sufficient to detect a statistically significant effect (Materials and Methods). Regions for which there was a statistically significant association between a lesion and a disruption of smoking addiction (P < 0.05, uncorrected) are highlighted in red. The insula is the only region on either side of the brain where a lesion was significantly associated with a disruption of smoking addiction. There were nonsignificant effects in regions on the left side that are adjacent to the insula; however, patients with damage in these regions also tended to have damage in the insula (Materials and Methods). The likelihood of having a disruption of smoking addiction was not increased after damage in the orbitofrontal cortex.
