Abstract
Background
For decades, non-Hodgkin lymphoma (NHL) incidence has been increasing worldwide. NHL risk is strongly increased among HIV-infected people. Our understanding of trends in NHL incidence has been hampered by difficulties in separating HIV-infected NHL cases from general population rates.
Materials and Methods
NHL incidence data during 1992–2009 were derived from 10 U.S. SEER cancer registries with information on HIV status at NHL diagnosis. The CDC estimated the number of people living with HIV in the registry areas. The proportion of NHL cases with HIV and NHL rates in the total and the HIV-uninfected populations were estimated. Time trends were assessed with Joinpoint analyses.
Results
Of 115,643 NHL cases diagnosed during 1992–2009, 5.9% were HIV-infected. The proportions of NHL cases with HIV were highest for diffuse large B-cell (DLBCL; 7.8%), Burkitt (26.9%), and peripheral T-cell lymphomas (3.2%) with low proportions (≤1.1%) in the other subtypes. NHL rates in the total population increased 0.3% per year during 1992–2009. However, rates of NHL in HIV-uninfected people increased 1.4% per year during 1992–2003, before becoming stable through 2009. Similar trends were observed for DLBCL and follicular lymphoma in HIV-uninfected people; rates increased 2.7% per year until 2003 and 1.7% per year until 2005, respectively, before stabilizing.
Conclusions
NHL incidence rates in the U.S. have plateaued over the last 5–10 years, independent of HIV infection.
Impact
Though the causes of the long-term increase in NHL incidence rates in the U.S. remain unknown, general population rates of NHL have stabilized since the early 2000s, independent of HIV.
Keywords: non-Hodgkin lymphoma, HIV, trends
Introduction
Notable increases in the incidence of non-Hodgkin lymphoma (NHL) have been documented internationally throughout the second half of the twentieth century (1–6). In the United States, rates more than tripled in that interval (7), with similar increases across age groups and among men and women (1). Mortality rates from NHL also have increased, suggesting that changes in NHL classification alone cannot account for increasing rates (7, 8). Although studies have identified etiologic factors that may have contributed to increasing NHL rates, such as viruses, medical conditions and drugs, and occupational or environmental exposures (9), most of the increase in NHL rates remains unexplained.
With the onset of the human immunodeficiency virus (HIV) epidemic in the U.S. in the 1980s, NHL rates increased more steeply than in previous decades as NHL cases in persons with HIV were added to the longer-term increase in NHL incidence (10). Although HIV prevalence in the U.S. was low, the associated NHL risks were very large (77-fold) compared to the general population (11). The effect of HIV varies by NHL subtype, with risks particularly increased for diffuse large B-cell lymphoma (DLBCL, 30-fold), Burkitt lymphoma (50-fold) and central nervous system (CNS) lymphoma (1,020-fold) (12), three types of NHL that are considered acquired immune deficiency syndrome (AIDS)-defining events by the Centers for Disease Control and Prevention (CDC) (13). In 1996, highly active antiretroviral therapy (HAART) was introduced to treat HIV infection, improving immune function of persons with HIV and resulting in a 58% decline in NHL risk (12, 14). During 1980–2007, 5.5% of DLBCLs, 19.4% of Burkitt lymphomas and 26.2% of CNS lymphomas in the U.S. occurred among HIV-infected individuals (15).
In recent years, NHL incidence rates appear to have plateaued, leading some studies to suggest that the NHL epidemic has ended (3, 6, 16, 17). However, previous studies of NHL rates have not separated HIV-infected NHL cases from total NHL rates. To assess whether the long-standing epidemic of NHL in the general population has ended, we combined data from the Surveillance, Epidemiology and End Results (SEER) Program and the CDC from 1992–2009, enabling us to quantify the proportion of NHL cases with HIV infection and estimate NHL incidence rates over time in the absence of HIV-infected NHL cases.
Materials and Methods
Data sources
NHL incidence data were derived from 10 U.S. SEER population-based cancer registries that ascertained cancer diagnoses during 1992– 2009 (Connecticut, Hawaii, New Mexico, Utah, Atlanta, Detroit, Seattle/Puget Sound, Los Angeles, San Francisco/Oakland, San Jose/Monterey) and collected information on HIV status from medical records at the time of NHL diagnosis (18, 19). A previous study documented high sensitivity of the SEER HIV indicator, despite a large proportion of NHL cases with an unknown HIV status (19). We therefore classified the 71% of cases with unknown HIV status as HIV-uninfected. In a sensitivity analysis, we re-classified NHL cases as HIV-infected if they had HIV listed as the cause of death, but did not have a positive HIV indicator (n=581, 0.5%).
Because NHL is comprised of a heterogeneous group of distinct subtypes, we examined NHL overall and by subtype. NHLs were identified using the SEER site recode variable based on morphology codes from the International Classification of Diseases for Oncology, third edition (ICD-O-3) (20). The following subtypes were defined using SEER's lymphoma subtype recode, based on the International Lymphoma Epidemiology Consortium (InterLymph) classification (21): DLBCL, follicular, marginal zone, peripheral T-cell, and mantle cell lymphomas, mycosis fungoides/Sézary syndrome, other, specified NHL and NHL, not otherwise specified (NOS). We also defined Burkitt lymphoma (ICD-O-3 code 9687), and small lymphocytic lymphoma (9670), excluding Burkitt leukemia and chronic lymphocytic leukemia, respectively, from these entities because lymphoid leukemias were not considered part of NHL until the World Health Organization (WHO) classification was introduced in 2000 (22). HIV status was not collected for cases of mycosis fungoides/Sézary syndrome; thus, all cases were assumed to be HIV-uninfected in the analysis of total NHL. CNS lymphoma (an AIDS-defining cancer) was not analyzed as a separate entity, as we focused on histologically-defined NHL subtypes.
To calculate the denominator for NHL incidence rates in HIV-uninfected individuals, data on HIV cases in each cancer registry area were obtained from CDC HIV surveillance data. Since 1982, AIDS diagnoses have been uniformly reported to the CDC by registries in all 50 U.S. states and the District of Columbia. In 1994, CDC integrated national reporting of HIV infection with AIDS case reporting. However, the uptake of HIV reporting was variable by state; thus, data on all people living with HIV (with or without AIDS) only are available during 2006–2009. For this analysis, the CDC estimated the number of people living with AIDS from 1992–2009, and the number of people living with HIV infection from 2006–2009 at the end of each calendar year in strata defined by calendar year, sex, attained age, race/ethnicity and geographic area, with statistical adjustments made for reporting delays (23, 24).
Statistical analysis
The proportions of NHL cases with HIV infection were estimated by NHL subtype and stratified by sex, age group (0–14, 15–39, 40–59, 60+ year-olds), race/ethnicity (non-Hispanic white, non-Hispanic black, Hispanic) and calendar period (1992–1995, 1996–1999, 2000–2004, 2005–2009). Incidence rates of HIV-uninfected NHL were estimated by subtracting HIV-infected cases from the numerator and the AIDS population from the denominator. We conducted a sensitivity analysis with data from 2006–2009 that compared HIV-uninfected NHL rates calculated by removing all persons with HIV and only persons with AIDS from the denominator. In an additional analysis, we assessed long-term trends in U.S. NHL incidence rates with data from 8 SEER registries during 1974–2009 (Connecticut, Hawaii, New Mexico, Utah, Atlanta, Detroit, Seattle/Puget Sound, San Francisco/Oakland).
All rates were age-standardized to the 2000 U.S. population and stratified by sex and age group. Calendar trends in incidence rates were estimated overall and among HIV-uninfected individuals, and annual percent changes in incidence rates were estimated with Joinpoint regression (25, 26).
Results
Characteristics of HIV-infected and HIV-uninfected NHL cases
During 1992–2009, 115,643 persons were diagnosed with NHL in 605 million person-years. Of these, 6,784 persons (5.9%) were HIV infected at the time of diagnosis. The majority of HIV-infected NHL cases were AIDS-defining cancers: DLBCL (45.5%) and Burkitt lymphoma (8.4%) (Table 1). Among HIV-uninfected NHL cases, DLBCL (33.6%) and follicular lymphoma (17.9%) were the most common subtypes, and Burkitt lymphoma was rare (1.4%). HIV-infected NHL cases predominantly occurred among males and 15–39 and 40–59 year-olds. A greater proportion of NHL cases were HIV-infected in the pre-HAART calendar period (1992–1995) compared to the most recent calendar period (2004–2009).
Table 1.
Characteristics of HIV-uninfected and HIV-infected NHL cases in 10 SEER registries, 1992–2009.
| HIV-uninfected | HIV-infected | |||
|---|---|---|---|---|
| N | % | N | % | |
| Total | 108,859 | 6,784 | ||
| AIDS-defining NHLs | ||||
| DLBCL | 36,607 | 33.6 | 3,089 | 45.5 |
| Burkitt lymphoma | 1,540 | 1.4 | 568 | 8.4 |
| Other NHL subtypes | ||||
| Follicular lymphoma | 19,497 | 17.9 | 163 | 2.4 |
| Marginal zone lymphoma | 8,514 | 7.8 | 96 | 1.4 |
| Small lymphocytic lymphoma | 7,462 | 6.9 | 54 | 0.8 |
| Peripheral T-cell lymphoma | 5,875 | 5.4 | 193 | 2.8 |
| Mantle cell lymphoma | 3,602 | 3.3 | 24 | 0.4 |
| Mycosis fungoides/Sézary syndrome | 3,446 | 3.2 | --- | --- |
| Other, specified | 3,146 | 2.9 | 75 | 1.1 |
| NOS | 19,170 | 17.6 | 2,522 | 37.2 |
| Sex | ||||
| Male | 57,655 | 53.0 | 6,133 | 90.4 |
| Female | 51,204 | 47.0 | 651 | 9.6 |
| Age group, years | ||||
| 0–14 | 1,193 | 1.1 | 15 | 0.2 |
| 15–39 | 8,682 | 7.8 | 2,806 | 41.4 |
| 40–59 | 28,622 | 26.3 | 3,427 | 50.5 |
| 60+ | 70,362 | 64.6 | 536 | 7.9 |
| Race | ||||
| Non-Hispanic White | 79,278 | 72.8 | 3,870 | 57.0 |
| Non-Hispanic Black | 7,617 | 7.0 | 1,326 | 19.5 |
| Hispanic | 11,347 | 10.4 | 1,370 | 20.2 |
| Other | 10,617 | 9.8 | 218 | 3.2 |
| Calendar period, average per year* | ||||
| 1992–1995 | 4,934 | 4.5 | 671 | 9.9 |
| 1996–1999 | 5,666 | 5.2 | 376 | 5.5 |
| 2000–2004 | 6,361 | 5.8 | 263 | 3.9 |
The proportion of cases occurring in each calendar period was calculated per year, because the intervals do not include the same number of years (i.e., 4 years in 1992–1995 and 1996– 1999 and 5 years in 2000–2004 and 2005–2009).
Proportion of NHL cases with HIV infection
The AIDS-defining NHL subtypes had the highest proportion of cases with HIV, with 26.9% of Burkitt lymphoma cases and 7.8% of DLBCL cases having HIV infection. In addition, 3.2% of peripheral T-cell lymphoma cases and 11.6% of NHL NOS cases were HIV-infected. The remaining NHL subtypes had very low proportions of cases with HIV infection (0.7%–1.1%).
Within each NHL subtype, the proportion of NHL cases with HIV infection varied by sex, age group, race/ethnicity and calendar period (Table 2). The proportion of NHL cases with HIV infection was higher among males than females for total NHL (9.6% vs. 1.3%), as well as all NHL subtypes, particularly DLBCL (12.8% vs. 1.6%), Burkitt lymphoma (32.9% vs. 9.0%) and peripheral T-cell lymphoma (4.5% vs. 1.3%). Among males, proportions of NHL cases with HIV were highest among 15–39 (33.5%) and 40–59 (16.4%) year-olds, and very low among 60+ (1.1%) and 0–14 year-olds (1.0%). Non-Hispanic black (21.7%) and Hispanic men (17.6%) had higher proportions of HIV-infected NHL cases compared to non-Hispanic white men (7.9%), and the proportion of HIV-infected NHL cases declined across calendar periods (19.8% in 1992–1995, 5.5% in 2004–2009) in males. Patterns were similar among females, though the proportions of NHL cases with HIV were much smaller.
Table 2.
Proportion of non-Hodgkin lymphoma cases that are HIV-infected, by sex, race/ethnicity and age group, 1992–2009.
| Overall | Age group, years | Race/ethnicity | Calendar periods | |||||||||
|---|---|---|---|---|---|---|---|---|---|---|---|---|
| 0–14 | 15–39 | 40–59 | 60+ | NHW | NHB | Hispanic | 92–95 | 96–99 | 00–03 | 04–08 | ||
| Males | ||||||||||||
|
| ||||||||||||
| Total NHL | 9.6% | 1.0% | 33.5% | 16.4% | 1.1% | 7.9% | 21.7% | 17.6% | 19.8% | 10.1% | 6.4% | 5.5% |
| Diffuse large B-cell lymphoma | 12.8% | 1.7% | 35.2% | 23.4% | 1.5% | 10.7% | 29.3% | 21.5% | 23.8% | 13.6% | 9.8% | 8.2% |
| Burkitt lymphoma | 32.9% | 0.4% | 45.2% | 54.3% | 4.5% | 30.4% | 51.0% | 42.9% | 46.9% | 27.4% | 27.5% | 34.0% |
| Follicular lymphoma | 1.2% | 0.0% | 4.9% | 1.6% | 0.5% | 0.9% | 5.0% | 2.2% | 2.0% | 0.6% | 1.3% | 1.1% |
| Marginal zone lymphoma | 1.6% | 0.0% | 5.1% | 3.4% | 0.5% | 1.2% | 4.9% | 3.1% | 6.4% | 2.7% | 1.8% | 0.6% |
| Mantle cell lymphoma | 0.8% | --- | 12.9% | 0.6% | 0.6% | 0.7% | 1.0% | 2.1% | 1.3% | 0.6% | 0.5% | 0.9% |
| Small lymphocytic lymphoma | 1.0% | 0.0% | 6.6% | 1.7% | 0.5% | 0.8% | 2.4% | 2.1% | 1.5% | 1.1% | 0.8% | 0.6% |
| Peripheral T-cell lymphoma | 4.5% | 0.0% | 9.4% | 7.8% | 1.4% | 3.9% | 8.3% | 7.4% | 7.6% | 4.4% | 4.9% | 3.0% |
| Other, specified | 3.5% | 0.9% | 7.0% | 7.4% | 0.8% | 3.1% | 7.6% | 5.2% | 7.4% | 3.6% | 2.2% | 2.6% |
| NOS | 18.9% | 3.2% | 58.6% | 31.7% | 1.3% | 16.0% | 36.3% | 33.0% | 30.4% | 18.6% | 9.5% | 8.4% |
|
| ||||||||||||
| Females | ||||||||||||
|
| ||||||||||||
| Total NHL | 1.3% | 1.8% | 6.1% | 2.0% | 0.5% | 0.7% | 6.0% | 2.2% | 1.3% | 1.5% | 1.1% | 1.2% |
| Diffuse large B-cell lymphoma | 1.6% | 1.5% | 6.3% | 3.3% | 0.5% | 0.8% | 8.6% | 2.8% | 1.3% | 2.0% | 1.5% | 1.6% |
| Burkitt lymphoma | 9.0% | 3.3% | 20.5% | 13.1% | 1.8% | 5.9% | 31.4% | 12.9% | 10.9% | 11.5% | 5.7% | 10.0% |
| Follicular lymphoma | 0.5% | 0.0% | 1.1% | 0.6% | 0.3% | 0.4% | 1.3% | 0.5% | 0.5% | 0.3% | 0.6% | 0.4% |
| Marginal zone lymphoma | 0.7% | 0.0% | 1.2% | 0.8% | 0.6% | 0.5% | 1.1% | 1.3% | 0.0% | 0.9% | 0.4% | 0.9% |
| Mantle cell lymphoma | 0.4% | --- | 0.0% | 0.4% | 0.4% | 0.5% | 1.4% | 0.0% | 0.6% | 1.2% | 0.0% | 0.2% |
| Small lymphocytic lymphoma | 0.4% | 0.0% | 0.0% | 0.7% | 0.3% | 0.4% | 1.1% | 0.0% | 0.4% | 0.3% | 0.4% | 0.5% |
| Peripheral T-cell lymphoma | 1.3% | 0.0% | 1.9% | 1.8% | 0.9% | 0.9% | 3.3% | 0.8% | 1.0% | 1.5% | 1.3% | 1.1% |
| Other, specified | 0.6% | 0.0% | 1.7% | 0.8% | 0.4% | 0.4% | 3.3% | 0.5% | 0.5% | 1.3% | 0% | 0.9% |
| NOS | 2.0% | 8.5% | 16.3% | 3.6% | 0.4% | 0.8% | 11.2% | 3.9% | 2.4% | 2.1% | 1.7% | 1.9% |
NHL: non-Hodgkin lymphoma; NHW: non-Hispanic white; NHB: non-Hispanic black; NOS: not otherwise specified
Missing values indicate fewer than 5 total cases in SEER.
Trends in overall NHL incidence rates
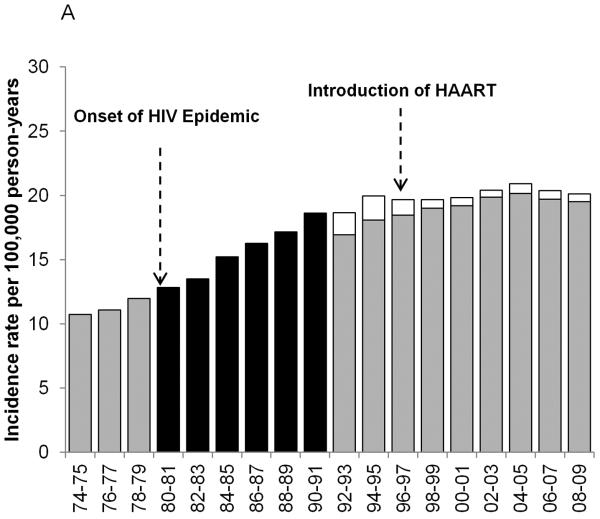
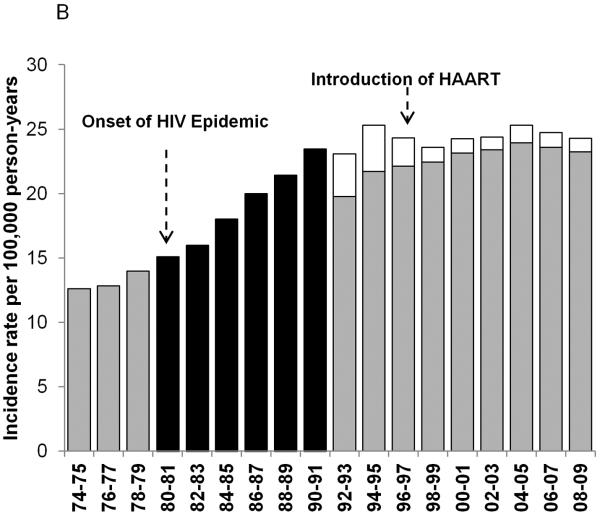
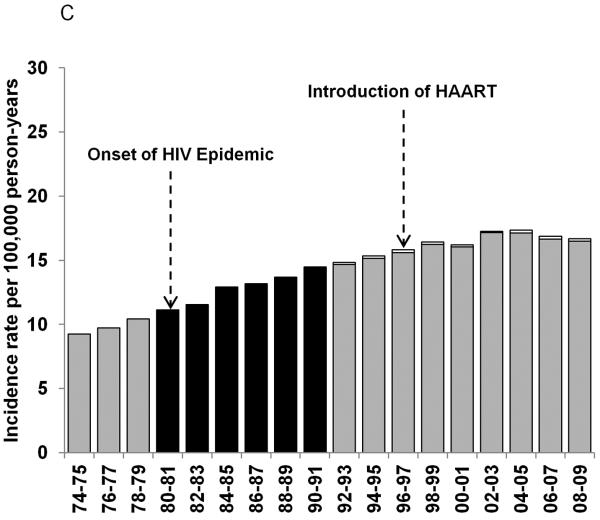
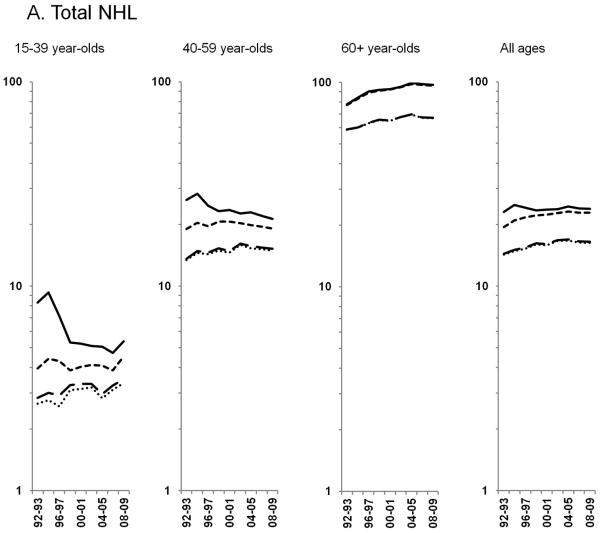
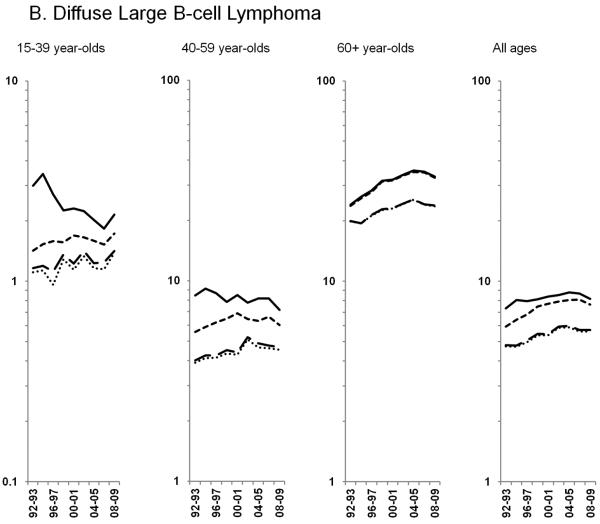
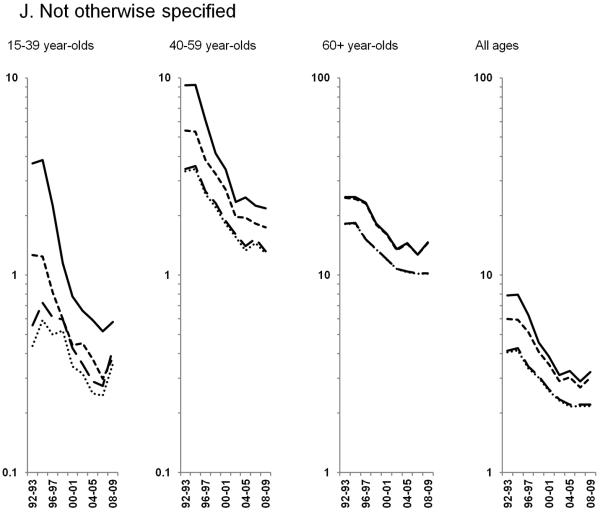
U.S. NHL rates nearly doubled during 1974–2009, increasing rapidly through the early 1990s, followed by more gradual increases and stable rates in recent years. In men, rates increased through the early 1990s, and, in women, rates increased through the early 2000s before stabilizing. Figure 1 shows NHL incidence rates prior to the onset of HIV in the U.S. (1974–1979), during the first decade after the onset of the HIV epidemic (1980–1991), for which HIV data are unavailable, and the most recent period (1992–2009), for which HIV data are available overall and stratified by sex. During 1992–2009, NHL incidence rates in the total population increased 0.3% per year. However, exclusion of HIV-infected cases demonstrated that rates increased 1.4% per year through 2003 before flattening out (Figure 2A). The impact of HIV on NHL temporal trends was most pronounced in 15–39 and 40–59 year-olds. In the total population of 15–39 year-olds, NHL rates decreased during 1995–1998, and then remained flat for the rest of the time period; however, among HIV-uninfected individuals aged 15–39 years, rates increased 0.6% during 1992–2009. Among 40–59 year-olds, in the total population, NHL rates appeared to decline beginning in 1994, but among HIV-uninfected individuals, rates continued to increase 0.9% per year through 2002 before stabilizing. HIV-infected NHL cases had little impact on rates among 60+ year-olds; NHL rates in HIV-uninfected individuals became stable after increasing 1.7% per year during 1992–2004 (Figure 2A). Notable differences in NHL incidence trends in the total population and in HIV-uninfected individuals were primarily limited to men (data not shown).
Figure 1.
Age-standardized incidence rates for NHL during 1974–2009 for 8 SEER registries: Atlanta, Connecticut, Detroit, Hawaii, New Mexico, San Francisco-Oakland, Seattle-Puget Sound and Utah. The black bars represent overall NHL incidence rates from the time period before the HIV status indicator was available for a) men and women; b) men only; and c) women only. The gray bars represent HIV-uninfected NHL cases and the white bars represent HIV-infected NHL cases during the period when the HIV status indicator was available.
Figure 2.
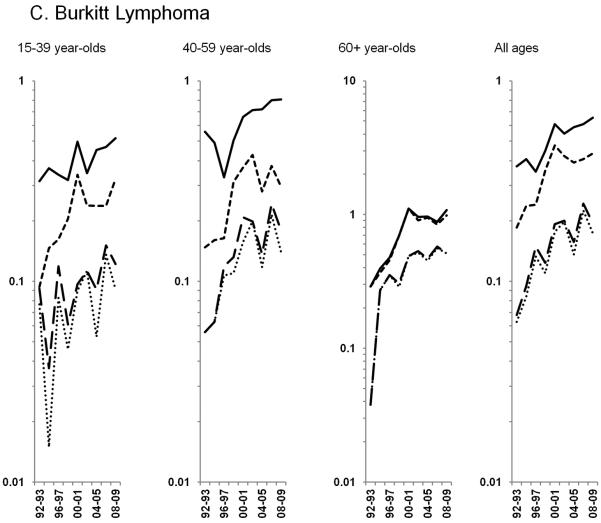
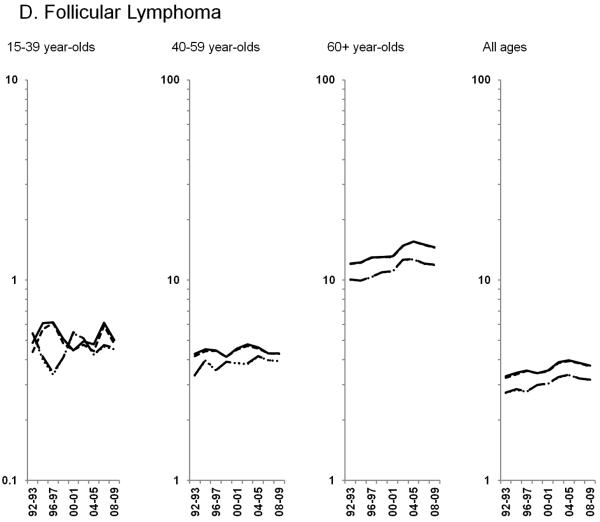
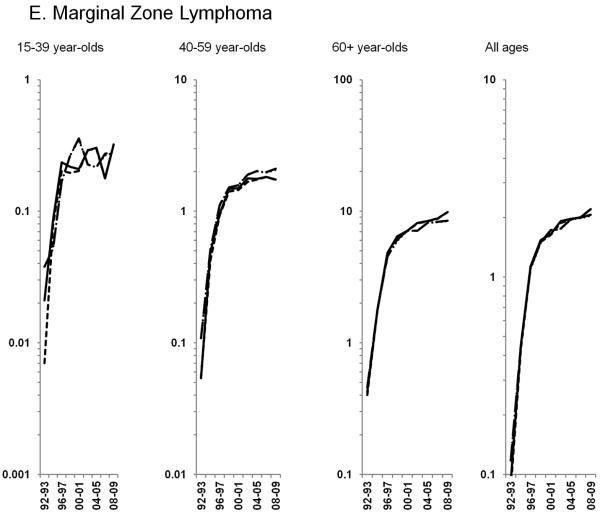
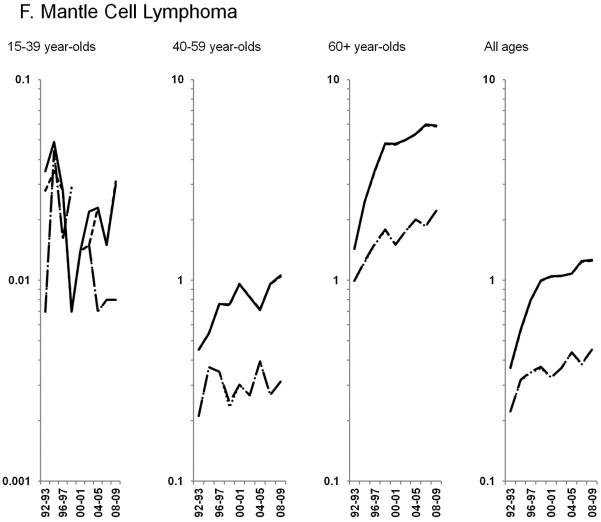
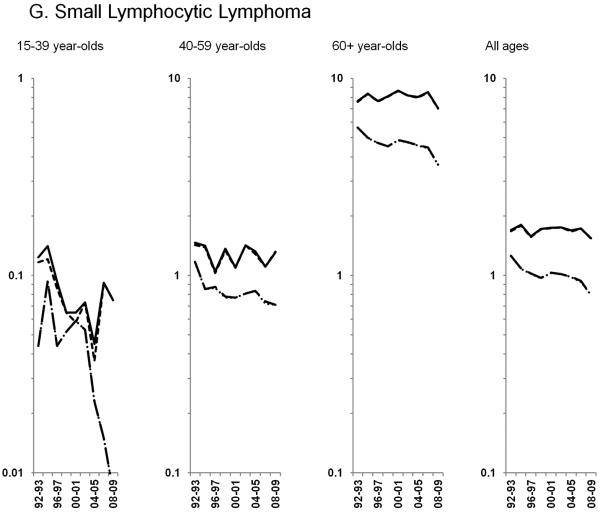
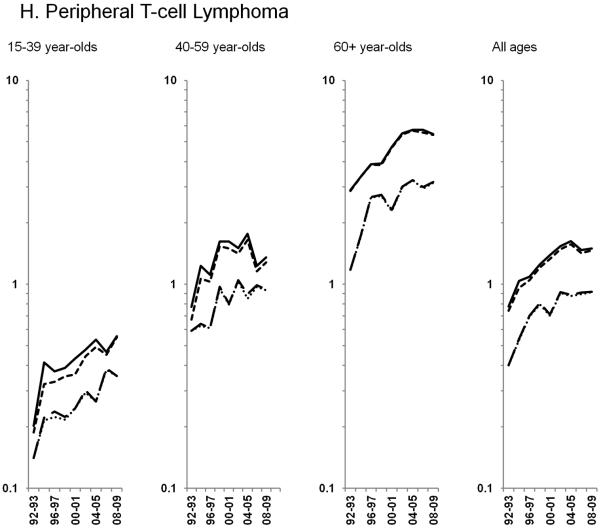
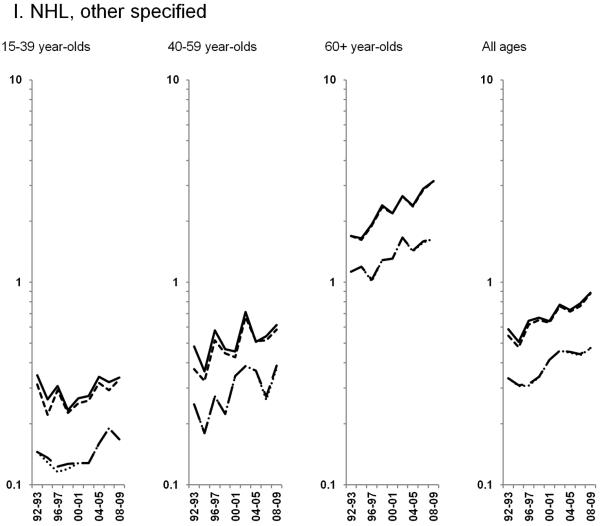
Age-standardized incidence rates stratified by age group during 1992–2009 for a) NHL overall; b) diffuse large B-cell lymphoma, c) Burkitt lymphoma, d) follicular lymphoma, e) marginal zone lymphoma, f) mantle cell lymphoma, g) small lymphocytic lymphoma, h) peripheral T-cell lymphoma, i) other, specified lymphomas and j) lymphoma, NOS. The solid black line represents incidence rates in men overall, the dashed black line (----) represents incidence rates in men without HIV infection, the larger dashed line (---) represents incidence rates in women overall and the dotted line (......) represents incidence rates in women without HIV infection.
Trends in AIDS-defining NHL incidence rates
Incidence trends differed over time across NHL subtypes and by age group, with the impact of HIV most evident for AIDS-defining NHLs. For DLBCL, rates in the total population appeared to decline in 15–39 and 40–59 year-olds (Figure 2B; Table 3). However, rates among HIV-uninfected individuals actually increased 0.9% per year during 1992–2009 for 15–39 year-olds and 2.1% per year during 1992–2002 before flattening out for 40–59 year-olds. The differences in DLBCL rates in the total and HIV-uninfected populations for individuals aged <60 years were more pronounced among men than women. For 60+ year-olds, DLBCL rates also increased 2.9% per year during 1992–2004 before stabilizing, with similar estimates in the total and HIV-uninfected populations.
Table 3.
Joinpoint models of annual percent changes (APCs) in NHL trends excluding HIV-infected cases by sex, NHL subtype and age group, 1992–2008
| 15–39 year-olds | 40–59 year-olds | 60+ year-olds | Total | |||||
|---|---|---|---|---|---|---|---|---|
|
| ||||||||
| Years | APC* | Years | APC* | Years | APC* | Years | APC* | |
| Total NHL | 1992–2009 | 0.6 (0.1, 1.0) | 1992–2002 | 0.9 (0.2, 1.7) | 1992–2004 | 1.7 (1.3, 2.0) | 1992–2003 | 1.4 (1.1, 1.8) |
| 2002–2009 | −1.0 (−2.0, 0.1) | 2004–2009 | −0.7 (−1.9, 0.6) | 2003–2009 | −0.4 (−1.1, 0.4) | |||
|
| ||||||||
| Diffuse large B-cell lymphoma | 1992–2009 | 0.9 (0.1, 1.7) | 1992–2002 | 2.1 (0.9, 3.3) | 1992–2004 | 2.9 (2.4, 3.5) | 1992–2003 | 2.7 (2.1, 3.2) |
| 2002–2009 | −1.2 (−2.9, 0.4) | 2004–2009 | −1.7 (−3.4, 0.1) | 2003–2009 | −1.0 (−2.1, 0.2) | |||
|
| ||||||||
| Burkitt lymphoma | 1992–2009 | 4.9 (2.1, 7.9) | 1992–2001 | 14.8 (5.9, 24.4) | 1992–2000 | 19.8 (11.4, 28.8) | 1992–2000 | 13.1 (8.0, 18.5) |
| 2001–2009 | −2.8 (−9.0, 3.7) | 2000–2009 | −0.6 (−4.0, 2.9) | 2000–2009 | −0.2 (−2.9, 2.6) | |||
|
| ||||||||
| Follicular lymphoma | 1992–2009 | 0.0 (−0.7, 0.8) | 1992–2009 | 0.4 (−0.2, 0.9) | 1992–2005 | 2.3 (1.7, 2.9) | 1992–2005 | 1.7 (1.2, 2.1) |
| 2005–2009 | −2.1 (−5.2, 1.1) | 2005–2009 | −1.8 (−4.2, 0.7) | |||||
|
| ||||||||
| Marginal zone lymphoma | 1992–1997 | 67.3 (28.1, 118.4) | 1992–1996 | 91.6 (45.7, 152.1) | 1992–1996 | 116.1 (62.1, 188.1) | 1992–1996 | 99.9 (60.9, 148.3) |
| 1997–2009 | 1.3 (−1.6, 4.2) | 1996–2002 | 9.5 (3.4, 16.1) | 1996–2009 | 4.7 (3.1, 6.3) | 1996–2001 | 10.4 (2.2, 19.3) | |
| 2002–2009 | 0.7 (−2.0, 3.5) | 2001–2009 | 2.0 (−0.1, 4.1) | |||||
|
| ||||||||
| Mantle cell lymphoma | --- | --- | 1992–2009 | 2.6 (0.7, 4.5) | 1992–1996 | 26.0 (13.0, 40.5) | 1992–1996 | 21.0 (9.6, 33.7) |
| 1996–2009 | 3.4 (2.2, 4.5) | 1996–2009 | 2.9 (1.8, 4.0) | |||||
|
| ||||||||
| Small lymphocytic lymphoma | 1992–2009 | −4.5 (−7.2, −1.8) | 1992–2009 | −1.1 (−2.4, 0.3) | 1992–2009 | −0.9 (−1.6, −0.1) | 1992–2009 | −1.0 (−1.5, −0.4) |
|
| ||||||||
| Peripheral T-cell lymphoma | 1992–2009 | 4.9 (3.4, 6.3) | 1992–1999 | 9.4 (2.7, 16.5) | 1992–1996 | 17.3 (5.5, 30.5) | 1992–1998 | 10.9 (6.2, 15.8) |
| 1999–2009 | −0.7 (−3.5, 2.2) | 1996–2009 | 2.6 (1.3, 3.9) | 1998–2009 | 1.7 (0.5, 3.0) | |||
|
| ||||||||
| NHL, other specified | 1992–2009 | 1.3 (−0.4, 3.1) | 1992–2009 | 2.7 (0.7, 4.8) | 1992–2009 | 3.5 (2.6, 4.4) | 1992–2009 | 3.0 (2.2, 3.8) |
|
| ||||||||
| NOS | 1992–2009 | −7.3 (−8.9, −5.6) | 1992–2004 | −9.0 (−10.6, −7.3) | 1992–2002 | −6.0 (−7.2, −4.8) | 1992–1994 | 2.0 (−8.4, 13.7) |
| 2004–2009 | −0.5 (−8.4, 8.1) | 2002–2009 | −1.0 (−3.4, 1.5) | 1994–2002 | −8.2 (−9.6, −6.7) | |||
| 2002–2009 | −0.7 (−2.5, 1.1) | |||||||
APC: annual percent change; CI: confidence interval; NHL: non-Hodgkin lymphoma
Burkitt lymphoma rates increased during 1992–2009 overall and among 15–39 and 40–59 year-olds in the total population; however, among HIV-uninfected individuals, rates increased dramatically through 2000 overall and 2001 among 40–59 year-olds before stabilizing. (Figure 2C; Table 3). Rates of HIV-uninfected Burkitt lymphoma in 60+ year-olds reflected a similar pattern, stabilizing after increasing 19.8% per year during 1992–2000.
Trends in non-AIDS-defining NHL incidence rates
HIV-infected NHL cases did not impact trends observed for the remaining subtypes, thus all results below are for NHL in HIV-uninfected individuals. Among the more common B-cell NHL subtypes, increases in follicular lymphoma rates of 2.3% per year were observed through 2005 among 60+ year-olds, whereas rates were stable during the study period for <60 year-olds (Figure 2D). Marginal zone lymphoma increased dramatically during 1992–2001, before leveling off in subsequent years (Figure 2E; Table 3). A similar pattern was observed for mantle cell lymphoma, with rates increasing 21.0% per year during 1992–1996 and 2.9% per year during 1996–2009 (Figure 2F; Table 3). In contrast, rates of small lymphocytic lymphoma declined across all age groups (Figure 2G; Table 3).
Among T-cell NHLs, rates of peripheral T-cell lymphoma increased 10.9% per year until 1998 and at a more modest rate of 1.7% per year during 1998–2009 (Figure 2H; Table 3). In the total population, rates of mycosis fungoides/Sézary syndrome increased through 1996 before stabilizing in subsequent years (data on HIV-uninfected rates were unavailable).
Throughout the study period, rates of other, specified NHLs increased across age groups, particularly among 60+ year-olds (3.5% per year). In contrast, rates of NHL NOS declined sharply during 1994–2002, and have been stable in subsequent years (Figures 2I & 2J).
Sensitivity analyses demonstrated that incidence rates calculated during 2006–2009 were similar when all HIV-infected individuals were removed from the denominator compared with our primary analysis, which removed only AIDS cases (Supplemental Table 1). In addition, when we classified HIV status based on both the HIV indicator and cause of death, we observed very similar NHL trends to our main analysis, and the proportion of NHL cases with HIV increased slightly from 5.9% to 6.4% overall (10.4% in males and 1.4% in females).
Discussion
Although some studies have reported stable NHL incidence rates in the U.S. in recent years (8, 27), the status of the long-standing epidemic of NHL in the general population has been uncertain because of the superimposition of NHL in persons with HIV over the past three decades. By disentangling the incidence of NHL occurring in HIV-infected and HIV-uninfected individuals, we have demonstrated for the first time that the general population rates of NHL have stabilized since the early 2000s, independent of HIV.
Our results have several implications. First, the pre-HIV increase in NHL incidence rates, on which the later HIV-associated increase in NHL incidence rates was added, has ended without any discovery of its major causes. Many of the hypothesized contributors (9) have been studied intensively, including medical history, anthropometric, lifestyle, dietary, sun exposure, environmental and genetic risk factors (28). Several exposures, including pesticides, hepatitis C virus, and certain chronic autoimmune conditions, do indeed appear to elevate risk, but the low prevalence of these exposures in the general population indicate little to no impact on trends. It is possible that other, unidentified infections may have arisen, perhaps having powerful effects on NHL risk similar to what was observed for HIV.
Our analysis also demonstrates that effective therapies for HIV, which have decreased NHL risk in HIV-infected individuals (12, 14), have dramatically altered NHL trends in some population groups. NHL rates in HIV-infected individuals declined rapidly in the early to mid-1990s, followed by more gradual declines in more recent years (29). Though the prevalence of HIV is low in the U.S. (0.4% in 2008 (30)), HIV has impacted NHL rates at the national level and a large fraction of certain NHL subtypes in the U.S. occur among HIV-infected individuals. In 10 regions of the U.S., the proportion of NHL cases with HIV was greatest for NHL subtypes with the strongest associations with HIV [i.e., DLBCL (7.8%) and Burkitt lymphoma (26.9%)] and in subgroups with higher HIV prevalence [i.e., men (9.6%), 15–39 and 40–59 year-olds (24.4% and 10.7%, respectively), and non-Hispanic blacks and Hispanics (14.8% and 10.8%, respectively)]. Notably, the contribution of HIV-infected cases to the total number of NHL cases has declined over time (1 out of 8 in 1992–1995 to 1 out of 28 NHL cases in 2005–2009). Our results are similar to previously published estimates for the U.S. during 1980–2007 based on data from the HIV/AIDS Cancer Match Study (DLBCL: 9.4% in men and 0.93% in women; Burkitt lymphoma: 24.4% in men, 5.3% in women) (15). Of note, though not an AIDS-defining cancer, the proportion of peripheral T-cell lymphoma cases with HIV infection was elevated compared to the other subtypes. This is likely driven by the 24-fold elevated risk of peripheral T-cell lymphoma in people with AIDS (31). The proportions of cases of other NHL subtypes with HIV were low, due to weaker associations with HIV infection, and the proportion of cases of NHL NOS with HIV infection was high, suggesting HIV-infected NHL cases are less likely to be assigned a specific NHL subtype (1, 32).
Rates of DLBCL and follicular lymphoma, the two most common NHL subtypes, showed similar trends among persons without HIV, despite possible differences in etiology (28). Following years of increasing trends, DLBCL rates have been stable since 2003, and rates of follicular lymphoma have been stable since 2005. For both DLBCL and follicular lymphoma, rates have also been stable since the mid-2000s among 60+ year-olds, the group with the largest burden of NHL.
We observed strong increases in peripheral T-cell, mantle cell, Burkitt and marginal zone lymphomas, with rates stabilizing for Burkitt and marginal zone lymphomas in recent years. The striking increases in the rates of marginal zone and mantle cell lymphomas have previously been attributed to the adoption of a specific ICD-O-2 code for marginal zone lymphoma by cancer registries, improved diagnosis of mantle cell lymphoma with immunohistochemical staining, and increased recognition of these subtypes by pathologists (32). Because of the rapid improvements in classification of NHL subtypes during the 1990s, increased incidence of rarer NHL subtypes during this time period should be interpreted cautiously. In contrast, rates of small lymphocytic lymphoma have declined. With the introduction of the WHO classification in 2000 (22), small lymphocytic lymphoma and chronic lymphocytic leukemia were classified as a single entity, but changes in diagnostic practices are unlikely to explain the decline in small lymphocytic lymphoma because rates of chronic lymphocytic leukemia remained stable over the study period (data not shown).
Rates of NHL, NOS decreased over time across age groups, indicating a pronounced period effect likely due to increased diagnostic specificity introduced when the Revised European-American Lymphoma (REAL) classification system was adopted in 1995, followed by the WHO classification system (22, 32–34). As a result, the proportion of total NHLs that were NOS declined from 31% in 1992-1995 to 13% in 2005-2009. It is possible that improved classification of NHLs may have influenced rates of certain NHL subtypes (e.g., mantle cell and marginal zone lymphomas as mentioned above). However, the rates of NHL NOS have been stable since 2002; and thus likely had little impact on observed trends in NHL subtypes in recent years, and have had no impact on overall NHL rates. Additional efforts to increase classification of NHLs could have important implications for monitoring and treatment, particularly among HIV-infected individuals where 19% of NHLs were NOS in the most recent time period.
An important strength of our study was the availability of data on the HIV status of lymphoma cases diagnosed in 10 high-quality SEER registries. Though there may be some misclassification due to the large proportion of NHL cases with unknown HIV status, one prior study estimated that the SEER HIV flag has 97% sensitivity and 92% specificity at identifying the HIV status of NHL cases, and another study reported that, compared to other registry indicators of HIV status, the SEER HIV flag was positive in 91–95% of HIV-infected NHL cases (19, 35). Further, the inclusion of NHL cases with HIV as a cause of death in the HIV-infected group had little impact on our results. An additional limitation is the lack of data on the number of HIV-infected individuals living in the registry areas during the entire study period. As data on HIV infection were not uniformly collected by the CDC in these regions until recently, in our main analysis we were only able to subtract out AIDS cases from the populations at risk. In a sensitivity analysis limited to those calendar years where HIV data were available for all registry areas, we showed that removal of all individuals living with HIV resulted in very similar estimates.
Though the causes of the historic increase in general population NHL incidence rates remain unknown, total NHL incidence rates in the U.S. have plateaued over the last 5–10 years, as have the rates of several NHL subtypes, including DLBCL and follicular lymphoma, independent of HIV. Continued monitoring of trends in NHL incidence among HIV-uninfected people is critical to confirm the end of the long-standing NHL epidemic.
Supplementary Material
Acknowledgements
The authors thank Mr. Nathan Appel of Information Management Services for technical support funded by the Intramural Research Program of the National Cancer Institute.
Disclaimer: The findings and conclusions in this study are those of the authors and do not necessarily represent the views of the Centers for Disease Control and Prevention.
Funding: This study was funded by the Intramural Research Program of the National Cancer Institute.
Footnotes
Conflicts of Interest: The authors have no conflicts of interest to declare.
Reference List
- (1).Clarke CA, Glaser SL. Changing incidence of non-Hodgkin lymphomas in the United States. Cancer. 2002;94(7):2015–23. doi: 10.1002/cncr.10403. [DOI] [PubMed] [Google Scholar]
- (2).Devesa SS, Fears T. Non-Hodgkin's lymphoma time trends: United States and international data. Cancer Res. 1992;52(19 Suppl):5432s–40s. [PubMed] [Google Scholar]
- (3).Sandin S, Hjalgrim H, Glimelius B, Rostgaard K, Pukkala E, Askling J. Incidence of non-Hodgkin's lymphoma in Sweden, Denmark, and Finland from 1960 through 2003: an epidemic that was. Cancer Epidemiol Biomarkers Prev. 2006;15(7):1295–300. doi: 10.1158/1055-9965.EPI-05-0958. [DOI] [PubMed] [Google Scholar]
- (4).VAN DE Schans SA, Issa DE, Visser O, Nooijen P, Huijgens PC, Karim-Kos HE, et al. Diverging trends in incidence and mortality, and improved survival of non-Hodgkin's lymphoma, in the Netherlands, 1989–2007. Ann Oncol. 2012;23(1):171–82. doi: 10.1093/annonc/mdr055. [DOI] [PubMed] [Google Scholar]
- (5).Viel JF, Fournier E, Danzon A. Age-period-cohort modelling of non-Hodgkin's lymphoma incidence in a French region: a period effect compatible with an environmental exposure. Environ Health. 2010;9:47. doi: 10.1186/1476-069X-9-47. [DOI] [PMC free article] [PubMed] [Google Scholar]
- (6).Bosetti C, Levi F, Ferlay J, Lucchini F, Negri E, La VC. Incidence and mortality from non-Hodgkin lymphoma in Europe: the end of an epidemic? Int J Cancer. 2008;123(8):1917–23. doi: 10.1002/ijc.23722. [DOI] [PubMed] [Google Scholar]
- (7).Devesa SS, Silverman DT, Young JL, Jr., Pollack ES, Brown CC, Horm JW, et al. Cancer incidence and mortality trends among whites in the United States, 1947–84. J Natl Cancer Inst. 1987;79(4):701–70. [PubMed] [Google Scholar]
- (8).Howe HL, Wingo PA, Thun MJ, Ries LA, Rosenberg HM, Feigal EG, et al. Annual report to the nation on the status of cancer (1973 through 1998), featuring cancers with recent increasing trends. J Natl Cancer Inst. 2001;93(11):824–42. doi: 10.1093/jnci/93.11.824. [DOI] [PubMed] [Google Scholar]
- (9).Hartge P, Devesa SS. Quantification of the impact of known risk factors on time trends in non-Hodgkin's lymphoma incidence. Cancer Res. 1992;52(19 Suppl):5566s–9s. [PubMed] [Google Scholar]
- (10).Eltom MA, Jemal A, Mbulaiteye SM, Devesa SS, Biggar RJ. Trends in Kaposi's sarcoma and non-Hodgkin's lymphoma incidence in the United States from 1973 through 1998. J Natl Cancer Inst. 2002;94(16):1204–10. doi: 10.1093/jnci/94.16.1204. [DOI] [PubMed] [Google Scholar]
- (11).Grulich AE, van Leeuwen MT, Falster MO, Vajdic CM. Incidence of cancers in people with HIV/AIDS compared with immunosuppressed transplant recipients: a meta-analysis. Lancet. 2007;370(9581):59–67. doi: 10.1016/S0140-6736(07)61050-2. [DOI] [PubMed] [Google Scholar]
- (12).Engels EA, Pfeiffer RM, Goedert JJ, Virgo P, McNeel TS, Scoppa SM, et al. Trends in cancer risk among people with AIDS in the United States 1980–2002. AIDS. 2006;20(12):1645–54. doi: 10.1097/01.aids.0000238411.75324.59. [DOI] [PubMed] [Google Scholar]
- (13).Centers for Disease Control and Prevention 1993 revised classification system for HIV infection and expanded surveillance case definition for AIDS among adolescents and adults. MMWR Recomm Rep. 1992;41(RR-17):1–19. [PubMed] [Google Scholar]
- (14).Shiels MS, Cole SR, Wegner S, Armenian H, Chmiel JS, Ganesan A, et al. Effect of HAART on incident cancer and noncancer AIDS events among male HIV seroconverters. J Acquir Immune Defic Syndr. 2008;48(4):485–90. doi: 10.1097/QAI.0b013e31817dc42b. [DOI] [PMC free article] [PubMed] [Google Scholar]
- (15).Shiels MS, Pfeiffer RM, Hall HI, Li J, Goedert JJ, Morton LM, et al. Proportions of Kaposi sarcoma, selected non-Hodgkin lymphomas, and cervical cancer in the United States occurring in persons with AIDS, 1980–2007. JAMA. 2011;305(14):1450–9. doi: 10.1001/jama.2011.396. [DOI] [PMC free article] [PubMed] [Google Scholar]
- (16).Marcos-Gragera R, Pollan M, Chirlaque MD, Guma J, Sanchez MJ, Garau I. Attenuation of the epidemic increase in non-Hodgkin's lymphomas in Spain. Ann Oncol. 2010;21(Suppl 3):iii90–iii96. doi: 10.1093/annonc/mdq088. [DOI] [PubMed] [Google Scholar]
- (17).Eheman C, Henley SJ, Ballard-Barbash R, Jacobs EJ, Schymura MJ, Noone AM, et al. Annual Report to the Nation on the status of cancer, 1975–2008, featuring cancers associated with excess weight and lack of sufficient physical activity. Cancer. 2012;118(9):2338–66. doi: 10.1002/cncr.27514. [DOI] [PMC free article] [PubMed] [Google Scholar]
- (18).Surveillance Epidemiology and End Results [SEER] program . SEER*Stat Database: Incidence - SEER 11 Regs excluding Iowa. Custom Data (HIV/AIDS flags), Nov 2010 Sub (1992–2008) <Standard and CDC AIDS and HIV population>. National Cancer Institute, DCCPS, Surveillance Research Program, Cancer Statistics Branch; [Google Scholar]
- (19).Clarke CA, Glaser SL. Population-based surveillance of HIV-associated cancers: utility of cancer registry data. J Acquir Immune Defic Syndr. 2004;36(5):1083–91. doi: 10.1097/00126334-200408150-00012. [DOI] [PubMed] [Google Scholar]
- (20).World Health Organization . International Classification of Diseases for Oncology. 3rd edition World Health Organization; Geneva: 2000. [Google Scholar]
- (21).Morton LM, Turner JJ, Cerhan JR, Linet MS, Treseler PA, Clarke CA, et al. Proposed classification of lymphoid neoplasms for epidemiologic research from the Pathology Working Group of the International Lymphoma Epidemiology Consortium (InterLymph) Blood. 2007;110(2):695–708. doi: 10.1182/blood-2006-11-051672. [DOI] [PMC free article] [PubMed] [Google Scholar]
- (22).World Health Organization Classificatoin of Tumours of Haematopoietic and Lymphoid Tissues. Vol. 2012. IARC Press; Lyon, France: 2008. [Google Scholar]
- (23).Harrison KM, Kajese T, Hall HI, Song R. Risk factor redistribution of the national HIV/AIDS surveillance data: an alternative approach. Public Health Rep. 2008;123(5):618–27. doi: 10.1177/003335490812300512. [DOI] [PMC free article] [PubMed] [Google Scholar]
- (24).Green TA. Using surveillance data to monitor trends in the AIDS epidemic. Stat Med. 1998;17(2):143–54. doi: 10.1002/(sici)1097-0258(19980130)17:2<143::aid-sim757>3.0.co;2-y. [DOI] [PubMed] [Google Scholar]
- (25).Kim HJ, Fay MP, Feuer EJ, Midthune DN. Permutation tests for joinpoint regression with applications to cancer rates. Stat Med. 2000;19(3):335–51. doi: 10.1002/(sici)1097-0258(20000215)19:3<335::aid-sim336>3.0.co;2-z. [DOI] [PubMed] [Google Scholar]
- (26).National Cancer Institute . Joinpoint Regression Program. 2012. [Google Scholar]
- (27).Kohler BA, Ward E, McCarthy BJ, Schymura MJ, Ries LA, Eheman C, et al. Annual report to the nation on the status of cancer, 1975–2007, featuring tumors of the brain and other nervous system. J Natl Cancer Inst. 2011;103(9):714–36. doi: 10.1093/jnci/djr077. [DOI] [PMC free article] [PubMed] [Google Scholar]
- (28).Morton LM, Wang SS, Cozen W, Linet MS, Chatterjee N, Davis S, et al. Etiologic heterogeneity among non-Hodgkin lymphoma subtypes. Blood. 2008;112(13):5150–60. doi: 10.1182/blood-2008-01-133587. [DOI] [PMC free article] [PubMed] [Google Scholar]
- (29).Shiels MS, Pfeiffer RM, Gail MH, Hall HI, Li J, Chaturvedi AK, et al. Cancer burden in the HIV-infected population in the United States. J Natl Cancer Inst. 2011;103(9):753–62. doi: 10.1093/jnci/djr076. [DOI] [PMC free article] [PubMed] [Google Scholar]
- (30).HIV surveillance--United States, 1981–2008. MMWR Morb Mortal Wkly Rep. 2011;60(21):689–93. [PubMed] [Google Scholar]
- (31).Biggar RJ, Engels EA, Frisch M, Goedert JJ. Risk of T-cell lymphomas in persons withAIDS. J Acquir Immune Defic Syndr. 2001;26(4):371–6. doi: 10.1097/00126334-200104010-00015. [DOI] [PubMed] [Google Scholar]
- (32).Morton LM, Wang SS, Devesa SS, Hartge P, Weisenburger DD, Linet MS. Lymphoma incidence patterns by WHO subtype in the United States, 1992–2001. Blood. 2006;107(1):265–76. doi: 10.1182/blood-2005-06-2508. [DOI] [PMC free article] [PubMed] [Google Scholar]
- (33).Pileri SA, Leoncini L, Falini B. Revised European-American Lymphoma Classification. Curr Opin Oncol. 1995;7(5):401–7. [PubMed] [Google Scholar]
- (34).World Health Organization Classification of Tumours: Pathology and Getnetics of Tumours of Hematopoietic and Lymphoid Tissues. IARC Press; Lyon, France: 2001. [Google Scholar]
- (35).Diamond C, Taylor TH, Im T, Wallace M, Saven A, Anton-Culver H. How valid is using cancer registries' data to identify acquired immunodeficiency syndrome-related non-Hodgkin's lymphoma? Cancer Causes Control. 2007;18(2) doi: 10.1007/s10552-006-0096-5. [DOI] [PubMed] [Google Scholar]
Associated Data
This section collects any data citations, data availability statements, or supplementary materials included in this article.


