Abstract
The purpose was to examine sighs and spontaneous pauses in regard to the stability of resting breathing in the B6 strain, compared to the A/J strain. A 5-HT1A receptor agonist (buspirone) and a chromosomal substitution strain (B6a1) were used to further alter breathing patterning. Ten-minute recordings of room air breathing were collected from unanaesthetized B6, A/J, and B6a1 mice. Despite no differences between strains in the magnitude and incidence of sighs, post-sigh apneas, the variation for duration of expiration (Te) after sighs, and the number of spontaneous pauses were greater in the B6, while Shannon Entropy (nonlinear metrics) for Te after sighs was lower in B6, compared to the other strains. Buspirone and chromosomal substitution eliminated post-sigh apneas and decreased spontaneous pauses. A greater irregularity and the lower complexity of post-sigh breathing in B6 are reversed by elements on A/J Chromosome 1 and by increased 5-HT1A serotonergic tone.
Keywords: apnea, sighs, periodic breathing, respiratory control
1. Introduction
The study of resting breathing and its stability over time represents an opportunity to judge if and how a respiratory control system operates to maintain a homeostatic breathing pattern. The augmented breath, or sigh, is a perturbation that momentarily changes the operating set-points for breath production (Perez-Padilla et al. 1983). While the exact origin of spontaneous sighs may be multi-factoral, respiratory pauses and/or a slower breath frequency are observed after sighs and are considered to be due to chemomodulation, or to Hering Bruer reflex inhibition of inspiration via vagal stimulation from stretch receptors. In a study of human infants, Baldwin et al. concluded that sighs indicate a level of maturity and functional integrity of the neurorespiratory feedback control, and proposed sighs as being involved in the regulation and resetting of the neurorespiratory controller (Baldwin et al. 2004). Furthermore, post-sigh events are proposed to distinguish between health and disease. Differences in the autonomic responses to sighs and post-sigh breathing behavior in victims of sudden infant death syndrome exist when compared to their healthy peers (Kahn et al. 1988; Franco et al. 2003). Sighs are altered by behavioral states. In an animal study, sighs were seen during sleep in 129/Sv mice, some sighs were followed by respiratory pauses (post-sigh apnea), and these observations were changed by sleep stage and gas condition (Nakamura et al. 2003). Taken together, the occurrence of sighs appears to be a window into the stability of the neurorespiratory system.
Genetic background influences respiratory control and breathing behavior in a dynamic manner. The common mouse strain, C57BL/6J (B6), show post-hypoxic frequency decline (PHFD), a phenomenon in which frequency falls below baseline values after hypoxic exposure, that contrasts to the short-term potentiation (STP), a phenomenon in which ventilation remains elevated above baseline values after hypoxic exposure, observed in the common A/J strain (Han et al. 2001). Furthermore, after hypoxic exposure, B6 mice exhibit irregular breathing including periodic breathing during reoxygenation after hypoxic exposure, while A/J mice do not (Han et al. 2002). The difference in the B6 and A/J may represent a difference in respiratory control loop gain. With reoxygenation, the B6 overresponds (higher loop gain), resulting in an instability of breathing over time. Recently, the B6 has been recently reported to have spontaneous pauses at rest (Stettner et al. 2008b). In this study there were no comparisons to other strains. A detailed analysis of stability would also consider post-sigh behavior as well as spontaneous pauses, as well as some consideration of the potential for a structural difference in the pattern of breathing over time.
The first hypothesis involved a comparison of B6 and A/J mice and posited a difference in breathing events (sighs and pauses) over time and, more specifically, a difference in how respiratory patterning responds to a sigh or a pause. That is, the B6 mouse should tend to show pauses along with post-sigh apneas and/or irregular breathing at rest. Results were compared to those from the B6a1 strain, a chromosomal substitution strain, which has the genetic background of the B6 but for chromosome 1 from the A/J. This B6a1 strain shows an absence of post-hypoxic irregular breathing (Strohl et al. 2007). This comparison extends the hypothesis to determine if the differences between the A/J and B6 are genetic rather than epigenetic in origin. The second hypothesis was that buspirone, a 5-hydroxytryptamine 1A (5-HT1A) receptor agonist, would modulate stability and post-sigh breathing behavior in the B6 mouse at rest, based on the observation that this drug improves post-hypoxic irregular breathing (Yamauchi et al. 2007b) and a second, recent study indicating that another 5-HT1A receptor agonist, 8-OH-DPAT, will abolish spontaneous apneas in B6 strain (Stettner et al. 2008a). To evaluate breathing both linear and nonlinear analysis methods were adopted. Investigation of nonlinear dynamics provides insight into the predictability of the respiratory control systems. We compared ventilatory behavior surrounding sighs and post-sigh behavior to ventilatory behavior surrounding spontaneous pauses among these strains.
2. Methods
2.1. Animals
Experiments were performed using unanaesthetized male B6 and A/J mice (Jackson Laboratory, Bar Harbor, ME), and B6a1 mice (Case Western Reserve University, Cleveland, OH). Sample size for each strain was six animals. Animals were housed in the Louis Stokes DVA Medical Center (LSDVAMC) Animal Research Facility for at least three weeks before investigation (food and water ad libitum; with a 7 AM–7 PM and 7 PM–7 AM light-dark cycle). Age was matched at 3.5 months across strains. The experimental protocols were approved by the LSDVAMC Animal Care and Use Committee and were in agreement with the National Institutes of Health Guide for the Care and Use of Laboratory Animals.
2.2. Experimental protocols
Measurements were made between 10:00 AM and 12:00 PM in order to limit the effect of circadian rhythm. All experiments were carried out when the animals appeared quietly awake, as determined by behavioral observation. The day before testing, mice were put into the chambers from 10:00 AM to 12 PM, but did not undergo testing. After testing hours, they were returned to the Animal Resource Facility. The next day animals were weighed and then placed in the test apparatus at approximately 10:00 AM for a 60-min acclimatization period. At 11:00 AM, the 10-minute data collection period investigating resting breathing in room air began.
On separate days, testing was performed to evaluate the effects of buspirone on respiratory behavior in the B6 strain. The mice received an intraperitoneal injection (i.p.) of either vehicle (saline; pH 7.2) or buspirone dissolved in saline with sodium hydroxide at a dose of 5 mg/kg, resulting in a pH of 7.2. We used this dose because a preliminary study indicated that this dose of buspirone eliminated post-hypoxic periodic breathing (Yamauchi et al. 2007b). The volume of the injection was body weight (g) / 60 cc, or usually 0.4 to 0.5 ccs. Approximately 25-minutes later the animals underwent testing of room air resting breathing for 10-minutes.
Body temperature was then immediately measured with a thermocouple inserted rectally to a depth of 1 cm. Before collecting data, O2 consumption (V̇O2) and CO2 production (V̇CO2) were measured in room air by the open-circuit method (Han et al. 2001).
2.3. Measurements of ventilatory behavior
Ventilatory behavior was measured by placing the animals in a round Lucite chamber (600-ml volume). An outlet port was connected to a vacuum sufficient to create a bias flow of 300 ml/min through the chamber, as measured by a flow rotameter. The chamber was connected to one side of a pressure transducer (Validyne DP45, Validyne Engineering, CA) with a sensitivity of ± 2 cm H2O, referenced to a chamber of equal volume. As the animal breathed, swings in chamber pressure were recorded and then processed as a voltage signal. Comparison of this voltage signal to calibration volumes permitted an estimation of values that would represent tidal volume (VT). For each animal, the calibration volumes before and after each testing period and the voltage signals were recorded on a strip-chart recorder (Linearecorder WR3320, Graphtec, Irvine, CA) and stored in a computer with custom written respiratory acquisition software (LabView programming by Innovative Computer Engineering [I.C.E], Cleveland, OH). With the chamber empty, a calibration volume of 0.22 ml of air was repeatedly introduced into the chamber before and after data collection. Other calibration volumes above and below this volume were also routinely performed as a quality control for the linearity of the voltage signal.
2.4. Analysis
2.4.1. Baseline Respiratory and Metabolic Measurements
Baseline respiratory and metabolic measurements were compared between strains and between B6s treated with saline and buspirone. This included frequency (f) defined as an average of breath by breath frequency (f: breaths/min; 60/ [Ti + Te] (sec)), tidal volume (VT) adjusted for body weight (VT / body weight; ul • g −1), minute ventilation: V̇E (f • VT; ml • min−1 • g−1), oxygen consumption (V̇O2; ml • min−1 • g−1 • 10−2), carbon dioxide production (V̇CO2; ml • min−1 • g−1 • 10−2), body temperature (°C), body weight (g), respiratory quotient (V̇CO2/V̇O2; unitless). Frequency (f), VT, and their product V̇E were computed from periods of stable breathing, encompassing at least 15 stable breaths.
2.4.2. Post-sigh Breathing Behavior
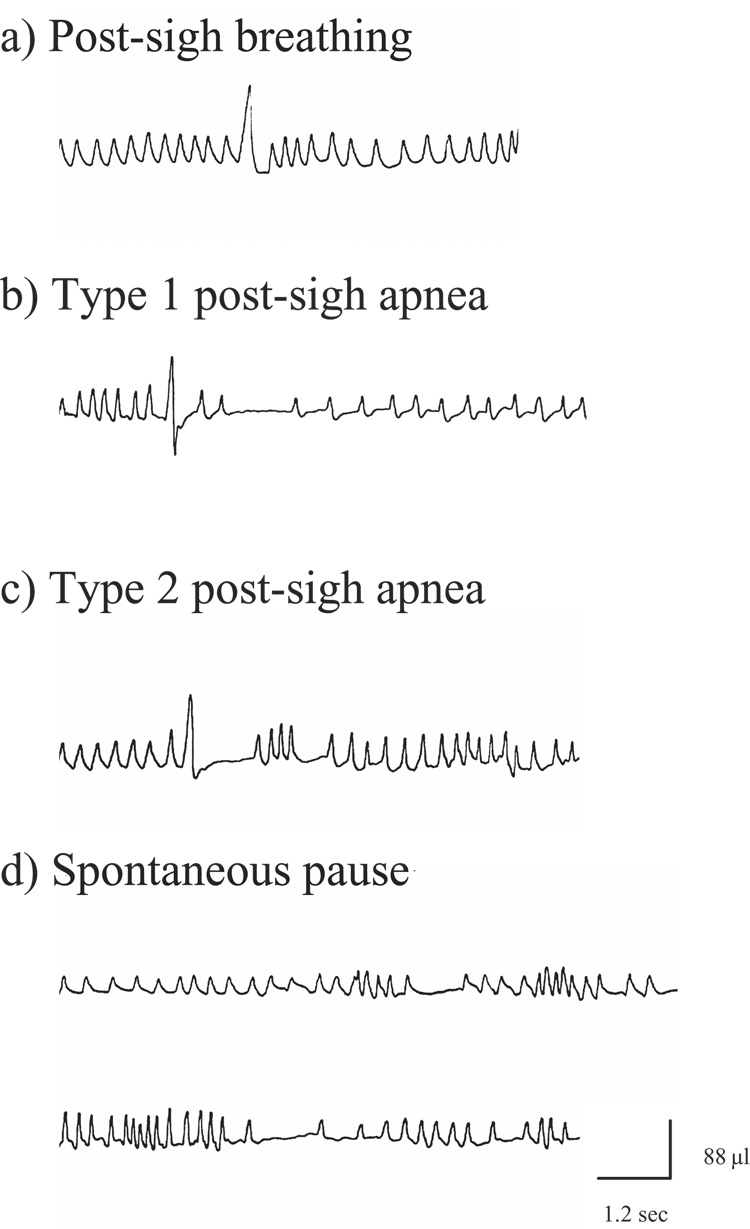
All data collected during the 10-minute period of room air breathing were scored for the variables mentioned previously. A sigh was defined as a breath with amplitude 100% above the average of the preceding 6 seconds of breathing (Fig. 1a). Sniffs and erratic breathing indicative of grooming were excluded from the analysis as described in previous studies (Yamauchi et al. 2007a). If more than 50% of a 6 second window before and after the sigh contained signs of sniffs and/or erratic breathing indicative of grooming, the sigh was excluded from analysis. A post-sigh apnea was defined as a cessation of plethysmographic signals for at least two respiratory cycles following a sigh. A breathing pause immediately after a sigh was measured as the interval sigh peak to next breath peak. Previous studies have classified “sighs” into several types depending upon the presence of a subsequent apnea (Hoch et al. 1998; Nakamura et al. 2003). Similar to these studies, in the present study a post-sigh apnea was classified into one of two types. A Type 1 apnea was defined as an apnea that occurred following several normal breaths after the sigh (Fig. 1b). A Type 2 apnea was defined as an apnea immediately following a sigh (Fig. 1c). Expiratory time (Te) was compared for all breathes occurring 20-seconds after each suitable sigh.
Figure 1.
Examples of post-sigh breathing behavior and spontaneous pause. Definitions of Type 1 and Type 2 post-sigh apnea are found in the text.
To assess the effect of a sigh on breathing stability the coefficient of variation (CV as calculated by [standard deviation / mean] • 100)) was computed for Te both before and after a sigh. The effect of a sigh on breathing stability was determined by examining the absolute increase of CV before a sigh to after the sigh. Further, VT was calculated for each sigh. In order to compensate for the effect of prior breathing on the magnitude of the sigh, VT divided by the VT for the prior six-seconds of breathing was additionally calculated. We also computed the Shannon Entropy for the distribution (histogram) of Te values generated for 20 seconds before and after each sigh. Values were pooled by strain (A/J, B6a1, and B6) or treatment, saline or Buspirone injection for the B6s. Let X be a time series taking a finite number of possible values x1, x2, …, xn. Now, let k1, k2, …, kn be the number of times X takes on the values x1, x2, …, xn, respectively. The probability of occurrence of xi given the time series X can be computed as,
Next, the Shannon Entropy (Shannon et al. 1964) of the time series X is computed as,
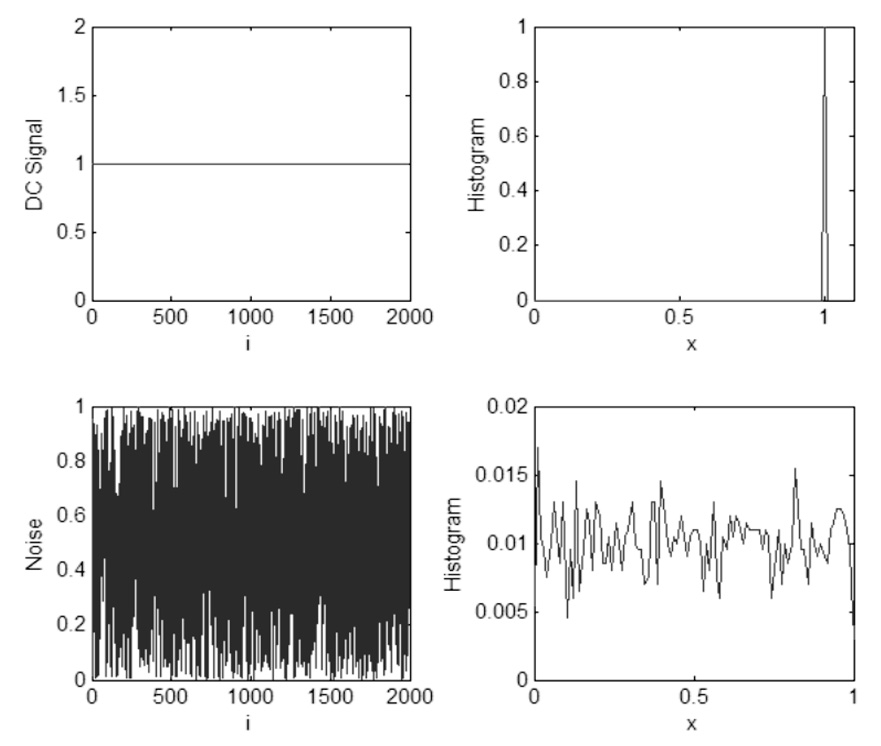
Shannon Entropy is used to measure the complexity of the time series patterns of breathing by quantify differences in the distribution of temporal breathing patterns before and after sighs. Alternatively, Shannon Entropy can be viewed as the information content of the histogram of the breathing signal, and higher values of Shannon Entropy are thus indicative of more complex breathing patterns while lowers values are indicative of less complex and more predictable behaviors. Fig. 2 illustrates two test signals: a DC signal and an independent uniformly distributed random noise sequence. The corresponding Shannon Entropy values for these test signals were computed as 0 and 3.9, respectively. The histogram of the first signal reveals that the future sample of the signal would be known with 100% certainty, with Shannon Entropy at its lowest possible value of zero. The histogram of the second signal is almost uniformly distributed between 0 and 1 implying future sample of the signal between 0 and 1 occure with equal probability, and thus past values are not predictive of future values. Shannon Entropy is our analysis is used as a comparative measure of information content or complexity between time series patterns, where lower values of Shannon Entropy indicate greater predictability and less complexity.
Figure 2.
This illustrates two test signals: a DC signal and an independent uniformly distributed random noise sequence. 2000 sample points were processed for each case. The label ‘i’ in the first column represents the sample number of the signal. The label ‘x’ in the second column shows the possible values the given time series can take on as explained above. The y axis shows the probability of occurrence of the corresponding x value. Shannon Entropy is computed from these values as explained.
2.4.3. Spontaneous breath pause
Pauses in breathing within 20-seconds of a sigh were excluded from the analysis. Exclusion of these data was based on evidence from other portions of this study indicating that a sigh affects subsequent breathing. To assess breathing stability we counted the number of spontaneous pauses in respiration. A spontaneous pause was defined as a cessation of normal respiration for two or more respiratory cycles, as determined by respiratory rate for the prior six-seconds, or longer (Fig. 1d). The length of these pauses was recorded and was defined as the amount of time between the peak of one breath to the peak of the next. Besides absolute length, the length of a pause was also rescaled relative to the breathing rate for 6 seconds prior to the pause (i.e. calculation formula; absolute length / the average of [Ti + Te]).
The CV for Te was computed for both the 20-seconds before a spontaneous pause and for the 20-seconds after a spontaneous pause.
We computed the Shannon Entropy for the distributions of Te values within 20-seconds of a spontaneous pause for a given strain (A/J, B6a1, and B6) or B6/condition (control or injection with Buspirone).
In all cases one-way between groups ANOVAs were used to detect differences between the A/J, B6a1, and B6 strains with t-tests of estimated marginal means along with Sidak’s correction factor used as a post-hoc test. Separate sets of paired t-tests were used to detect differences between B6s treated with vehicle and B6s treated with Buspirone. If a variable demonstrated significant deviations from the assumptions of normality for ANOVAs or t-tests, Kruskal-Wallis, with Exact Rank Sums Tests was used for post-hoc analysis, or Mann-Whitney U Tests were used in their place, respectively. Ranked sums for all possible strain pairs associated with the Kruskal-Wallis tests compared were Exact Rank Sums Tests. To compensate for the increase in Type I error associated with multiple tests, results of the Wilcoxon signed rank tests were considered significant only if alpha exceeded 0.01667 in accordance with the recommendation by Dunn (Dunn 1964; Jaccard et al. 1997).
3. Results
3.1. Baseline respiratory and metabolic measurements
As presented in Table 1, F, VT and V̇E adjusted for body weight, and body weight were similar among all three strains. However compared to the A/J strain, the B6s’ body weight adjusted V̇CO2s, body temperatures, and RQs were significantly higher. Ventilation for any given CO2 production or O2 consumption (V̇E/V̇O2, V̇E/V̇CO2) was significantly lower in the B6 as compared to the A/J. Moreover, compared to the B6a1, body weight adjusted V̇O2 and V̇CO2, and body temperature were significantly higher. V̇ E/V̇O2 and V̇E/V̇CO2 were significantly lower in the B6. Buspirone significantly increased f, body weight adjusted VT and V̇E, and V̇E/V̇O2, and V̇E/V̇CO2.
Table 1.
Baseline respiratory and metabolic measurements
| A/J | B6a1 | B6 | B6 with saline | B6 with Buspirone | |
|---|---|---|---|---|---|
| f, breaths/min | 205.7 ± 10.8 | 204.2 ± 15.7 | 199.1 ± 22.9 | 209.8 ± 21.3 | 286.5 ± 20.1 §§ |
| VT /body wt, µl • g−1 | 1.38 ± 0.18 | 1.24 ± 0.19 | 1.20 ± 0.15 | 1.29 ± 0.22 | 1.60 ± 0.21 § |
| V̇E / body wt, ml • min−1 • g−1 | 0.29 ± 0.04 | 0.25 ± 0.05 | 0.24 ± 0.02 | 0.27 ± 0.06 | 0.46 ± 0.09 §§ |
| V̇O2 / body wt, ml • min−1 • g−1 • 10−2 | 8.54 ± 0.77 | 7.74 ± 0.91 | 9.58 ± 0.84 †† | 9.74 ± 0.97 | 11.21 ± 0.97 |
| V̇CO2 / body wt, ml • min−1 • g−1 • 10−2 | 4.49 ± 0.60 | 4.48 ± 0.25 | 5.64 ± 0.60 ††** | 5.94 ± 0.86 | 7.08 ± 0.77 |
| Body Temperature, °C | 36.0 ± 0.4 | 35.7 ± 0.1 | 36.5 ± 0.1 ††* | 36.5 ± 0.2 | 36.3 ± 0.4 |
| Body weight, g | 25.2 ± 1.7 | 26.6 ± 2.1 | 26.1 ± 1.8 | 26.6 ± 1.8 | 26.5 ± 2.2 |
| RQ | 0.52 ± 0.04 | 0.58 ± 0.05 | 0.59 ± 0.04 * | 0.61 ± 0.09 | 0.63 ± 0.04 |
| V̇E / V̇O2 | 3.34 ± 0.43 | 3.30 ± 0.58 | 2.48 ± 0.20 †* | 2.78 ± 0.56 | 4.10 ± 0.58 §§ |
| V̇E / V̇CO2 | 6.41 ± 1.08 | 5.66 ± 0.93 | 4.23 ± 0.43 †** | 4.65 ± 1.17 | 6.51 ± 0.83 |
Values are mean ± SD, One-Way ANOVA was performed to detect strain differences (A/J, B6a1, and B6). Paired t-tests were performed to evaluate the effect of buspirone.
Significant differences from A/Js (*<0.05, ** <0.01).
Significant differences from B6a1s (†<0.05, ††<0.01).
Significant difference from saline treated animals (§<0.05, §§ <0.01)
3.2. Strain differences in Post-Sigh breathing behavior and buspirone effects
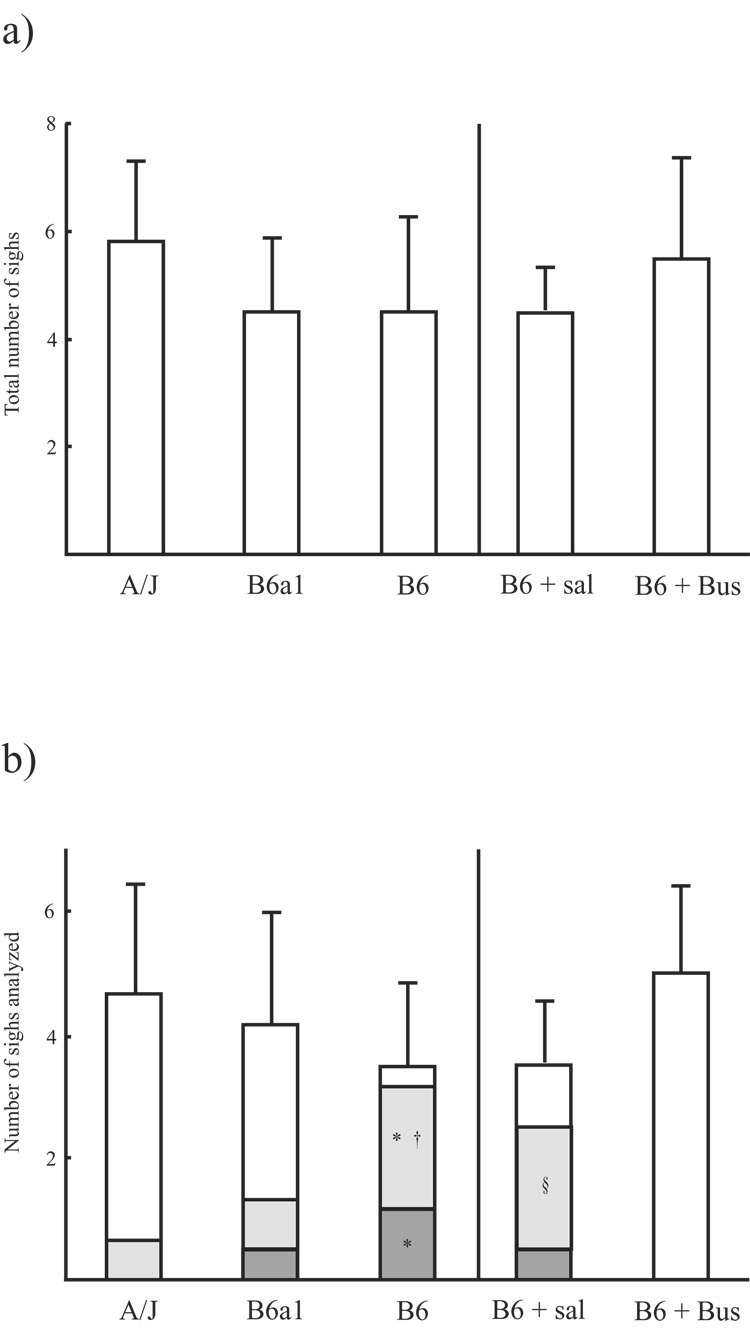
No statistical difference in the number of sighs was observed when comparing strains during the 10-minute recording period (5.8 ± 1.5 sighs in A/J strain, 4.5 ± 1.4 sighs in B6a1 strain, and 4.5 ± 1.8 sighs in B6 strain, p = 0.257; Fig. 3a). Subsequent analyses in each strain were performed on 4.7 ± 1.8, 4.2 ± 1.8, and 3.5 ± 1.4 sighs, respectively. The number of sighs observed was similar between the saline and buspirone treatment groups (4.5 ± 0.8, 5.5 ± 1.9, respectively; p = 0.296; Fig. 3a); among these sigh, 3.5 ± 1.0 and 5.0 ± 1.4 were suitable for analysis, respectively. Type 1 apneas were seen significantly more often in the B6s than the A/Js and B6a1s (p < 0.05 for both), Type 2 apneas were also seen more often in the B6s than the A/Js (p < 0.05). Buspirone completely eliminated Type 1 and Type 2 Post- sigh apneas (Fig. 3b).
Figure 3.
These two figures represent a) number of observed sighs (top graph) and b) number of analyzed sigh and a type of post-sigh breathing (bottom graph). Each bar represents values as mean ± SD. In Figure b), the sections inside each bar indicate the mean value for post-sigh breathing without apnea (white), type 1 post-sigh apnea (gray), and type 2 post-sigh apnea (dark). B6 + Sal: saline treated B6 mice, B6 + Bus: buspirone treated B6 mice. *: significant difference from A/J (p < 0.05), †: significant difference from B6a1 (p < 0.05), §: significant difference from B6+Bus (p < 0.05).
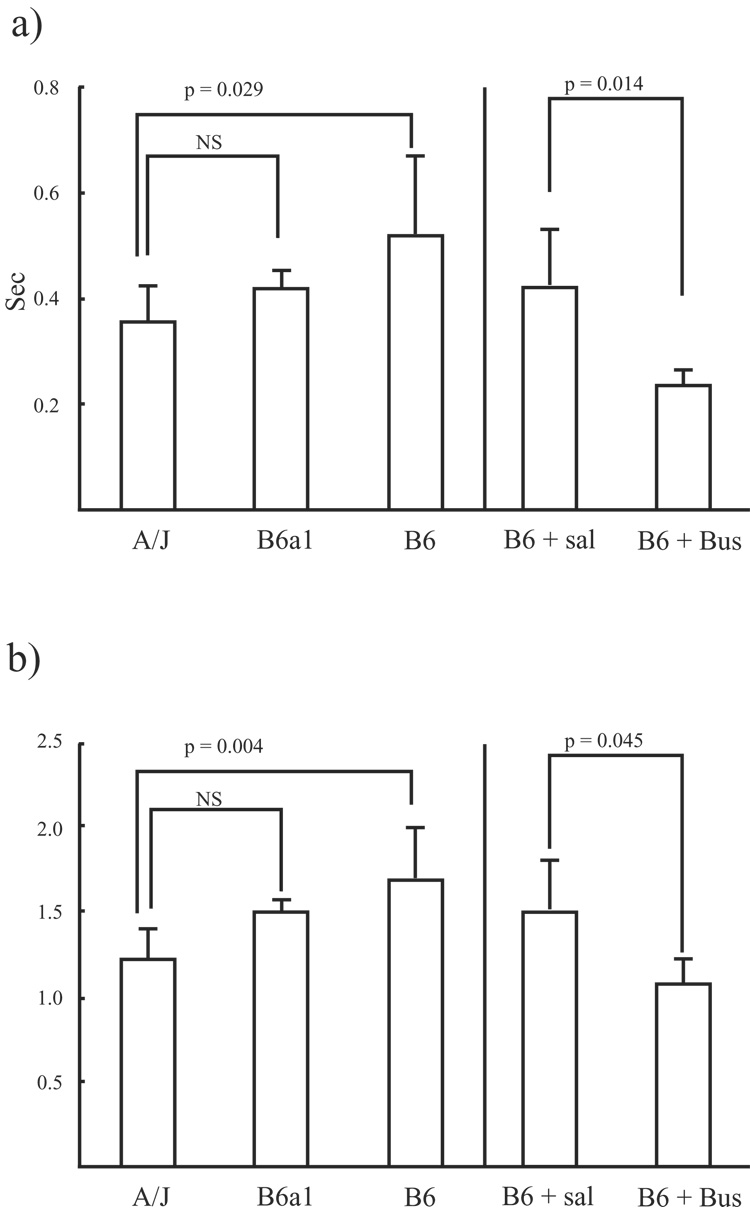
The VT for sighs adjusted by the VT for preceding breaths (relative magnitude of sigh) was similar between strains and between treatments. However, the absolute pause length immediately after a sigh as well as pause length adjusted by the preceding breathing frequency was significantly longer for the B6 than for the A/J (p = 0.029 and p = 0.004, respectively). Absolute and adjusted pause length for the B6a1s was similar to the lengths of the A/Js (Fig. 4a and 4b). Further, absolute pause length immediately after a sigh, as well as pause length adjusted by preceding breathing frequency was significantly shorter for buspirone treated B6 mice than for saline treated B6 mice (p = 0.014 and p = 0.045, respectively; Fig. 4a and 4b).
Figure 4.
These two figures represent a) absolute length of post-sigh pause and b) pause length adjusted by the preceding breath frequency. Bars are mean ± SD. B6 + Sal: saline treated B6 mice, B6 + Bus: buspirone treated B6 mice.
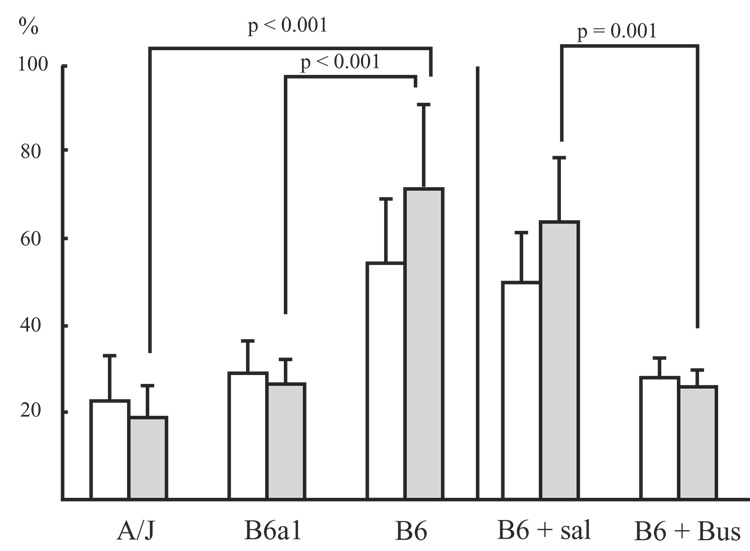
CV for Te during the 20-seconds after a sigh was significantly higher for the B6 as compared to the A/J and B6a1 (p < 0.001). Moreover, the absolute increase in CVs for the B6 was significantly larger than that for the A/J and B6a1 (p < 0.001). Buspirone significantly decreased the CVs for Te both before and after sighs (p = 0.005 and p = 0.001, respectively; Fig. 5). The absolute increase in CVs for the saline treated B6 was significantly larger than that for buspirone treated B6 (p = 0.026; Fig. 5).
Figure 5.
Shown are the mean (± SD) for Coefficient of variation (CV) for expiratory time (Te) before and after sigh. White bar represents CVs for Te before sighs. Gray bar represents CVs for after sighs. B6 + Sal: saline treated B6 mice, B6 + Bus: buspirone treated B6 mice.
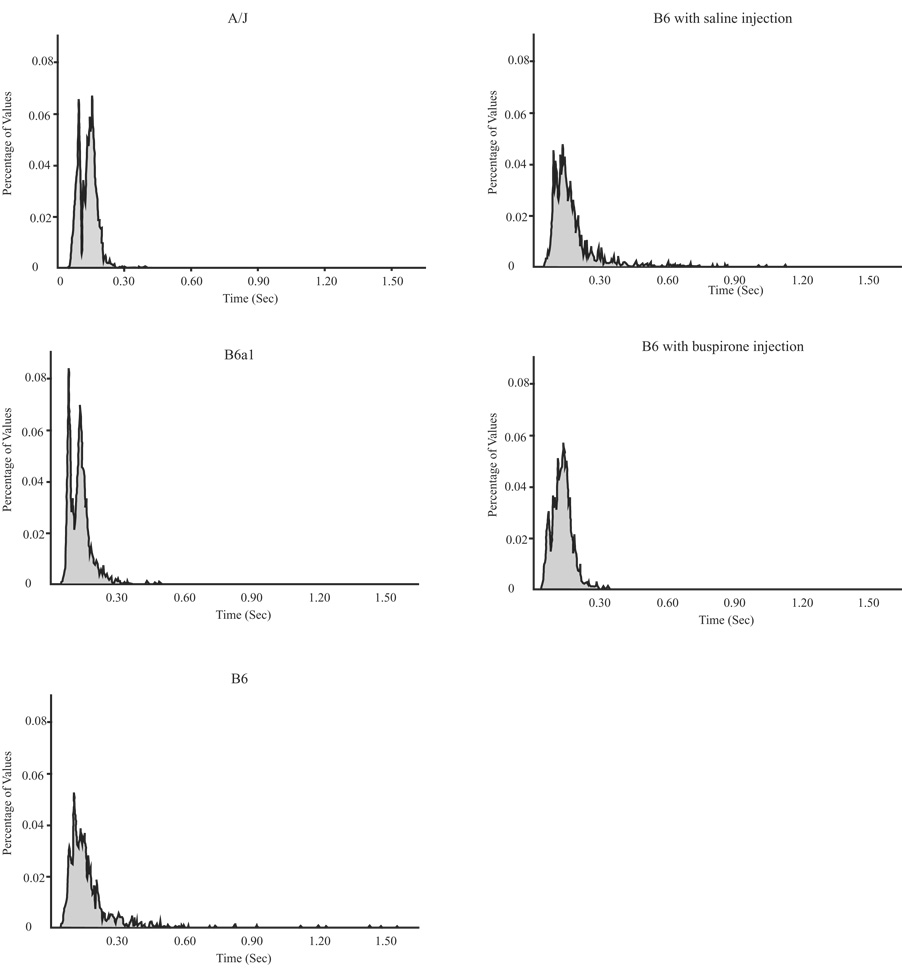
The Shannon Entropy values for Te by strain and by treatment are presented in Table 2. The lowest Shannon Entropy value is present in the B6 after a sigh; the highest were in the B6 treated with buspirone. In regard to strain differences before and after a sigh, the Shannon Entropy value was decreased substantially after sighs compared to before sighs in the B6. Thus, the B6 has a more predictable breathing pattern after sigh, as compared to the A/J or the B6a1 where values went slightly down or slightly up, respectively. As for the drug study, there were larger entropy values before a sigh with buspirone than with vehicle; however, there was little or no change in values after a sigh in either condition. The histograms on which the Shannon Entropy values after sigh were computed are shown in Fig. 6. The histograms of Te suggest that the B6 as well as the B6 treated with saline had a larger degree of variation for post-sigh Te than the A/J, B6a1, and the B6 treated with buspirone.
Table 2.
The Shannon Entropy values for Te by strain and by treatment
| A/J | B6a1 | B6 | B6 with saline | B6 with Buspirone | |
|---|---|---|---|---|---|
| Shannon Entropy for Te before sighs | 3.126 | 2.543 | 2.713 | 2.435 | 3.280 |
| Shannon Entropy for Te after sighs | 2.960 | 2.801 | 2.220 | 2.540 | 3.281 |
| Shannon Entropy for Te before spontaneous pauses | N/A | 2.595 | 2.634 | 2.083 | N/A |
| Shannon Entropy for Te after spontaneous pauses | N/A | 2.703 | 2.744 | 2.625 | N/A |
Figure 6.
Shown are histograms for Te values (sec) after sighs for all 5 conditions. The y-axis is expressed as the percent of total number of observations in each strain or condition.
3.3. Strain differences in Spontaneous pauses and buspirone effects
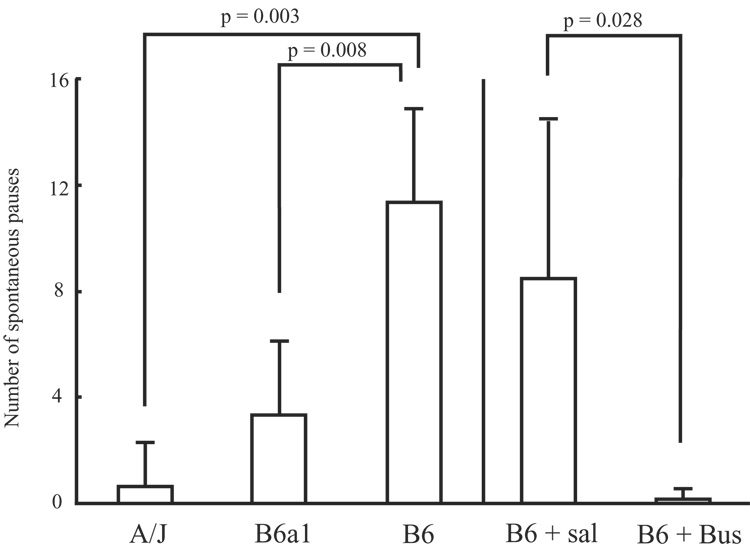
Significant differences were detected between strains for number of pauses (p = 0.002; Fig. 7). Non-parametric follow-up testing in the form of Mann-Whitney U tests for the number of pauses detected significant differences between the A/Js and B6s (p = 0.003), and between the B6a1s and B6s (p = 0.008). No significant difference was found between the A/Js and B6a1s for number of pauses. Wilcoxon-Rank Order tests detected significant differences in the number of pauses when comparing Buspirone and vehicle treated animals (p = 0.028; Fig. 7).
Figure 7.
The bars indicate the number of spontaneous pauses (mean ± SD) for each stain and each condition. B6 + Sal: saline treated B6 mice, B6 + Bus: buspirone treated B6 mice.
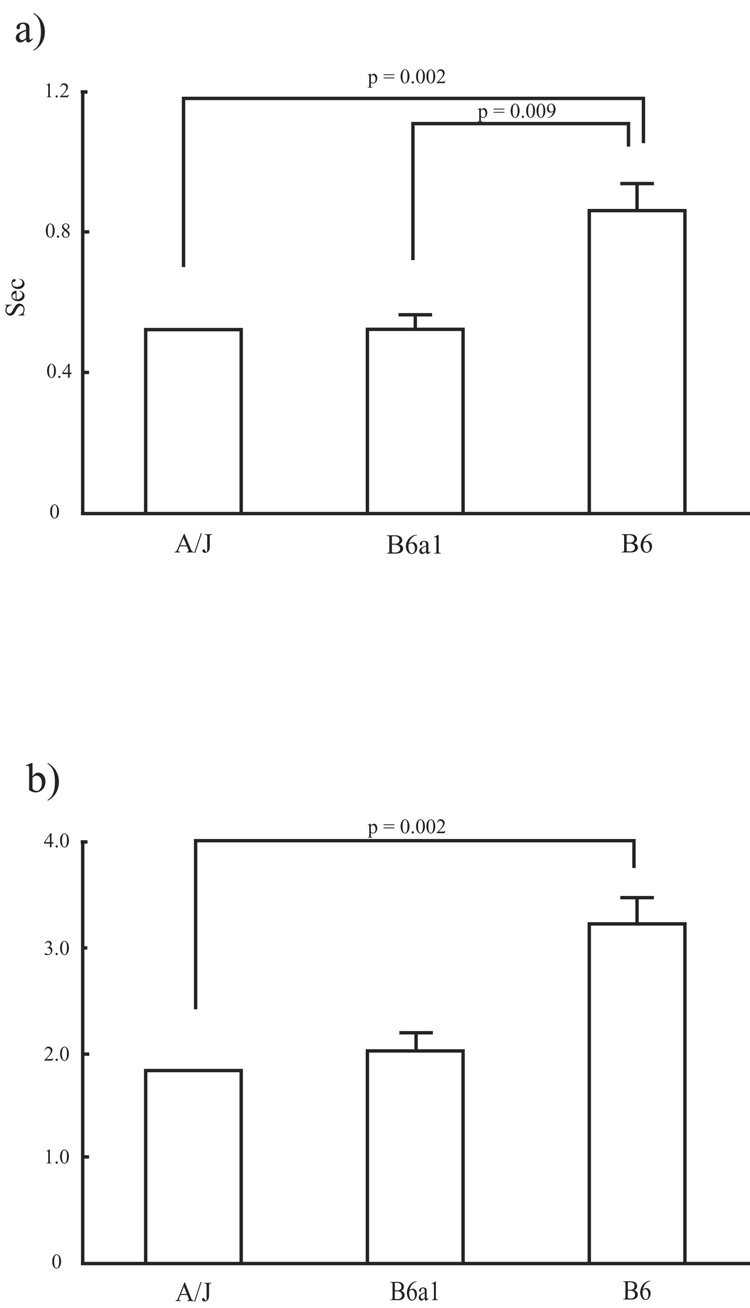
Significant differences among strains were detected, by way of Kuskal-Wallis non-parametric one-way ANOVAs, in the length of the pauses in absolute time (p = 0.001; Fig. 8a), and the length of pauses rescaled to prior breathing rate (p = 0.003; Fig. 8b). Post-hoc testing revealed that the A/Js and B6a1s were similar with regard to absolute pause length as well as pause length adjusted by pre-pause breathing rate. The B6s, however, showed differences when compared to both A/Js and B6a1s for absolute pause length (p = 0.002 and p = 0.009; respectively); however, the B6s significantly differed only with the A/Js in regard to relative pause length (p = 0.002).
Figure 8.
The two graphs indicate the a) absolute length of spontaneous pause (top) and b) pause length adjusted by the preceding breath frequency (bottom). Bars are mean ± SD.
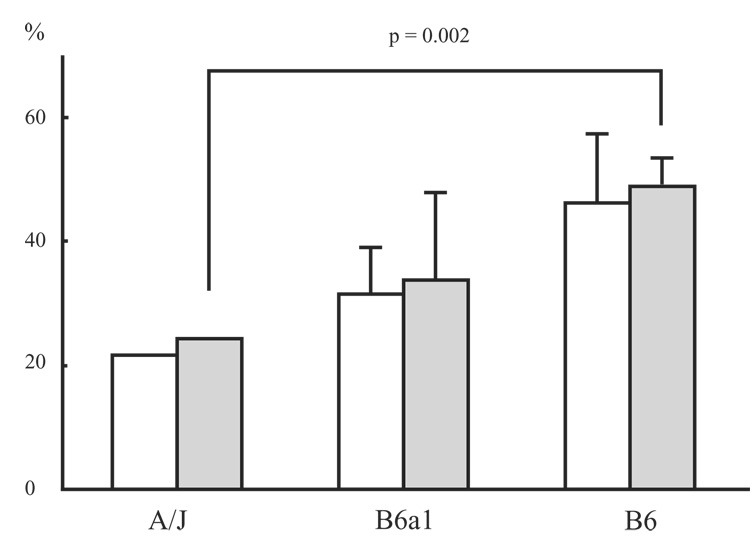
Significant differences were found for the CVs for Te after spontaneous pauses (p = 0.003). A/Js when compared to the B6a1s were similar with regard to their CVs after pauses (p = 0.240). CVs for Te after spontaneous pauses were significantly larger for the B6s than those of the A/Js (p = 0.002), but not the B6a1s. Contrary to the CV values for B6 before and after sighs, the CV values for B6 did not differ before and after spontaneous pauses (Fig. 9).
Figure 9.
shown is the coefficient of variation (CV) for expiratory time (Te) before and after spontaneous pauses in each other strains. White bar represents CVs for Te before pause. Gray bar represents CVs for after pause. Values are mean ± SD.
The one pause observed in one B6 treated with buspirone did not allow statistical analysis to be performed between control and treatment. No Shannon Entropy value could be arrived at for the A/Js. The Shannon Entropy values arrived at for the B6 and B6a1 animals suggest little differentiation between the two strains before and after spontaneous pauses (Table 2).
4. Discussion
The present study identified no significant differences between strains in the magnitude and incidence of sighs. However, the B6 mouse tended to show post-sigh apneas and longer pauses immediately after sighs compared to A/Js and in comparison to the chromosomal substitution strain mouse, B6a1. Furthermore, breathing was more irregular following a sigh in the B6 strain as indicated by higher CVs for frequency. Buspirone affected post-sigh breathing behavior in the B6 strain by shortening the post-sigh pause length and stabilizing post-sigh irregular breathing. The analysis using Shannon Entropy indicated that the B6 mouse showed lower complexity for Te values after sighs suggesting that the system response after a sigh is less complex or more predictable than in the A/J or B6a1 strain. Spontaneous pauses were seen more frequently and were longer in the B6 strain than in A/J and B6a1 strains; however, in contrast to ventilatory behavior around the sigh, spontaneous pauses did not affect subsequent breathing as measured by CV and the Shannon Entropy value.
Post-sigh apnea length has been reported to be dependently related to the magnitude of lung inflation (Romaniuk et al. 2007); however, in our study, there was no difference in the magnitude of sighs between strains. Components affecting the breathing behavior after a sigh could include chemosensitive modulation and/or the Hering-Breuer reflex arc, which is derived from pulmonary stretch receptors via vagus nerve to the medulla oblongata, suppressing respiratory drive. We have not demonstrated directly whether chemosensitivity or the Hering-Breuer reflex per se is different among strains, and either or both could be involved. With regard to the strain differences in post-sigh breathing behavior, the B6a1 strain was more similar to A/J strain than to the B6. Thus, some genes on chromosome 1 in the B6 are likely responsible for differences in post-sigh apnea and irregular breathing, but the response for sigh may not be monogenetic.
An integrative theory for the appearance of unstable breathing or periodic breathing is “elevated loop gain” (Khoo 2000; Khoo 2001). An increased tendency for the respiratory system to over respond (“underdamping”) is known to promote an unstable breathing pattern though an increased system response (Khoo 2001). Thus, as discussed in the Introduction, in terms of respiratory control, the B6 has ventilatory behavior characteristic of higher loop gain (underdamped) as compared to the A/J. In the present study, sighs occurring during resting breathing also induced an exaggerated response in the B6 including post-sigh irregular breathing and apnea as compared to the A/J strain.
In regard to spontaneous pauses, our findings confirm the findings in the recent study which first described that with plethysmography unanesthetized, unrestrained adult B6 mice will regularly exhibit spontaneous apneas; moreover this study reported with in situ recordings from respiratory outputs in the working heart-brainstem preparation the occurrence of pauses in respiratory rhythm generation (Stettner et al. 2007). However, we extend this study by study of comparison strains and a detailed analysis of patterning or post-sigh behavior. Our current study clearly demonstrates that there are genetic differences in post-sigh apneas and spontaneous pauses that, in part, are dependent on elements on Chromosome 1.
As well as genetic background, pharmacological approaches can modify breathing behavior. Systemic administration of the carbonic anhydrase inhibitor acetazolamide decreases hypercapnic ventilatory responsiveness (reducing loop gain) and improves irregular breathing during reoxygenation after hypoxic exposure in the B6 (Yamauchi et al. 2007a). Preliminary data presented in abstract form shows that buspirone stabilized post-hypoxic unstable breathing in the B6 strain (Yamauchi et al. 2007b). In the present study, buspirone stabilized post-sigh irregular breathing and eliminated the post-sigh apnea. Buspirone, which is a partial 5-HT 1A receptor agonist, modified the post-sigh breathing behavior in B6 strain. Moreover, in preliminary studies, intraperitoneal injection of buspirone decreased hypercapnic ventilatory responsiveness in B6 mice. Serotonergic drives and possibly 5-HT 1A receptor may have a role in the Hering-Breurer reflex as well as choemomodulation. For instance, electrical or chemical stimulation of the serotonergic raphe pallidus modulated the Hering-Breuer reflex when urethane was used in anesthetized adult rabbits (Li et al. 2006). Further, recent study has demonstrated that selective serotonergic lesion by PCA (p-chloroamphetamine) resulted in a sustained increase in the frequency and duration of post-sigh apneas during NREM sleep (Saponjic et al. 2007). The other neurotransmitters which may be able to affect post sigh breathing behavior would be nitric oxide (NO), as NO synthase inhibitor has been reported to worsen the post hypoxic irregular breathing in the B6 mouse (Price et al. 2003).
To more fully describe respiratory pattern, we applied nonlinear analysis in addition to CV. The potential value of using Shannon Entropy as an index of 'complexity' is that complexity appears to be lower in illness (Seely et al. 2004). Although histogram entropy for the B6 mouse was similar before and after spontaneous pauses, histogram entropy was significantly decreased after sighs despite a higher CV. Furthermore, histogram entropy for B6 mice after a sigh was lower than that for the A/J, B6a1, and B6 treated with buspirone. This finding suggests that the underlying complexity of the B6’s respiratory control system is reduced by a sigh, and relatively less complex compared to other conditions. Decreased complexity of biologic systems can be a marker of illness. For instance, heart rate entropy (Approximate Entropy) values are decreased in apparent life threatening events in infancy (Pincus et al. 1993), in ventricular dysfunction in postoperative patients (Fleisher et al. 1993), and in healthy individuals infused with endotoxin (Godin et al. 1996). Indeed, unlike the A/J that responds to reoxygenation after brief hypoxia with a return to regular breathing, the B6 will respond to the same challenge with periodic irregular breathing. The implication is that greater complexity, i.e. a less simple control system, promotes a more stable breathing pattern.
As for future directions, since our study was performed during wakefulness, the breathing behavior in sleep state needs to be examined in these strains. In the 129/Sv mouse, post-sigh apnea occurred mostly during slow wave sleep rather than during REM sleep. Furthermore, the occurrence of post-sigh apneas was increased in slow wave sleep under hypoxic conditions (Nakamura et al. 2003). Thus, sleep state may affect post-sigh breathing behavior, and may do so differently among different strains. Also, we do not know how much chemosensory conditions were changed after a single sigh and how much that change affected the breathing behavior. Methodology for continuous arterial blood gas monitoring in this animal model needs to be developed for the unanesthetized freely moving mouse to monitor gas exchange before and after a single sigh.
In conclusion, there are naturally occurring differences in post-sigh breathing behavior between B6 and A/J strains with B6 mice exhibiting post-sigh apnea more often than the other strains. Sighs, which can induce a dynamic change of ventilation, increased breathing irregularity and breathing predictability. This result implies a lower complexity of the respiratory system in the B6 strain during the post-sigh breathing period, a finding not observed in the A/J and B6a1 strains. Therefore, sighs and their impact on breathing patterns can be considered to be a window into the predictability of the respiratory system. In contrast, while spontaneous pauses were seen during wakefulness in the B6 strain, they did not change breathing pattern regularity or complexity. Buspirone modulates the post-sigh breathing behavior as well as spontaneous pauses in the B6 strain.
Acknowledgment
We are grateful to Dr. Thomas E. Dick for help in the review of this work.
Grants
This work is supported by a National Institute of Health Grant (NS052452) and the VA Research Service.
Disclosures
Dr. Motoo Yamauchi was supported by a traveling grant from Fuji Respironics Co. Ltd., Danny Risberg, President.
Footnotes
Publisher's Disclaimer: This is a PDF file of an unedited manuscript that has been accepted for publication. As a service to our customers we are providing this early version of the manuscript. The manuscript will undergo copyediting, typesetting, and review of the resulting proof before it is published in its final citable form. Please note that during the production process errors may be discovered which could affect the content, and all legal disclaimers that apply to the journal pertain.
References
- Baldwin DN, Suki B, Pillow JJ, Roiha HL, Minocchieri S, Frey U. Effect of sighs on breathing memory and dynamics in healthy infants. J Appl Physiol. 2004;97:1830–1839. doi: 10.1152/japplphysiol.00298.2004. [DOI] [PubMed] [Google Scholar]
- Dunn Multiple comparisons using rank sums. 1964 [Google Scholar]
- Fleisher LA, Pincus SM, Rosenbaum SH. Approximate entropy of heart rate as a correlate of postoperative ventricular dysfunction. Anesthesiology. 1993;78:683–692. doi: 10.1097/00000542-199304000-00011. [DOI] [PubMed] [Google Scholar]
- Franco P, Verheulpen D, Valente F, Kelmanson I, de Broca A, Scaillet S, Groswasser J, Kahn A. Autonomic responses to sighs in healthy infants and in victims of sudden infant death. Sleep Med. 2003;4:569–577. doi: 10.1016/s1389-9457(03)00107-2. [DOI] [PubMed] [Google Scholar]
- Godin PJ, Fleisher LA, Eidsath A, Vandivier RW, Preas HL, Banks SM, Buchman TG, Suffredini AF. Experimental human endotoxemia increases cardiac regularity: results from a prospective, randomized, crossover trial. Crit Care Med. 1996;24:1117–1124. doi: 10.1097/00003246-199607000-00009. [DOI] [PubMed] [Google Scholar]
- Han F, Subramanian S, Dick TE, Dreshaj IA, Strohl KP. Ventilatory behavior after hypoxia in C57BL/6J and A/J mice. J Appl Physiol. 2001;91:1962–1970. doi: 10.1152/jappl.2001.91.5.1962. [DOI] [PubMed] [Google Scholar]
- Han F, Subramanian S, Price ER, Nadeau J, Strohl KP. Periodic breathing in the mouse. J Appl Physiol. 2002;92:1133–1140. doi: 10.1152/japplphysiol.00785.2001. [DOI] [PubMed] [Google Scholar]
- Hoch B, Bernhard M, Hinsch A. Different patterns of sighs in neonates and young infants. Biol Neonate. 1998;74:16–21. doi: 10.1159/000014006. [DOI] [PubMed] [Google Scholar]
- Jaccard J, Becker MA. Statistics for the behavioral science Brooks/cole publishing company. Pacific Grove: 1997. [Google Scholar]
- Kahn A, Blum D, Rebuffat E, Sottiaux M, Levitt J, Bochner A, Alexander M, Grosswasser J, Muller MF. Polysomnographic studies of infants who subsequently died of sudden infant death syndrome. Pediatrics. 1988;82:721–727. [PubMed] [Google Scholar]
- Khoo MC. Determinants of ventilatory instability and variability. Respir Physiol. 2000;122:167–182. doi: 10.1016/s0034-5687(00)00157-2. [DOI] [PubMed] [Google Scholar]
- Khoo MC. Using loop gain to assess ventilatory control in obstructive sleep apnea. Am J Respir Crit Care Med. 2001;163:1044–1045. doi: 10.1164/ajrccm.163.5.ed1101c. [DOI] [PubMed] [Google Scholar]
- Li Y, Song G, Cao Y, Wang H, Wang G, Yu S, Zhang H. Modulation of the Hering-Breuer reflex by raphe pallidus in rabbits. Neurosci Lett. 2006;397:259–262. doi: 10.1016/j.neulet.2005.12.036. [DOI] [PubMed] [Google Scholar]
- Nakamura A, Fukuda Y, Kuwaki T. Sleep apnea and effect of chemostimulation on breathing instability in mice. J Appl Physiol. 2003;94:525–532. doi: 10.1152/japplphysiol.00226.2002. [DOI] [PubMed] [Google Scholar]
- Perez-Padilla R, West P, Kryger MH. Sighs during sleep in adult humans. Sleep. 1983;6:234–243. doi: 10.1093/sleep/6.3.234. [DOI] [PubMed] [Google Scholar]
- Pincus SM, Cummins TR, Haddad GG. Heart rate control in normal and aborted-SIDS infants. Am J Physiol. 1993;264:R638–R646. doi: 10.1152/ajpregu.1993.264.3.R638. [DOI] [PubMed] [Google Scholar]
- Price ER, Han F, Dick TE, Strohl KP. 7-nitroindazole and posthypoxic ventilatory behavior in the A/J and C57BL/6J mouse strains. J Appl Physiol. 2003;95:1097–1104. doi: 10.1152/japplphysiol.00166.2003. [DOI] [PubMed] [Google Scholar]
- Romaniuk JR, Dick TE, Kowalski KE, Dimarco AF. Effects of pulse lung inflation on chest wall expiratory motor activity. J Appl Physiol. 2007;102:485–491. doi: 10.1152/japplphysiol.00130.2006. [DOI] [PubMed] [Google Scholar]
- Saponjic J, Radulovacki M, Carley DW. Monoaminergic system lesions increase post-sigh respiratory pattern disturbance during sleep in rats. Physiol Behav. 2007;90:1–10. doi: 10.1016/j.physbeh.2006.08.019. [DOI] [PubMed] [Google Scholar]
- Seely AJ, Macklem PT. Complex systems and the technology of variability analysis. Crit Care. 2004;8:R367–R384. doi: 10.1186/cc2948. [DOI] [PMC free article] [PubMed] [Google Scholar]
- Shannon C, Weaver W. The Mathematical Theory of Communication. Urbana, Illinois: University of Illinois Press; 1964. [Google Scholar]
- Stettner GM, Zanella S, Hilaire G, Dutschmann M. 8-OH-DPAT suppresses spontaneous central apneas in the C57BL/6J mouse strain. Respir Physiol Neurobiol. 2008a;161:10–15. doi: 10.1016/j.resp.2007.11.001. [DOI] [PubMed] [Google Scholar]
- Stettner GM, Zanella S, Huppke P, Gartner J, Hilaire G, Dutschmann M. Spontaneous central apneas occur in the C57BL/6J mouse strain. Respir Physiol Neurobiol. 2007 doi: 10.1016/j.resp.2007.07.011. [DOI] [PubMed] [Google Scholar]
- Stettner GM, Zanella S, Huppke P, Gartner J, Hilaire G, Dutschmann M. Spontaneous central apneas occur in the C57BL/6J mouse strain. Respir Physiol Neurobiol. 2008b;160:21–27. doi: 10.1016/j.resp.2007.07.011. [DOI] [PubMed] [Google Scholar]
- Strohl KP, Price E, Yamauchi M, Dostal J, Feng P, Han F. Post-hypoxic Ventilatory behavior in A/J and C57BL/6J (B6) Mouse Chromosomal Substitution Strains (CSSS) [Abstract] Sleep and Biological Rhythms. 2007;5:A47. [Google Scholar]
- Yamauchi M, Dostal J, Strohl KP. Acetazolamide protects against posthypoxic unstable breathing in the C57BL/6J mouse. J Appl Physiol. 2007a;103:1263–1268. doi: 10.1152/japplphysiol.01287.2006. [DOI] [PubMed] [Google Scholar]
- Yamauchi M, Dostal J, Strohl KP. Effects of Serotonin 1A Receptor Agonist on the Post-Hypoxic Ventilatory Behavior in the C57BL/6J and A/J Mouse Strains [Abstract] ATS. 2007b [Google Scholar]


