

Abstract
Objectives:
The aim of this study was to assess artefacts and their impact on cone beam CT (CBCT) image quality (IQ) after head motion simulated by a robot skull.
Methods:
A fully dentate human skull incorporated into a robot simulated pre-determined patient movements. Ten head motion patterns were selected based on the movement of the C-arm of the CBCT units (no motion as reference). Three CBCT units were used [a three-dimensional eXam (K) (KaVo Dental GmbH, Biberach, Germany), a Promax 3D MAX (P) (Planmeca Oy, Helsinki, Finland) and a Scanora® 3D (S) (Soredex Oy, Tuusula, Finland)]. Axial images were qualitatively assessed at three levels: mental foramen (MF), infraorbital foramen and supraorbital foramen, and artefacts characterized as stripe-like, double contours, unsharpness or ring-like. A 100 mm visual analogue scale (VAS) was used to quantitatively assess IQ. Cross-sectional images of the lower third molar and MF bilaterally were also evaluated by VAS. Four blinded examiners assessed the images.
Results:
For all units and motion patterns, stripe-like artefacts were the most common. The four observers agreed on the presence of at least one artefact type in 90% of the images. Axial images showed lower overall IQ after motion (VAS = 72.4 ± 24.0 mm) than reference images (VAS = 97.3 ± 2.6 mm). The most severe artefacts were seen at the MF level. For cross-sectional images, IQ was lowest after tremor. The mean IQ range was 74–89 and 57–90 for isolated (tilting, rotation and nodding) and combined (nodding + tilting and rotation + tilting) movements, respectively. IQ for MF was lower than for third molar for any movement except tremor.
Conclusions:
Head motion of any type resulted in artefacts in CBCT images. The impact on IQ depended on the region and level in the skull.
Keywords: cone beam computed tomography, artefacts, image quality
Introduction
Cone beam CT (CBCT) scanning has emerged as a low-dose CT technique for visualization of bony structures in the head and neck region.1,2 One of the main disadvantages of CBCT imaging may be the presence of artefacts in the final reconstructed images, such as streaking artefacts from high-density objects (e.g. metal) and motion artefacts.3,4
Only a few reports exist regarding artefacts in CBCT images,4–7 and none of them has focused specifically on motion artefacts. A CBCT examination takes some seconds; consequently, the patient may move during the exposure, and the image reconstruction will not account for the motion since no information on movement is integrated into the reconstruction process.4 Patients' movements may not have a major impact on the sharpness of every single image section, because each image takes only fractions of seconds to acquire, but it directly influences image reconstruction, making the final reconstructed image more or less blurry.3 Motion artefacts may moreover depend on the type of movements performed. Movements, such as respiratory, cardiac, digestive and muscular, may be categorized and quantified.8 For medical CBCT imaging this has been studied regarding examinations of the thoracic region, since the patient's breathing or heartbeat is known to cause motion artefacts.9 Some studies assessed the influence of motion artefacts on CT and CBCT-based thoracic images, suggesting the addition of a timeline connecting the motion to the image, which would help in the correction of the images.10–14 In oral and maxillofacial CBCT imaging movements such as shaking or shivering of the head, for example owing to fear of the ongoing examination or reflections due to tube (arm) movement, may occur. The impact of these movements on image quality (IQ) and the visual characteristics of motion artefacts have not been described.
The aim of the present study was to assess artefacts and their impact on CBCT IQ after specific head motion sets simulated by a robot skull.
Materials and methods
Robot development
In this study, a fully dentate human skull without dental restorations was incorporated into a prototype robot. The robot was able to simulate patient movements in all freely selected axes, at a freely selected speed and using freely selected excursion angles. Using a remote control, the pre-defined movement was started in the required axis. A servo drive of the axis was controlled with respect to time, speed and path using a switch in the remote control. The robot was built to be able to reproduce the various head movements that can be expected to be made by patients: rotation (axial plane, x- and z-axes), nodding (sagittal plane, y- and z-axes), tilting (coronal plane, y- and x-axes) and tremor (combination of all). The movements represented a spatial variation of 15° in the selected axis, based on the centre of the movement (the “neck” of the robot skull), simulating an in vivo situation. The robot had 1.5 mm radio-opaque circular markers inserted at three anatomical foramina: mental foramen (MF), infraorbital foramen (IF) and supraorbital foramen (SF) (Figure 1).
Figure 1.

Sketch of skull illustrating the planes of movement and the foramina with radio-opaque markers: supraorbital foramen (a), infraorbital foramen (b) and mental foramen (c)
Image generation
Three CBCT units were used: a three-dimensional eXam (K) (KaVo Dental GmbH, Biberach, Germany), a ProMax 3D MAX (P) (Planmeca Oy, Helsinki, Finland) and a Scanora® 3D (S) (Soredex Oy, Tuusula, Finland). The protocol used for each scanner is shown in Table 1. The images were stored in Digital Imaging and Communications in Medicine (DICOM) format.15
Table 1.
Image acquisition protocols
| Parameter | Cone beam CT unit |
||
| K | P | S | |
| Scan time (s) | 26.0 | 26.0 | 26.0 |
| Exposure time (s) | 7.4 | 18 | 6.0 |
| Field of view (cm) | 16.0 × 13.0 | 23.0 × 16.0 | 7.5 × 14.5 |
| kV | 120 | 96 | 85 |
| mA | 5 | 11 | 15 |
| Voxel resolution (mm) | 0.30 | 0.40 | 0.25 |
K, eXam (KaVo Dental GmbH, Biberach, Germany); P, ProMax 3D MAX (Planmeca Oy, Helsinki, Finland); S, Scanora 3D (Soredex Oy, Tuusula, Finland).
Head motion
Robot head movements were chosen based on the position and movement of the C-arm in the CBCT units, and ten pre-defined motion patterns were evaluated for each unit. The characteristics of the motion patterns are shown in Table 2. An examination without motion was used as the reference. Based on that, 11 examinations were made with each CBCT unit. The timing to trigger the movements was adjusted according to the unit characteristics, which means that for S the first movements were triggered 2 s after the beginning of scan, and the second movement (when there was a combination of movements) 10 s after the start of the scan. For K, movements were triggered at 3 s and 8 s after the start of scan, and for P 3 s and 15 s after the start of scan.
Table 2.
Motion patterns performed with the robot. The movements represented a spatial variation of 15° in the select axis, based on the centre of the movement (the “neck” of the robot skull)
| Motion pattern |
| Tremor |
| Nodding back |
| Nodding back + tilting left |
| Nodding back + tilting right |
| Rotation left |
| Rotation left + tilting right |
| Rotation right |
| Rotation right + tilting left |
| Tilting left |
| Tilting right |
| No motion |
Observer assessment
The 22 acquired DICOM sets were imported into reconstruction software (OnDemand 3D™; Cybermed, Seoul, Republic of Korea), and each one was adjusted to present optimal image characteristics, i.e. windowing (values for the centre level, L, and bandwidth, W, of the displayed shades of grey) of the image sets was adjusted (S, W = 3494 and L = 722; K, W = 2932 and L = 671; P, W = 2435 and L = 503).
The original datasets and their relation with the performed motion were saved, and the datasets were then coded to blind the observers and saved in duplicate. Prior to assessment the sequence of the duplicate datasets was randomized by drawing a lot. In this way all original datasets were randomly evaluated twice. Four independent and experienced observers (one professor in oral radiology and three PhD students with experience in CBCT), blinded to movement (if any) type and to which CBCT unit was used, assessed the images.
Before starting the assessments, the observers were trained in determining characteristics of artefacts in CBCT images. The images were projected onto a large screen with adequately adjusted brightness and contrast. Assessments were performed in a room with dimmed light.
Axial images: characteristics of motion artefacts and overall image quality
At the session of the assessments, an operator (JM, not part of image assessment) opened each dataset in the randomized sequence and navigated through the axial view from the first to the last image of the examination, stopping at the reconstructed planes showing the radio-opaque landmarks (Figure 2). The observers were allowed to view these images until all had characterized and scored the image.
Figure 2.
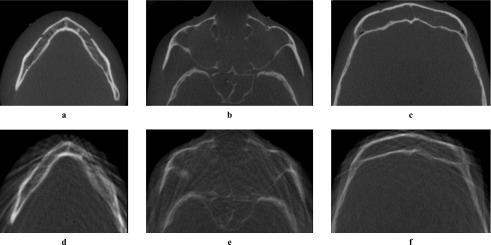
Examples of axial images, generated using a Scanora 3D (Soredex Oy, Tuusula, Finland). First row (a,b,c) shows reference images without motion artefacts. Second row (d,e,f) shows images with tremor artefacts. (a,d) Mental foramen; (b,e) infraorbital foramen; (c,f) supraorbital foramen
Artefacts were characterized in four categories: stripe-like, double contours, overall unsharpness and ring-like. More than one type of artefact could be recorded in an image. In addition it was recorded if the observed artefact was inhomogeneous (in part of the image) or homogeneous (same all over the image). A 100 mm visual analogue scale (VAS), ranging from “worst” (0) to “best” (100), was used to quantitatively assess overall IQ.16
Cross-sectional images: image quality in regions of diagnostic interest
At a second session, the operator opened each dataset and generated cross-sectional images of four regions of interest (ROIs): lower third molars (TM) and MF, bilaterally (Figures 3 and 4). Images were saved as tagged image file format files in 96 dpi resolution. Images were then projected onto the same large screen and viewed under the same conditions as in the first session. IQ in the cross-sectional images was also assessed using a 100 mm VAS.
Figure 3.

Examples of cross-sectional images of the lower third molar region, generated using three-dimensional eXam (KaVo Dental GmbH, Biberach, Germany). (a) Reference image; (b) image with motion (tremor) artefacts
Figure 4.

Examples of cross-sectional images of the mental foramen region, generated using ProMax 3D MAX (Planmeca Oy, Helsinki, Finland). (a) Reference image; (b) image with motion (tremor) artefacts
Data analysis
Commercially available software (SPSS® v. 13.0; Apache Software Foundation, Chicago, IL) was utilized to estimate intra- and interobserver agreement by kappa statistics and Pearson correlation tests. The prevalence of each type of artefact was assessed in relation to the movement performed. Means and standard deviations for IQ were calculated for each ROI and for the overall axial images, considering each unit and observer.
Results
Axial images: characteristics of motion artefacts and overall image quality
For artefact characterization, the intraobserver agreement, kappa, was 0.55 on average, ranging from 0.48 (overall unsharpness) to 0.73 (double contours). The intraobserver agreement was 0.56 for stripe-like artefacts, 0.35 for overall unsharpness, and 0.86 for ring-like artefacts, but could not be defined for double contours because of the distribution of this type of artefact. The four observers agreed on the presence of at least one artefact in 90% of the images.
For all units and motion patterns, stripe-like artefacts were the most common (seen in 100% of K, 97.5% of P and 90% of S images with some type of motion). The largest number of artefacts was observed at the MF level. As this region was also an ROI, it was chosen to demonstrate the artefact prevalence distribution (Table 3). For all units, stripe-like artefacts were the most prevalent. Ring-like artefacts were the least frequently observed and only seen in images generated with P after tremor movements. Double contours were mainly caused by tremor, although some were also seen for the combination nodding + tilting for K and S. Overall, unsharpness was observed in more than 50% of the images generated with K and S, and in 25% of the images generated with P, although not connected to a specific type of movement.
Table 3.
Artefacts characterized in the axial images at the mental foramen level, according to unit, motion pattern, artefact type and observer (1–4)
| K |
||||||||||||||||
| Stripe-like |
Double contours |
Overall unsharpness |
Ring-like |
|||||||||||||
| Motion pattern | 1 | 2 | 3 | 4 | 1 | 2 | 3 | 4 | 1 | 2 | 3 | 4 | 1 | 2 | 3 | 4 |
| No motion | − | − | − | − | − | − | − | − | − | − | − | − | − | − | − | − |
| Nodding back | + | + | + | + | − | − | − | − | − | + | + | − | − | − | − | − |
| Nodding back + tilting right | + | + | + | + | − | − | − | + | + | + | + | + | − | − | − | − |
| Nodding back + tilting left | + | + | + | + | − | − | − | + | + | + | + | − | − | − | − | − |
| Rotation left | + | + | + | + | − | − | − | + | + | + | + | − | − | − | − | − |
| Rotation left + tilting right | + | + | + | + | − | − | − | − | + | + | + | − | − | − | − | − |
| Rotation right | ++ | + | + | + | − | − | − | − | − | − | − | − | − | − | − | − |
| Rotation right + tilting left | + | + | + | + | − | − | − | − | − | − | − | − | − | − | − | − |
| Tilting left | + | + | + | + | − | − | − | + | − | + | + | − | − | − | − | − |
| Tilting right | + | + | + | + | − | − | − | + | + | − | + | − | − | − | − | − |
| Tremor | ++ | ++ | ++ | ++ | ++ | − | + | + | ++ | − | ++ | + | − | − | − | − |
| P |
||||||||||||||||
| Stripe-like |
Double contours |
Overall unsharpness |
Ring-like |
|||||||||||||
| Motion pattern | 1 | 2 | 3 | 4 | 1 | 2 | 3 | 4 | 1 | 2 | 3 | 4 | 1 | 2 | 3 | 4 |
| No motion | − | − | − | − | − | − | − | − | − | − | + | − | − | − | − | − |
| Nodding back | ++ | + | + | + | − | − | − | − | − | − | − | + | − | − | − | − |
| Nodding back + tilting right | ++ | + | + | + | − | − | − | − | ++ | − | − | + | − | − | − | − |
| Nodding back + tilting left | ++ | + | + | + | − | − | − | − | − | − | − | − | − | − | − | − |
| Rotation left | + | + | + | + | − | − | − | − | − | − | − | − | − | − | − | − |
| Rotation left + tilting right | + | + | + | + | − | − | − | − | + | − | + | − | − | − | − | − |
| Rotation right | + | + | + | + | − | − | − | − | − | − | − | − | − | − | − | − |
| Rotation right + tilting left | ++ | + | + | + | − | − | − | − | − | − | − | − | − | − | − | − |
| Tilting left | + | + | + | + | − | − | − | − | − | − | + | − | − | − | − | − |
| Tilting right | + | + | + | + | − | − | − | − | − | − | − | − | − | − | − | − |
| Tremor | − | + | ++ | + | ++ | − | − | ++ | ++ | − | ++ | ++ | ++ | ++ | ++ | ++ |
| S |
||||||||||||||||
| Stripe-like |
Double contours |
Overall unsharpness |
Ring-like |
|||||||||||||
| Motion pattern | 1 | 2 | 3 | 4 | 1 | 2 | 3 | 4 | 1 | 2 | 3 | 4 | 1 | 2 | 3 | 4 |
| No motion | + | − | − | − | − | − | − | − | − | − | − | − | − | − | − | − |
| Nodding back | + | + | + | + | − | − | − | − | − | − | + | + | − | − | − | − |
| Nodding back + tilting right | ++ | + | + | + | − | − | + | + | ++ | + | + | + | − | − | − | − |
| Nodding back + tilting left | ++ | ++ | + | + | − | − | + | + | ++ | − | + | + | − | − | − | − |
| Rotation left | + | + | + | − | − | − | − | − | − | − | − | − | − | − | − | − |
| Rotation left + tilting right | + | + | + | + | − | − | − | − | + | + | + | + | − | − | − | − |
| Rotation right | − | + | + | + | − | − | − | − | − | − | − | − | − | − | − | − |
| Rotation right + tilting left | + | + | + | + | − | − | − | + | + | + | + | + | − | − | − | − |
| Tilting left | + | + | − | − | − | − | − | − | + | − | − | + | − | − | − | − |
| Tilting right | + | + | + | + | − | − | − | − | + | − | + | + | − | − | − | − |
| Tremor | ++ | ++ | ++ | ++ | ++ | − | + | + | ++ | ++ | ++ | + | − | + | − | − |
K, eXam (KaVo Dental GmbH, Biberach, Germany); P, ProMax 3D MAX (Planmeca Oy, Helsinki, Finland); S, Scanora 3D (Soredex Oy, Tuusula, Finland).
+, observed artefact was inhomogeneous (in part of the image).
++, observed artefact was homogeneous (same all over the image).
Regarding IQ, the average intraobserver correlation (for the recordings at the first and the second time each dataset was assessed) was high (Pearson's r = 0.97 for Observer 1; 0.93 for Observer 2; 0.89 for Observer 3; and 0.84 for Observer 4) with an average correlation coefficient of 0.91. The overall mean difference between recorded VAS values was low (1.03 ± 6.33 for Observer 1; 1.47 ± 8.92 for Observer 2; 0.49 ± 10.56 for Observer 3; and 0.60 ± 13.72 for Observer 4). The average intraobserver correlation was slightly lower in the second assessment (Pearson's r = 0.86 and 0.82, for first and second assessments, respectively). Based on this, the results from the first assessment of each original dataset were chosen to represent the sample.
Lower overall IQ (Table 4) was observed in the presence of movements (average 72.4 ± 24.0 mm) than in reference images (97.3 ± 2.6 mm). IQ was lowest for images acquired with tremor (average 16.3 ± 6.4 mm). For all motion patterns, except tremor, the overall IQ was lowest for the mental foramen region and highest for the supraorbital foramen region.
Table 4.
Overall image quality recorded on visual analogue scale according to unit, region and motion pattern
| Unit | Region | Motion pattern |
|||||||
| Tremor | Nodding | Rotation | Tilting | Rotation + tilting | Nodding + tilting | Any type of motion | Reference | ||
| K | MF | 12.8 ± 5.3 | 74.3 ± 9.3 | 80.5 ± 2.4 | 71.5 ± 14.4 | 77.4 ± 17.3 | 69.0 ± 14.2 | 71.8 ± 23.9 | 98.3 ± 1.5 |
| IF | 14.8 ± 5.1 | 76.5 ± 19.5 | 86.9 ± 7.5 | 73.0 ± 14.7 | 80.1 ± 16.8 | 71.1 ± 14.2 | 78.2 ± 22.4 | 98.0 ± 1.4 | |
| SF | 21.3 ± 4.0 | 83.8 ± 3.8 | 94.0 ± 4.1 | 89.8 ± 4.3 | 87.9 ± 3.1 | 73.9 ± .9 | 80.1 ± 22.2 | 98.3 ± 1.5 | |
| OA | 16.2 ± 5.8 | 78.2 ± 12.2 | 87.1 ± 7.7 | 78.1 ± 14.1 | 81.8 ± 14.2 | 71.3 ± 12.4 | 73.1 ± 22.9 | 98.1 ± 1.3 | |
| P | MF | 19.8 ± 5.2 | 81.0 ± 5.9 | 85.0 ± 5.9 | 81.3 ± 12.0 | 75.8 ± 10.5 | 78.0 ± 17.5 | 72.0 ± 22.5 | 94.5 ± 5.4 |
| IF | 12.8 ± 4.3 | 77.3 ± 8.3 | 85.8 ± 9.6 | 84.5 ± 9.2 | 80.9 ± 11.0 | 76.0 ± 19.5 | 75.8 ± 23.9 | 97.5 ± 1.7 | |
| SF | 13.0 ± 6.5 | 83.3 ± 6.2 | 91.6 ± 5.3 | 87.3 ± 7.1 | 84.9 ± 10.9 | 84.0 ± 10.3 | 76.8 ± 25.4 | 98.3 ± 1.7 | |
| OA | 15.2 ± 5.9 | 80.5 ± 6.7 | 87.5 ± 8.3 | 84.3 ± 9.9 | 80.5 ± 12.1 | 79.3 ± 15.3 | 75.9 ± 23.1 | 96.7 ± 3.5 | |
| S | MF | 19.5 ± 8.5 | 83.3 ± 5.3 | 91.8 ± 5.8 | 75.8 ± 8.7 | 60.3 ± 8.1 | 42.3 ± 16.5 | 60.5 ± 29.4 | 97.5 ± 1.7 |
| IF | 17.5 ± 9.3 | 88.8 ± 3.9 | 92.6 ± 2.3 | 73.6 ± 7.9 | 71.4 ± 9.6 | 44.4 ± 11.9 | 61.4 ± 28.0 | 97.0 ± 2.0 | |
| SF | 15.5 ± 6.5 | 92.3 ± 6.2 | 95.8 ± 2.7 | 82.5 ± 6.8 | 79.5 ± 9.3 | 55.0 ± 11.7 | 65.2 ± 26.9 | 96.8 ± 3.6 | |
| OA | 17.5 ± 7.6 | 88.1 ± 6.1 | 93.4 ± 5.6 | 77.3 ± 12.9 | 70.4 ± 12.5 | 47.2 ± 14.0 | 62.4 ± 27.2 | 97.1 ± 2.3 | |
| OA | MF | 17.3 ± 6.8 | 79.5 ± 7.5 | 85.7 ± 8.1 | 76.2 ± 13.4 | 71.1 ± 15.3 | 63.1 ± 21.6 | 68.9 ± 23.4 | 96.7 ± 3.5 |
| IF | 15.0 ± 6.3 | 80.8 ± 12.7 | 88.4 ± 7.8 | 77.0 ± 12.7 | 77.5 ± 12.9 | 63.8 ± 20.0 | 70.9 ± 24.2 | 97.5 ± 1.6 | |
| SF | 16.6 ± 6.3 | 86.42 ± 6.6 | 93.8 ± 4.8 | 86.5 ± 9.1 | 84.1 ± 9.9 | 70.9 ± 16.2 | 77.4 ± 23.8 | 97.7 ± 2.3 | |
| OA | 16.3 ± 6.4 | 82.25 ± 9.5 | 89.3 ± 7.7 | 79.9 ± 12.6 | 77.5 ± 13.8 | 66.0 ± 19.5 | 72.4 ± 24.0 | 97.3 ± 2.6 | |
IF, infraorbital foramen; K, eXam (KaVo Dental GmbH, Biberach, Germany); MF, mental foramen; OA, overall; P, ProMax 3D MAX (Planmeca Oy, Helsinki, Finland); S, Scanora 3D (Soredex Oy, Tuusula, Finland); SF, supraorbital foramen.
Cross-sectional images: image quality in regions of diagnostic interest
The intraobserver agreement was high (Pearson's r = 0.92 for Observer 1; 0.91 for Observer 2; 0.89 for Observer 3; and 0.71 for Observer 4) with an average correlation coefficient of 0.86. The overall mean difference between recorded VAS values (for the recordings at the first and the second time each dataset was assessed) was low (0.16 ± 8.6 for Observer 1, 1.65 ± 9.49 for Observer 2, 0.97 ± 10.82 for Observer 3 and 1.33 ± 21.65 for Observer 4). The average intraobserver correlation was lower in the first assessment (Pearson's r = 0.77 and 0.85, for first and second assessments, respectively). Based on this, the results from the second assessment of each original dataset were chosen to represent the sample.
IQ (Table 5) was lowest after tremor movements (18.1 ± 23.8 mm right TM, 8.0 ± 7.5 mm left TM, 15.3 ± 16.6 mm right MF and 10.2 ± 14.5 mm left MF) whereas images with no movement showed the highest IQ (90.3 ± 8.5 mm, 87.1 ± 10.5 mm, 87.6 ± 8.4 mm and 87.3 ± 8.2 mm, respectively). Mean IQ ranged from 74 mm to 89 mm and from 57 mm to 90 mm for isolated (tilting, rotation and nodding) and combined (nodding + tilting and rotation + tilting) movements, respectively. The IQ for MF was lower than for TM for any motion except tremor. Images generated with tremor presented a tendency towards lower IQ values in the P unit than in the other systems. For all other tested motion patterns, the IQ values and range were quite similar among units.
Table 5.
Image quality recorded on visual analogue scale in regions of diagnostic interest according to unit, region and motion pattern
| Unit | Region | Motion pattern |
||||||||||
| Tremor | Rotation right | Rotation left | Tilting right | Tilting left | Nodding back | Nodding back + tilting left | Noding back + tilting right | Rotation left + tilting right | Rotation right + tilting left | Reference | ||
| K | Right TM | 30.0 ± 12.3 | 82.9 ± 14.8 | 84.2 ± 11.6 | 82.6 ± 12.5 | 85.3 ± 11.1 | 85.5 ± 14.1 | 79.2 ± 14.3 | 70.5 ± 26.1 | 81.3 ± 14.1 | 87.1 ± 8.9 | 85.3 ± 12.7 |
| Left TM | 13.4 ± 8.6 | 77.6 ± 9.9 | 79.7 ± 7.6 | 76.6 ± 5.3 | 80.8 ± 6.7 | 79.7 ± 11.3 | 70.8 ± 10.5 | 70.0 ± 26.8 | 76.3 ± 9.9 | 80.5 ± 5.3 | 85.3 ± 13.7 | |
| Right MF | 21.6 ± 12.3 | 78.9 ± 13.7 | 81.0 ± 12.2 | 82.1 ± 6.8 | 81.3 ± 14.1 | 77.1 ± 15.6 | 70.3 ± 8.4 | 73.4 ± 19.1 | 79.2 ± 14.4 | 83.4 ± 9.3 | 83.4 ± 12.3 | |
| Left MF | 8.2 ± 7.3 | 80.0 ± 11.5 | 78.2 ± 15.7 | 62.4 ± 8.2 | 62.4 ± 12.5 | 60.0 ± 11.6 | 61.3 ± 10.9 | 51.8 ± 4.7 | 63.7 ± 13.4 | 80.0 ± 11.4 | 83.9 ± 12.5 | |
| P | Right TM | 1.6 ± 0.6 | 87.4 ± 7.0 | 90.5 ± 6.2 | 90.5 ± 6.7 | 92.1 ± 6.0 | 91.8 ± 6.5 | 83.4 ± 10.6 | 89.7 ± 8.7 | 89.2 ± 10.8 | 87.6 ± 10.6 | 93.7 ± 6.4 |
| Left TM | 1.6 ± 0.6 | 79.7 ± 8.2 | 87.4 ± 8.2 | 90.0 ± 7.7 | 89.0 ± 9.2 | 89.7 ± 9.1 | 87.6 ± 8.1 | 88.2 ± 6.4 | 87.4 ± 12.7 | 85.0 ± 7.5 | 86.8 ± 13.8 | |
| Right MF | 1.0 ± 0.0 | 67.4 ± 13.5 | 73.4 ± 13.6 | 78.2 ± 5.6 | 74.7 ± 6.3 | 83.9 ± 7.6 | 69.7 ± 4.1 | 74.2 ± 4.7 | 80.5 ± 7.4 | 67.9 ± 13.1 | 88.7 ± 8.0 | |
| Left MF | 1.3 ± 0.5 | 80.5 ± 5.6 | 85.3 ± 8.5 | 86.6 ± 8.6 | 81.0 ± 6.1 | 87.6 ± 8.6 | 83.4 ± 11.8 | 83.4 ± 12.4 | 87.6 ± 12.8 | 80.5 ± 11.7 | 89.2 ± 7.4 | |
| S | Right TM | 22.9 ± 36.7 | 89.2 ± 5.7 | 92.6 ± 3.1 | 69.2 ± 10.3 | 70.0 ± 10.3 | 63.4 ± 12.0 | 53.7 ± 16.3 | 68.2 ± 12.9 | 87.6 ± 11.9 | 94.2 ± 6.3 | 92.1 ± 3.6 |
| Left TM | 8.9 ± 6.2 | 85.8 ± 8.6 | 89.5 ± 3.3 | 78.4 ± 11.0 | 82.4 ± 12.8 | 80.0 ± 15.0 | 58.7 ± 18.3 | 82.1 ± 11.9 | 81.0 ± 7.4 | 73.9 ± 3.5 | 89.2 ± 4.3 | |
| Right MF | 23.2 ± 21.3 | 82.9 ± 16.0 | 89.2 ± 6.9 | 70.8 ± 11.4 | 73.7 ± 11.5 | 60.5 ± 13.7 | 59.1 ± 23.1 | 66.8 ± 14.8 | 84.7 ± 11.7 | 82.4 ± 13.2 | 90.8 ± 2.2 | |
| Left MF | 21.0 ± 21.1 | 83.2 ± 16.3 | 83.7 ± 4.2 | 77.4 ± 9.8 | 81.0 ± 12.2 | 75.0 ± 16.8 | 24.7 ± 12.9 | 39.5 ± 14.3 | 33.7 ± 18.0 | 30.5 ± 19.2 | 88.7 ± 3.8 | |
| OA | Right TM | 18.1 ± 23.8 | 86.5 ± 9.5 | 89.1 ± 8.0 | 80.8 ± 13.0 | 82.5 ± 12.9 | 80.3 ± 16.3 | 72.1 ± 18.6 | 76.1 ± 18.8 | 86.0 ± 11.7 | 89.6 ± 8.6 | 90.4 ± 8.5 |
| Left TM | 8.0 ± 7.5 | 81.0 ± 8.8 | 85.5 ± 7.5 | 81.7 ± 9.8 | 84.0 ± 9.6 | 83.2 ± 11.9 | 72.4 ± 17.1 | 80.1 ± 17.5 | 81.6 ± 10.1 | 79.8 ± 7.0 | 87.1 ± 10.5 | |
| Right MF | 15.3 ± 16.6 | 76.4 ± 14.8 | 81.2 ± 12.2 | 77.0 ± 9.0 | 76.6 ± 10.6 | 73.9 ± 15.5 | 66.4 ± 14.0 | 71.5 ± 13.3 | 81.5 ± 10.7 | 77.9 ± 13.1 | 87.6 ± 8.4 | |
| Left MF | 10.2 ± 14.5 | 81.2 ± 10.9 | 82.4 ± 10.1 | 75.4 ± 13.2 | 74.8 ± 13.4 | 74.2 ± 16.5 | 56.5 ± 27.5 | 58.2 ± 21.9 | 61.7 ± 26.7 | 63.7 ± 27.8 | 87.3 ± 8.2 | |
K, eXam (KaVo Dental GmbH, Biberach, Germany); MF, mental foramen; OA, overall; P, ProMax 3D MAX (Planmeca Oy, Helsinki, Finland); S, Scanora® 3D (Soredex Oy, Tuusula, Finland); TM, third molar.
Discussion
Although the clinical use of CBCT is growing exponentially, this technology still presents limitations. The presence of artefacts in the final reconstructed images can be considered as one of the main pitfalls of CBCT imaging.3,4 However, only a few reports have focused on this issue,4–7 and none focused specifically on motion artefacts. Considering that a CBCT examination does not keep track of the relation between the position of the patient and the time of image acquisition, any movement during the exposure might lead to imperfections in the final reconstructed image.3,4 For all CBCT units currently on the market, any patient movement is equal to a geometric error in the reconstruction process, leading to a reduced spatial resolution. This is based on the fact that if the object of interest has dislocated during the active part of the examination (exposure), the geometry by which the images for three-dimensional reconstruction have been acquired, IQ does not fit the inborn geometry used for the reconstruction based on a pre-defined algorithm. This means that even if artefacts are not obvious to the naked eye, the resolution will suffer, with a less sharp image as the result.
In medical CBCT imaging the correlation between motion and image artefacts has been better established.8–14 One study model was related to respiratory motion.9,11,13,17 The fundamental aspect of this respiratory motion artefact correction model is that it requires a respiratory signal, which provides a temporal guideline to the acquisition of images, allowing a correction for the problem during image reconstruction.13,17 A similar approach might be possible for oral and maxillofacial CBCT imaging if we can obtain more detailed information on how (and if) patients move during the examination. The suggested selection of motion sets was based on the movement of the C-arm of the CBCT units and the effect that this might cause in the patients because of fear or subconscious reflections. Other reasons for patient movements may be systemic diseases, such as Parkinson's disease.
The results of our study showed that all tested head motions resulted in artefacts in CBCT images, with the severity of the artefacts depending on the imaged level in the skull. Stripe-like artefacts were connected with most of the motion patterns whereas ring-like artefacts were mainly seen in images generated with a specific unit (P) related to tremor movements. Double contours were mainly caused by tremor, although this was also seen for the combination nodding + tilting in K and S units. Overall unsharpness was also seen, although not related to a specific type of movement or unit.
IQ was directly affected by the presence of artefacts, since the VAS values recorded for motion-related images were considerably lower than those observed for the reference images. The ROI also had an impact on IQ, and the most severe artefacts together with the lowest IQ values were recorded at the MF level. This might be explained by the anatomical complexity of this region, with a high number of structures that must be separated and sharply displayed. The fact that the images were projected onto a screen might have resulted in generally lower IQ scores than if a high-quality monitor had been used; however, the interference was the same for all evaluated image sets, thus the mutual quality scores were not biased.
In general, the unit used to acquire the images did not have a strong impact on the assessed IQ. As shown, the major impact was seen in the qualitative evaluation of artefact type, where tremor movements lead to ring-like artefacts in one of the units (P). This might be due to differences in the rotation range of the C-arm of the CBCT units tested. In this study, K and S units used a complete circular trajectory (a scan arc of 360°) to acquire the data. On the other hand, images in the P unit were generated using a reduced trajectory (less than 360°). This approach potentially reduces the scan time and is mechanically easier to perform. However, images produced by this method may possess a higher level of noise and suffer from reconstruction interpolation artefacts.18 This was not tested in the present study. The way each unit captures the dataset also differs. P and S capture the datasets in a large field of view in two exposures, whereas K is based on only one exposure. Another step that might influence IQ, leading to differences among the values observed for each of the tested units, was importing the DICOM datasets into software to reconstruct and generate the images. The datasets from the three units were imported in the same manner, using the same commercially available software. Further studies are necessary to evaluate the impact of various acquisition/reconstruction software on IQ since our study was not designed for that purpose.
CBCT imaging for diagnosis of complicated patient cases, such as the relation between the mandibular canal and the roots of the lower third molar19,20 or bony lesions associated with anatomically noble structures, such as the MF,21–23 might be jeopardized by motion artefacts. IQ in the cross-sectional images was strongly affected by the movements. There was a tendency that the VAS values were lower for the MF region than for the TM region for any movement except tremor. This might be related to the fact that the MF region has a larger spatial distance from the centre of movement, resulting in a larger spatial alteration of the structures in the anterior region of the skull, and therefore a stronger interference with image reconstruction. A CBCT dataset with motion artefacts might therefore still be useful for some diagnostic purposes, but inadequate for others.
Although no statistical testing was done between the CBCT units because of the rather small image sample size (there was just one reference DICOM dataset for each tested scanner), the present study describes in detail the settings used for image generation in order to enhance the reproducibility of our method and permit our results to be compared to other standardized studies. As already stated, the impact of these motion patterns on IQ of images acquired in vivo is still unknown.
Future studies should focus on the prevalence of movement artefacts during patient examination and on a possible threshold, below which a certain movement will not interfere with the diagnostic outcome. Future studies must also consider motion-tracking devices, which could provide a temporal and spatial “map”, which might be used to correct for the movements during image reconstruction.
Conclusion
Our results showed that head motion of any type resulted in artefacts in CBCT images, and that stripe-like artefacts were the most commonly seen. Motion decreased IQ, depending on the performed motion pattern and on the region of interest. The severity of the artefacts depended on level in the skull. Further studies are needed to define the impact of these artefacts on diagnostic decisions, as well as the prevalence of patients who move during examination.
References
- 1.Miracle AC, Mukherji SK. Conebeam CT of the head and neck, part 1: physical principles. Am J Neuroradiol 2009; 30: 1088–1095 [DOI] [PMC free article] [PubMed] [Google Scholar]
- 2.Miracle AC, Mukherji SK. Conebeam CT of the head and neck, part 2: clinical applications. Am J Neuroradiol 2009; 30: 1285–1292 [DOI] [PMC free article] [PubMed] [Google Scholar]
- 3.Hanzelka T, Foltan R, Horka E, Sedy J. Reduction of the negative influence of patient motion on quality of CBCT scan. Med Hypotheses 2010; 75: 610–612 [DOI] [PubMed] [Google Scholar]
- 4.Schulze R, Heil U, Grob D, Bruellmann DD, Dranischnikow E, Schwanecke U, et al. Artefacts in CBCT: a review. Dentomaxillofac Radiol 2011; 40: 265–273 [DOI] [PMC free article] [PubMed] [Google Scholar]
- 5.Draenert FG, Coppenrath E, Herzog P, Muller S, Mueller-Lisse UG. Beam hardening artefacts occur in dental implant scans with the NewTom cone beam CT but not with the dental 4-row multidetector CT. Dentomaxillofac Radiol 2007; 36: 198–203 [DOI] [PubMed] [Google Scholar]
- 6.Schulze RKW, Berndt D, d'Hoedt B. On cone-beam computed tomography artefacts induced by titanium implants. Clin Oral Implants Res 2010; 21: 100–107 [DOI] [PubMed] [Google Scholar]
- 7.Stuehmer C, Essig H, Bormann KH, Majdani O, Gellrich NC, Rucker M. Cone beam CT imaging of airgun injuries to the craniomaxillofacial region. Int J Oral Maxillofac Surg 2008; 37: 903–906 [DOI] [PubMed] [Google Scholar]
- 8.Li G, Citrin D, Camphausen K, Mueller B, Burman C, Mychalczak B, et al. Advances in 4D medical imaging and 4D radiation therapy. Technol Cancer Res Treat 2008; 7: 67–81 [DOI] [PubMed] [Google Scholar]
- 9.Song JY, Nam TK, Ahn SJ, Chung WK, Yoon MS, Nah BS. Respiratory motional effect on cone-beam CT in lung radiation surgery. Med Dosim 2009; 34: 117–125 [DOI] [PubMed] [Google Scholar]
- 10.Crum WR, Hartkens T, Hill DL. Non-rigid image registration: theory and practice. Br J Radiol 2004; 77: S140–S153 [DOI] [PubMed] [Google Scholar]
- 11.Kawakami Y, Suga K, Yamashita T, Iwanaga H, Zaki M, Matsunaga N. Initial application of respiratory-gated 201Tl SPECT in pulmonary malignant tumours. Nucl Med Commun 2005; 26: 303–313 [DOI] [PubMed] [Google Scholar]
- 12.Pluim JP, Maintz JB, Viergever MA. Mutual-information-based registration of medical images: a survey. IEEE Trans Med Imaging 2003; 22: 986–1004 [DOI] [PubMed] [Google Scholar]
- 13.Sonke JJ, Zijp L, Remeijer P, van Herk M. Respiratory correlated cone beam CT. Med Phys 2005; 32: 1176–1186 [DOI] [PubMed] [Google Scholar]
- 14.Xu S, Taylor RH, Fichtinger G, Cleary K. Lung deformation estimation and four-dimensional CT lung reconstruction. Acad Radiol 2006; 13: 1082–1092 [DOI] [PubMed] [Google Scholar]
- 15.Grauer D, Cevidanes LS, Proffit WR. Working with DICOM craniofacial images. Am J Orthod Dentofacial Orthop 2009; 136: 460–470 [DOI] [PMC free article] [PubMed] [Google Scholar]
- 16.Naslund EB, Moystad A, Larheim TA, Ogaard B, Kruger M. Cephalometric analysis with digital storage phosphor images: extreme low-exposure images with and without postprocessing noise reduction. Am J Orthod Dentofacial Orthop 2003; 124: 190–197 [DOI] [PubMed] [Google Scholar]
- 17.Zhang Q, Hu YC, Liu F, Goodman K, Rosenzweig KE, Mageras GS. Correction of motion artifacts in cone-beam CT using a patient-specific respiratory motion model. Med Phys 2010; 37: 2901–2909 [DOI] [PMC free article] [PubMed] [Google Scholar]
- 18.Scarfe WC, Farman AG. What is cone-beam CT and how does it work? Dent Clin North Am 2008; 52: 707–730 [DOI] [PubMed] [Google Scholar]
- 19.Suomalainen A, Venta I, Mattila M, Turtola L, Vehmas T, Peltola JS. Reliability of CBCT and other radiographic methods in preoperative evaluation of lower third molars. Oral Surg Oral Med Oral Pathol Oral Radiol Endod 2010; 109: 276–284 [DOI] [PubMed] [Google Scholar]
- 20.Matzen LH, Christensen J, Hintze H, Schou S, Wenzel A. Influence of Cone Beam CT on treatment plan before surgical intervention of mandibular third molars and impact of radiographic factors on deciding on coronectomy versus surgical removal. Dentomaxillofac Radiol. 2012 doi: 10.1259/dmfr/98870341. Aug 29. Epub ahead of print. [DOI] [PMC free article] [PubMed] [Google Scholar]
- 21.Gaia BF, Sales MA, Perrella A, Fenyo-Pereira M, Cavalcanti MG. Comparison between cone-beam and multislice computed tomography for identification of simulated bone lesions. Braz Oral Res 2011; 25: 362–368 [DOI] [PubMed] [Google Scholar]
- 22.Patel S, Dawood A, Mannocci F, Wilson R, Pitt Ford T. Detection of periapical bone defects in human jaws using cone beam computed tomography and intraoral radiography. Int Endod J 2009; 42: 507–515 [DOI] [PubMed] [Google Scholar]
- 23.Closmann JJ, Schmidt BL. The use of cone beam computed tomography as an aid in evaluating and treatment planning for mandibular cancer. J Oral Maxillofac Surg 2007; 65: 766–771 [DOI] [PubMed] [Google Scholar]