

Abstract
Diabetic retinopathy (DR) is a leading cause of preventable blindness in adults. To identify genetic contributions in DR, we studied 2071 type 2 diabetics. We first conducted a genome-wide association study of 1007 individuals, comparing 570 subjects with ≥8 years duration without DR (controls) with 437 PDR (cases) in the Chinese discovery cohort. Cases and controls were similar for HbA1c, diabetes duration and body mass index. Association analysis with imputed data identified three novel loci: TBC1D4-COMMD6-UCHL3 (rs9565164, P = 1.3 × 10⁻⁷), LRP2-BBS5 (rs1399634, P = 2.0 × 10⁻⁶) and ARL4C-SH3BP4 (rs2380261, P = 2.1 × 10⁻⁶). Analysis of an independent cohort of 585 Hispanics diabetics with or without DR though did not confirm these signals. These genes are still of particular interest because they are involved in insulin regulation, inflammation, lipid signaling and apoptosis pathways, all of which are possibly involved with DR. Our finding nominates possible novel loci as potential DR susceptibility genes in the Chinese that are independent of the level of HbA1c and duration of diabetes and may provide insight into the pathophysiology of DR.
INTRODUCTION
Diabetic retinopathy (DR), a frequent and serious complication of diabetes, is a leading cause of preventable blindness in working-age adults. The etiology of DR remains complex and poorly understood. There is strong evidence that duration of diabetes and glycemic control are two major contributors to the development and progression of DR (1,2); nevertheless, these risk factors do not account completely for susceptibility. For example, glycated hemoglobin and duration of diabetes only explained 11% of the variation in retinopathy risk in the DCCT (Diabetes Control and Complications Trial) (3,4) and glycated hemoglobin, blood pressure and serum total cholesterol only explained 9–10% of the variation in retinopathy risk in the Wisconsin Epidemiologic Study of Diabetic Retinopathy (WESDR) study (5), suggesting that the remaining ∼90% of the variation in retinopathy risk is presumably explained by other factors.
Genetics is one example of the ‘other risk factors’ involved in the pathogenesis of DR. Twin and epidemiological studies have strongly suggested a genetic component in the etiology of DR (6–10), with heritability scores ranging from 27 to 52% in both type 1 and type 2 diabetes (7–10). There is an increased risk of severe DR among family members of DR subjects (8,9) and in siblings of affected subjects (8,9). Furthermore, several studies have also shown a discrepant rate of the prevalence of DR among different racial ethnic groups in the US population, with a significantly higher prevalence observed among Hispanic, African-American and Chinese-American when compared with Caucasian populations (11). While these differences may partially be attributed to lifestyle factors, evidence from familial aggregation, ethnic differences and heritability clearly supports a genetic contribution in the etiology of DR.
To date, genetic studies on DR have yielded inconsistent results. Several candidate gene studies have reported promising genes; however, few of them have been replicated, and the few positive findings show only weak genetic associations (10,12,13). In genome-wide approaches, three linkage studies performed in Pima Indians and Hispanics have identified regions on chromosomes 1, 3, 9 and 12 to be linked with DR (14–16). However, none of these regions reached genome-wide statistical linkage significance of an LOD (logarithm of odds) score of >3.3, with one study demonstrating an LOD score of 3.01 for single-point analysis and an LOD score of 2.58 for multiple point analysis at 1p36 in the Pima Indians, indicating suggestive evidence of linkage for DR in this population (16). Very recently, genome-wide association studies (GWAS) of modest sample sizes conducted in Hispanics, Chinese and Caucasian populations have found borderline associations with DR in either type 1 or type 2 diabetes (17–19); however, none of these loci has been replicated in other studies.
In this study, we conducted a GWAS with DR phenotypes, one group having no DR based on ophthalmoscopy (controls) and the other having PDR (cases) with similar duration of type 2 diabetes and level of glycated hemoglobin, in 1007 Chinese subjects and then replicated/extended the top findings using two different approaches. One, was an analysis of the top findings in an independent cohort of 585 Hispanics type 2 diabetic subjects with or without DR based on assessment of fundus photographs of the seven standard fields by grading using the modified Airlie House Classification. Two, was an extension study of 479 diabetic type 2 Chinese subjects with clinically intermediate eye phenotypes, defined as non-proliferative DR (NPDR).
RESULTS
A total of 2071 (1486 Chinese and 585 Hispanics) type 2 diabetic subjects were included in this study; the demographics of these two cohorts are summarized in Table 1. The discovery cohort, which includes only Chinese subjects, comes exclusively from the Taiwan–US Diabetic Retinopathy (TUDR) study. The replication cohort, which includes only Hispanics, is from the Genetics of Latinos Diabetic Retinopathy (GOLDR) study. The discovery cohort that underwent GWAS consisted of Chinese subjects at the two ends of the DR spectrum, defined as having type 2 diabetes of greater than 8 years duration without DR (controls, n = 570) and PDR (cases, n = 437). These two groups were virtually identical for the level of HbA1c, duration of diabetes and body mass index (BMI) (Table 1). On the other hand, in GOLDR, cases exhibit a higher HbA1c and a longer duration of diabetes, consistent with the epidemiological risk factors for DR. Furthermore, the Hispanics diabetics have a much higher BMI compared with the Chinese diabetics (Table 1).
Table 1.
Demographics of DR cohorts
| Study | n | Age, years (SEM) | Female, % (n) | DM duration, years (SEM) | HbA1c, mg/dl (SEM) | BMI, kg/m2 (SEM) | ||
|---|---|---|---|---|---|---|---|---|
| TUDR (Chinese) | Extremesa (n = 1007) | Controls (no DR) | 570 | 66.8 (0.5) | 42.4 (241) | 14 (0.3) | 9.0 (0.1) | 24.6 (0.2) |
| Cases (PDR) | 437 | 61.3 (0.5) | 55.7 (243) | 13 (0.3) | 8.9 (0.1) | 24.8 (0.2) | ||
| P-value | <0.0001 | <0.0001 | NS | NS | NS | |||
| Intermediate (n = 479) | NPDR | 479 | 66.4 (0.6) | 47.8 (229) | 11.3 (0.4) | 10.0 (0.1) | 24.0 (0.2) | |
| GOLDR (Hispanics) | DM without DR | Controls (no DR) | 256 | 53.9 (0.7) | 66.8 (171) | 7.2 (0.5) | 7.8 (0.1) | 33.1 (0.4) |
| DM with DR | Cases (DR) | 329 | 53.5 (0.6) | 57.1 (188) | 13.5 (0.4) | 8.9 (0.1) | 31.8 (0.4) | |
| P-value | NS | 0.02 | <0.0001 | <0.0001 | 0.02 |
BMI, body mass index; DM, diabetes mellitus; DR, diabetic retinopathy; GOLDR, Genetics of Latino Diabetic Retinopathy Study; HbA1c, hemoglobin A1c; n, number; NS, not significant; NPDR, non-proliferative diabetic retinopathy; PDR, proliferative diabetic retinopathy; SEM, standard error of the mean; TUDR, Taiwan–US Diabetic Retinopathy Study.
aExtremes defined as diabetics greater than 8 years duration without DR (controls) and proliferative DR (cases).
Plots of the first three principal components show that cases and controls in the discovery cohort had a similar single-nucleotide polymorphism (SNP) distribution (Supplementary Material, Fig. S1A). There were no extreme outliers, defined as subjects greater than 10 standard deviations from the distribution of any component. Subjects in the discovery cohort cluster together with subjects in the CHB + CHD HapMap population (Supplementary Material, Fig. S1B), indicating ethnic similarity and a homogenous group of Chinese subjects.
The estimated genomic inflation factor (λGC) calculated from GWAS was 1.004, providing assurance that significant SNPs identified in our GWAS analysis are unlikely false-positive associations due to either population substructure or cryptic relatedness (Fig. 1A). The top signals from GWAS are on chromosomes 13q22.2 at TBC1D4-COMMD6-UCHL3 (rs9565164, OR = 1.7, P = 1.3 × 10⁻⁷), 2q31.1 at LRP2-BBS5 (rs1399634, OR = 1.5, P = 2.0 × 10⁻⁶) and 2q37.2 at ARL4C-SH3BP4 regions (rs2380261, OR = 1.5, P = 2.1 × 10⁻⁶) (Fig. 1B, Table 2). Imputation did not provide additional SNPs or loci in this data set. Furthermore, the order of the top SNPs did not change much after age and gender adjustments (rs9565164, Padjusted = 4.4 × 10⁻⁷; rs1399634, Padjusted = 4.2 × 10⁻⁶; rs2380261, Padjusted = 4.7 × 10⁻⁶; Table 2). There are 41 SNPs that had a P-value of <5 × 10⁻⁶, and all of these SNPs lie within the top three loci of TBC1D4-COMMD6-UCHL3, LRP2-BBS5 or ARL4C-SH3BP4 (Table 2). A complete list of the summary association for all 2 166 765 imputed SNPs is included as Supplementary Material and these data are made available for future comparisons (Supplementary Material, Table S1). The regional association plots of TBC1D4-COMMD6-UCHL3 (Fig. 2A), LRP2-BBS5 (Fig. 2B) and ARL4C-SH3BP4 (Fig. 2C) loci showed robust signals in these regions. These loci have not previously been reported in the literature to be associated with DR.
Figure 1.

Quantile–quantile plot revealing deviation of association from expected. Estimated genomic inflation factor (λGC) was 1.004 (A). Manhattan plot of GWAS of DR. P-values (minus log-transformed) are shown in a signal intensity plot relative to their genomic position (B).
Table 2.
Genetic loci associated with DR in the Chinese cohort
| SNP | Chr | Position | Minor allele | MAF | Odds ratio | P-value | Padjusteda | Gene(s) |
|---|---|---|---|---|---|---|---|---|
| rs9565164 | 13 | 74 937 377 | C | 0.26 | 1.7 | 1.3E−07 | 4.4E−07 | TBC1D4 |
| rs9573553b | 13 | 74 937 329 | A | 0.26 | 1.7 | 1.6E−07 | 5.4E−07 | TBC1D4 |
| rs9573546b | 13 | 74 930 534 | A | 0.26 | 1.7 | 2.5E−07 | 8.1E−07 | TBC1D4 |
| rs9573545b | 13 | 74 929 967 | A | 0.26 | 1.7 | 2.6E−07 | 8.4E−07 | TBC1D4 |
| rs9565165b | 13 | 74 950 791 | A | 0.26 | 1.7 | 2.6E−07 | 7.7E−07 | TBC1D4 |
| rs7986566b | 13 | 75 095 932 | C | 0.31 | 1.6 | 3.8E−07 | 4.9E−07 | COMMD6-LMO7 |
| rs2031236b | 13 | 75 067 778 | A | 0.30 | 1.6 | 3.9E−07 | 4.7E−07 | UCHL3 |
| rs3783028b | 13 | 75 063 283 | T | 0.30 | 1.6 | 4.0E−07 | 4.7E−07 | UCHL3 |
| rs7317250b | 13 | 75 065 142 | G | 0.30 | 1.6 | 4.0E−07 | 4.7E−07 | UCHL3 |
| rs6562915b | 13 | 75 068 887 | G | 0.30 | 1.6 | 4.0E−07 | 4.7E−07 | UCHL3 |
| rs6562916b | 13 | 75 069 223 | A | 0.30 | 1.6 | 4.0E−07 | 4.7E−07 | UCHL3 |
| rs4885322b | 13 | 75 069 332 | A | 0.30 | 1.6 | 4.0E−07 | 4.7E−07 | UCHL3 |
| rs4885323b | 13 | 75 070 415 | C | 0.30 | 1.6 | 4.0E−07 | 4.7E−07 | UCHL3 |
| rs9543990b | 13 | 75 070 435 | G | 0.30 | 1.6 | 4.0E−07 | 4.7E−07 | UCHL3 |
| rs7996884b | 13 | 75 070 745 | T | 0.30 | 1.6 | 4.0E−07 | 4.7E−07 | UCHL3 |
| rs7982517b | 13 | 75 060 040 | A | 0.29 | 1.6 | 4.1E−07 | 3.0E−07 | UCHL3 |
| rs7339146b | 13 | 75 071 720 | A | 0.30 | 1.6 | 4.2E−07 | 5.0E−07 | UCHL3 |
| rs2328963b | 13 | 75 073 527 | C | 0.31 | 1.6 | 4.4E−07 | 5.1E−07 | UCHL3 |
| rs8192763b | 13 | 75 077 171 | A | 0.31 | 1.6 | 4.4E−07 | 5.2E−07 | UCHL3 |
| rs9565177b | 13 | 75 093 404 | G | 0.31 | 1.6 | 4.7E−07 | 5.6E−07 | COMMD6-LMO7 |
| rs3818355b | 13 | 75 094 868 | C | 0.31 | 1.6 | 4.7E−07 | 5.6E−07 | COMMD6-LMO7 |
| rs7324195b | 13 | 75 090 523 | G | 0.31 | 1.6 | 4.8E−07 | 5.6E−07 | COMMD6-LMO7 |
| rs1535724b | 13 | 75 081 274 | G | 0.31 | 1.6 | 4.8E−07 | 5.7E−07 | COMMD6-LMO7 |
| rs2328964b | 13 | 75 036 831 | G | 0.30 | 1.6 | 5.6E−07 | 6.7E−07 | UCHL3 |
| rs9543976 | 13 | 75 034 649 | G | 0.30 | 1.6 | 6.1E−07 | 7.2E−07 | UCHL3 |
| rs2296146 | 13 | 75 041 573 | C | 0.30 | 1.6 | 6.1E−07 | 7.2E−07 | UCHL3 |
| rs9543956b | 13 | 74 996 661 | T | 0.28 | 1.6 | 1.9E−06 | 3.9E−06 | UCHL3-LMO7 |
| rs9543957b | 13 | 74 997 805 | T | 0.28 | 1.6 | 2.0E−06 | 4.1E−06 | COMMD6 |
| rs1399634b | 2 | 169 952 853 | A | 0.41 | 1.5 | 2.0E−06 | 4.2E−06 | LRP2-BBS5 |
| rs2380261 | 2 | 235 305 919 | T | 0.43 | 1.5 | 2.1E−06 | 4.7E−06 | ARL4C-SH3BP4 |
| rs4643195 | 13 | 75 001 841 | G | 0.28 | 1.6 | 2.3E−06 | 4.7E−06 | COMMD6 |
| rs9573578 | 13 | 75 002 957 | A | 0.28 | 1.6 | 2.3E−06 | 4.7E−06 | COMMD6 |
| rs9573555 | 13 | 74 938 319 | C | 0.29 | 1.6 | 2.5E−06 | 4.6E−06 | TBC1D4 |
| rs9573577 | 13 | 75 001 790 | T | 0.28 | 1.6 | 2.5E−06 | 5.9E−06 | COMMD6 |
| rs4885308b | 13 | 75 004 494 | C | 0.28 | 1.6 | 2.7E−06 | 6.1E−06 | COMMD6 |
| rs4668142 | 2 | 169 972 523 | T | 0.41 | 1.6 | 2.7E−06 | 4.8E−06 | LRP2-BBS5 |
| rs9565170b | 13 | 74 962 660 | C | 0.29 | 1.6 | 3.1E−06 | 1.2E−05 | UCHL3 |
| rs9318349b | 13 | 74 959 947 | T | 0.30 | 1.6 | 4.4E−06 | 1.7E−05 | UCHL3 |
| rs1441605b | 2 | 235 312 105 | G | 0.42 | 1.5 | 4.6E−06 | 7.5E−06 | ARL4C-SH3BP4 |
| rs7335576b | 13 | 74 941 319 | G | 0.30 | 1.6 | 4.9E−06 | 5.7E−06 | TBC1D4 |
| rs4883999b | 13 | 74 940 886 | A | 0.30 | 1.6 | 5.0E−06 | 5.9E−06 | TBC1D4 |
aAdjusted for age and gender; Chr, chromosome; MAF, minor allele frequency.
bImputed SNP.
Figure 2.
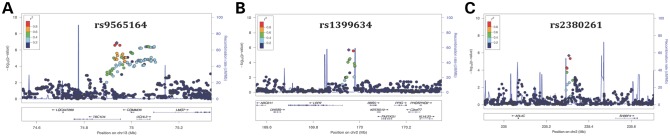
Regional association plot showing chromosomal position and P-value of SNPs in the TBC1D4-COMMD6-UCHL3 (A), LRP2-BBS5 (B) and ARL4C-SH3BP (C) region. The lead SNP of each locus is plotted in purple diamond.
We then performed a meta-analysis with an independent cohort comprising of 585 Hispanics persons with type 2 diabetes with or without DR. The SNP rs1399634 at LRP2-BBS5 failed manufacturing QC, thus alternatively, the SNP rs4668142 (r2 = 0.966) was used in the replication study and extension study. The SNP rs9565164 at TBC1D4-COMMD6-UCHL3 was rare in Hispanics [minor allele frequency (MAF) < 5%], thus the SNP rs9543976 was used in the meta-analysis. In the meta-analysis, none of the top three SNPs indicated a more significant P-value than that was observed in the discovery analysis. Furthermore, the direction of effect was different in two of the three loci between the Chinese and Hispanics population, with similar direction of effect observed only in the TBC1D4-COMMD6-UCHL3 locus (meta P-value = 7.4 × 10⁻⁶; Table 3).
Table 3.
Meta-analysis of top three loci with DR in Chinese and Hispanics
| TUDR (Chinese) |
GOLDR (Hispanics) |
Meta-analysis |
||||||||||||
|---|---|---|---|---|---|---|---|---|---|---|---|---|---|---|
| SNP | Chr | Loci | Allele 1 | Allele 2 | n | Frequency of allele 1 | OR | P-value | n | Frequency of allele 1 | OR | P-value | Meta P-value | Direction |
| rs9543976a | TBC1D4-COMMD6-UCHL3 | G | A | 1007 | 0.30 | 1.6 | 6.1E−07 | 578 | 0.42 | 1.1 | 0.41 | 7.4E−06 | −− | |
| rs4668142 | 2 | LRP2-BBS5 | T | G | 1007 | 0.41 | 1.6 | 2.7E−06 | 573 | 0.75 | 0.9 | 0.57 | 3.6E−04 | +− |
| rs2380261 | 2 | ARL4C-SH3BP4 | T | G | 1007 | 0.43 | 1.5 | 2.1E−06 | 581 | 0.54 | 1.0 | 0.82 | 2.0E−04 | +− |
ars9565164 was rare in Hispanics, thus rs9543976 was used in the meta-analysis.
Given the available clinically intermediate subjects in the Chinese, we extended these top findings in the NPDR group. The risk allele was intermediate in frequency in the NPDR group compared with the PDR cases and normal controls (Supplementary Material, Fig. S2). This trend was not observed in the Hispanics (data not shown).
DISCUSSION
In this study, we identified three potential susceptibility loci, on chromosomes 13q22.2, 2q31.1 and 2q37.2, for DR, and observed that the risk alleles in these regions are possibly associated with DR in the Chinese population. The single best GWAS SNP had a P-value of 1.3 × 10⁻⁷, not quite attaining statistical GWAS significance. Meta-analysis with an independent Hispanic cohort did not confirm these signals.
After our initial discovery effort, we hypothesized that the variants associated with PDR would have intermediate frequency in those with NPDR, given that NPDR comprises a mixture of persons who do and do not go on to develop PDR. While prior epidemiological studies have demonstrated that the duration of diabetes and HbA1c are the major determinants of DR progression, more recent studies have not been as conclusive. In a recent landmark study of 11 140 patients with type 2 diabetes, the ADVANCE trial found that intensive glucose control did not affect the 5-year incidence of retinopathy rates (20). Furthermore, the Los Angeles Latino Eye Study (LALES) found that among Mexican Americans with type 2 diabetes and NPDR at baseline, only 5.3% progressed to PDR at 4-year follow-up, and this finding was not confounded by age at baseline or duration of diabetes (21). Similarly, in the WESDR study, once glycosylated hemoglobin was adjusted for, the progression of NPDR (levels 21/21 to 53/53 on the Early Treatment Diabetic Retinopathy Study severity scheme) to PDR at 10-year follow-up was not different in older subjects with type 2 diabetes who used insulin (12.2–80.5%) compared with those who did not use insulin (10.3–54.5%) (22). Thus, we hypothesized that perhaps NPDR may be a phenotype due to an underlying genotype mixture, with one group at risk of progressing to PDR and another group not at the risk of progressing.
We extended our examination of the top SNPs from three different loci, and found that the intermediate clinical phenotype of NPDR had an intermediate frequency for each of the risk alleles in the Chinese. However, given the fact that the intermediate phenotype group is not an independent population, it is also possible that the detected signals from the discovery cohort could have fluctuated in opposite directions in the cases and controls, resulting in intermediate frequency in the NPDR group by chance alone. Data from an independent population with ethnically matched controls could delineate and confirm these associations.
Nonetheless, these regions have not been implicated previously in other candidate gene (10,12,13), linkage (14–16) or GWAS studies (17–19) in DR of either type 1 or type 2 diabetes. The top SNP rs9565164 is located in the intronic region of TBC1D4 at 13q22.2 and promotes insulin-induced glucose transporter SLC2A4/GLUT4 translocation at the plasma membrane, thus increasing glucose uptake in adipocytes and muscle cells (23). The second gene of this locus, UCHL3, is a deubiquitinating enzyme and promotes insulin-signaling and insulin-induced adipogenesis (24). Furthermore, UCHL3−/− knockout mice revealed ocular phenotypes consistent with retinal degeneration (25). The third gene in this locus, COMMD6, down-regulates tumor necrosis factor (TNF)-induced NF-κB (nuclear factor-κB) activation (26), a role in inflammation, another important processes in the development of DR. Of interest, we have recently shown cross-sectionally and independent of renal disease and other risk factors that the peripheral levels of soluble TNF-receptors 1 and 2 are increased as the severity of DR increases (27). The three genes in this region relate to insulin regulation, inflammation and apoptosis pathways, all of which have been previously implicated in the pathogenesis of DR (28).
The second signal, rs1399634, lies in the intergenic region of LRP2-BBS5 on 2q31.1.The gene LRP2 codes for the protein megalin and is involved with reuptakes of lipoproteins, retinol and vitamin D metabolism (29–31). The second gene in this locus, BBS5, is important in ciliogenesis (32). Both LRP2 and BBS5 have been implicated in retinal and renal dysfunctions, possibility supporting further evidence of the intricate retinal–renal associations observed in many disorders such as diabetic microvascular complications (DR and diabetic nephropathy), systemic lupus erythematosus and Wegener's granulomatosis (31,33–35).
A third locus, represented by the third top signal, rs2380261, lies upstream and possibly in the promoter regions of ARL4C and SH3BP4 on chromosome 2. The ARL4C gene (also known as ARL7) is involved in the vesicular transport process and links to the ABCA1-mediated cholesterol secretion pathway (36). As there is an increasing epidemiological evidence supporting an association between hyperlipidemia and DR (37), our finding may support a genetic contribution in the role of lipids in DR. The SH3BP4 gene functions in the transferrin receptor internalization at the plasma membrane (38) and could play a role in iron-mediated free radical toxicity in the eyes.
Although previous genome-wide linkage and genome-wide association analyses have detected a number of putative susceptibility loci for DR (17–19), none of these studies implicated an association of DR in the regions TBC1D4-COMMD6-UCHL3, LRP2-BBS5 or ARL4C-SH3BP4. In addition, previous studies did not examine the frequency of risk alleles with respect to severity of DR in a step-wise fashion. Some limitations in prior studies include grouping together PDR and diabetic macular edema patients as ‘severe DR’ (19), combining NPDRs and PDRs as “cases” (17,18), and conducting GWAS in modest sample sizes (17,18). It is of interest that of seven genes implicated in this study, two are involved in aspects of insulin signaling in the retina (TBC1D4 and UCHL3), three are involved in mediating retinal cell damage by inflammation, ciliopathy or free-iron radicals (COMMD6, BBS5 and SH3BP4); and two are involved with lipid metabolism (LRP2 and ARL4C), all of which are important pathways in the pathogenesis for DR.
The most important strength of this study may be the analytical approach of conducting GWAS in the two phenotypes, one with no DR the other with PDR despite a similar level of HbA1c, duration of type 2 diabetes and BMI in the Chinese. Duration and HbA1c level are the two most important epidemiological risk factors in the development of DR. Conducting our genetic analysis in this manner minimized the effect of the two potential primary confounders in any genetic analysis of DR, and led to a result just below conventional GWAS significance. Another strength of the study is a relatively large homogenous group of type 2 diabetic Chinese subjects with well-defined eye phenotype recruited exclusively in Taiwan. In addition, this is the largest GWAS of DR in Asians.
Several limitations should also be noted. First, the identified top SNPs did not confirm in an independent Hispanic cohort. There are several possible reasons to account for this lack of confirmation. One is that the identified signals are not trans-ethnically shared between the Chinese and Hispanics with type 2 diabetes. Two, the minor allele frequencies are different in these two populations (for example, the frequency of the T allele at rs4668142 is 0.4 in the Chinese compared with 0.8 in the Hispanics), thus the allelic effect may be different in different populations. Third, there was difficulty with standardization of DR classification and recruitment between the two studies. Different phenotypic classification and grading system, such as those seen in studies of age-related macular degeneration, is likely to lead to different genetic finding (39). A second limitation in this study is the modest sample size used in the replication cohort. The limited sample size in the Hispanics may contribute to a lack of power to statistically detect an association or show a trend in severity as that was seen in the Chinese. Third, using 8 years duration is admittedly an arbitrary cut-off for ‘normal’ subjects in the discovery cohort. Fourth, grouping the broad phenotypic range of NPDR, from mild to severe NPDR, as one clinically ‘intermediate’ phenotype and using this group as an extension study not of an independent population are limitations. Finally, the duration of diabetes was either documented or determined by self-report, possibility raising issues of ascertainment and recall bias. Despite these limitations, this study nominates three possible novel loci as potential susceptibility genes in the development of DR that are independent of the level of HbA1c and duration of diabetes in the Chinese. Additional studies are necessary to further confirm these results and delineate the biologic basis of these associations.
MATERIALS AND METHODS
Ethics statement
The study was conducted according to the principles in the Declaration of Helsinki and approved by the Institutional Review Boards of the participating centers in Taiwan and the USA.
Subjects and phenotyping
Discovery cohort and extension study
The TUDR study is a collaborative effort between Taichung Veterans General Hospital (VGH) in Taiwan and Cedars-Sinai Medical Center (CSMC) in the USA. The primary aim of this study is to identify genetic variants associated with DR. Other ancillary aims include genetic associations for diabetes and diabetic nephropathy. Recruitment occurred at two sites, Taichung VGH and Tri-Service General Hospital (TSGH). The clinical sites were responsible for subject recruitment, physical and ocular examinations, questionnaire administration, physiological and anthropometric phenotyping and patient follow-up. CSMC created the database and data cleaning for this study related to clinical and laboratory data; and conducted DNA extraction, genotyping, bioinformatics and statistical analysis.
A total of 1486 unrelated type 2 diabetic Taiwanese subjects were included in this study. The diagnosis of diabetes was based on standard criteria defined by the American Diabetes Association (40). Duration of diabetes was defined as the time from initial clinical diagnosis of diabetes to ocular assessment, documented in medical charts or by self-report. As discussed, 1007 subjects comprised the discovery cohort and 479 subjects comprised the extension cohort of intermediate clinical phenotypes. Data for vital signs and HbA1c were measured in all subjects as part of routine clinical and laboratory panels and these clinical phenotypes were ascertained at the same time as blood drawing for genotype information.
Fundus examination for the diagnosis of DR was performed by a board-certified ophthalmologist unless documentation of a similar test was done 3 months prior to enrollment. Severity of DR was classified as none, NPDR and PDR based on the International Clinical Diabetic Retinopathy Disease Severity Scale (41). If an uncertainty occurred during the fundus examination, the diagnosis of DR was verified using fluorescein angiography (CF-60UVi fundus camera, Canon, Japan) to determine any retinal ischemia due to capillary non-perfusion. Each participant received two ocular examinations (one per eye); the eye with the more severe retinopathy level was used for the statistical analysis.
Replication cohort
The GOLDR study is a collaborative effort between Harbor-UCLA Medical Center (HUMC), University of Wisconsin and CSMC. The primary aims are investigation of the genetic and biomarker associations of DR is a Hispanic type 2 diabetes cohort, ascertained in families via a proband with DR or diabetes duration of more than 10 years. Severity of DR was assessed by seven standard-fields color fundus photography at the University of Wisconsin graded using the Early Treatment Diabetic Retinopathy Study (ETDRS) severity scale and the modified Airlie House classification scheme. Retinopathy scores are analyzed qualitatively as DM without DR (<14) versus DM with DR (≥14). Detailed recruitment and phenotyping are discussed elsewhere (27).
Genotyping and imputation
Genotyping of extreme phenotypes
DNA samples were extracted from buffy coats using QIAamp DNA Mini Kit (Qiagen, Valencia, CA, USA). All genotyping was performed at the Medical Genetics Institute and the Clinical and Translational Science Institute (CTSI) of CSMC. Infinium technology (42) was used for genotyping subjects with the extreme phenotypes on the whole-genome OmniExpress beadchip, which contains 733 120 SNPs, following the manufacturer's protocol (Illumina, San Diego, CA, USA). All extreme cases and controls were genotyped simultaneously and randomized to reduce batch effects. A total of 1222 samples were successfully genotyped. We removed 10 subjects due to gender discrepancy. Identity by descent was used to exclude related or duplicated individuals (n = 130;  scores >0.12). Furthermore, we removed 31 subjects who did not have type 2 diabetes from the analysis. Twenty-one patients were duplicate subjects with incompatible phenotypes (i.e. with both normal and PDR fundus) and were thus removed. Finally, 16 subjects with changed fundus (i.e. normal fundus at an initial examination and then progressed to NPDR at a subsequent examination who were unintentionally recruited at two different time points) were removed from the initial analysis examining the extreme phenotypes, but were retained in the extension analysis of NPDR in the second portion of this study (Supplementary Material, Table S2). This resulted in 437 cases and 570 controls for a total of 1007 for the GWAS analysis. The average genotyping rate among cases and controls retained in the analysis was >99.93%.
Imputation
In order to infer the untyped genotypes, imputation was performed with Impute2 (43) using haplotype reference panels from HapMap (CEU+CHB+JPT+YRI) with NCBI Build 36. Only SNPs with info >0.4 were used for association analysis.
Genotyping for extension and replication analysis
In a subsequent analysis, genotyping of all subjects in both TUDR and GOLDR was performed on the top three SNPs, one from each locus of the GWAS finding, using the Applied Biosystems TaqMan SNP Genotyping Assays (Life Technologies, Carlsbad, CA, USA). This included both the initial 1007 extreme subjects plus an additional 479 NPDR subjects from TUDR, as well as an additional 585 subjects from GOLDR. TaqMan genotyping call was determined by the relative intensities of the two dyes and also by visual inspection on the allelic discrimination plot. The overall genotyping concordance rate between OmniExpress platform and Taqman genotyping for the TUDR analysis was >0.9997.
Statistical analysis
Population stratification
Principal components analysis using EIGENSTRAT implemented in Helix Tree was conducted to determine the degree of population stratification (44). Ten Eigen values were generated from all GWAS subjects. Extreme outliers, defined as subjects greater than 10 standard deviations from the distribution of any component, were excluded from the analysis (n = 0 for TUDR, Supplementary Material, Table S2 and Fig. S1; n = 0 for GOLDR using genotyping from MetaboChip, data not shown). The first three components were also used to map subjects to the HapMap populations; subjects in TUDR cluster together with the HapMap CHB + CHD populations (Supplementary Material, Fig. S1B).
Statistical analyses
After imputation, SNPs were excluded based on the following: MAF ≤1%, test of Hardy–Weinberg equilibrium P < 10−6, SNP failure rate >10% and imputation quality (info) <0.4. A total of 2 166 765 SNPs passed quality control measures and were used for association testing. Genotyping and disease association were analyzed with logistic regression for the extreme phenotypes (n = 1007) using PLINK (45). Sex chromosomes were not included in the analysis.
The generalized estimation equation model to account for familial correlations was used for association testing in families for the GOLDR cohort via the GWAF package in R (46). Meta-analysis of the top three SNPs from the logistic regression analysis from the GWAS discovery and GOLDR replication cohort was calculated using an inverse variance weighted model using METAL (47). Regional association plots of the top SNPs were generated using LocusZoom (48) and the r2 between SNPs were generated using SNAP (49).
SUPPLEMENTARY MATERIAL
Supplementary Material is available at HMG online.
Conflict of Interest statement. None declared.
FUNDING
This study was supported by the National Eye Institute of the National Institutes of Health (EY014684 to J.I.R., DK079888 to M.O.G.) and ARRA Supplement (EY014684-03S1, -04S1), the National Institute of Diabetes and Digestive and Kidney Disease grant DK063491 to the Southern California Diabetes Endocrinology Research Center, the Eye Birth Defects Foundation Inc., the Cedars-Sinai Winnick Clinical Scholars Award (to M.O.G .), the Cedars-Sinai Board of Governors' Chair in Medical Genetics (to J.I.R .), the National Science Council, Taiwan (NSC 98-2314-B-075A-002-MY3 to W.H.S.) and the Taichung Veterans General Hospital, Taichung, Taiwan (TCVGH-1003001C to W.H.S .). DNA handling and genotyping at Cedars-Sinai Medical Center were supported in part by the National Center for Research Resources, grant UL1RR033176, and is now at the National Center for Advancing Translational Sciences, CTSI grant UL1TR000124. The content is solely the responsibility of the authors and does not necessarily represent the official views of the NIH.
Supplementary Material
REFERENCES
- 1.The Diabetes Control and Complications Trial Research Group. The effect of intensive treatment of diabetes on the development and progression of long-term complications in insulin-dependent diabetes mellitus. N. Engl. J. Med. 1993;329:977–986. doi: 10.1056/NEJM199309303291401. [DOI] [PubMed] [Google Scholar]
- 2.UK Prospective Diabetes Study (UKPDS) Group. Intensive blood-glucose control with sulphonylureas or insulin compared with conventional treatment and risk of complications in patients with type 2 diabetes (UKPDS 33) Lancet. 1998;352:837–853. [PubMed] [Google Scholar]
- 3.Hirsch I.B., Brownlee M. Beyond hemoglobin A1c—need for additional markers of risk for diabetic microvascular complications. JAMA. 2010;303:2291–2292. doi: 10.1001/jama.2010.785. [DOI] [PubMed] [Google Scholar]
- 4.Lachin J.M., Genuth S., Nathan D.M., Zinman B., Rutledge B.N. Effect of glycemic exposure on the risk of microvascular complications in the diabetes control and complications trial—revisited. Diabetes. 2008;57:995–1001. doi: 10.2337/db07-1618. [DOI] [PubMed] [Google Scholar]
- 5.Antonetti D.A., Klein R., Gardner T.W. Diabetic retinopathy. N. Engl. J. Med. 2012;366:1227–1239. doi: 10.1056/NEJMra1005073. [DOI] [PubMed] [Google Scholar]
- 6.Leslie R.D., Pyke D.A. Diabetic retinopathy in identical twins. Diabetes. 1982;31:19–21. doi: 10.2337/diab.31.1.19. [DOI] [PubMed] [Google Scholar]
- 7.The Diabetes Control and Complications Trial Research Group. Clustering of long-term complications in families with diabetes in the diabetes control and complications trial. Diabetes. 1997;46:1829–1839. [PubMed] [Google Scholar]
- 8.Hallman D.M., Huber J.C., Jr, Gonzalez V.H., Klein B.E., Klein R., Hanis C.L. Familial aggregation of severity of diabetic retinopathy in Mexican Americans from Starr County, Texas. Diabetes Care. 2005;28:1163–1168. doi: 10.2337/diacare.28.5.1163. [DOI] [PubMed] [Google Scholar]
- 9.Arar N.H., Freedman B.I., Adler S.G., Iyengar S.K., Chew E.Y., Davis M.D., Satko S.G., Bowden D.W., Duggirala R., Elston R.C., et al. Heritability of the severity of diabetic retinopathy: the FIND-Eye study. Invest. Ophthalmol. Vis. Sci. 2008;49:3839–3845. doi: 10.1167/iovs.07-1633. [DOI] [PMC free article] [PubMed] [Google Scholar]
- 10.Ng D.P. Human genetics of diabetic retinopathy: current perspectives. J. Ophthalmol. 2010 doi: 10.1155/2010/172593. doi:10.1155/2010/172593. [DOI] [PMC free article] [PubMed] [Google Scholar]
- 11.Zhang X., Saaddine J.B., Chou C.F., Cotch M.F., Cheng Y.J., Geiss L.S., Gregg E.W., Albright A.L., Klein B.E., Klein R. Prevalence of diabetic retinopathy in the United States, 2005–2008. JAMA. 2010;304:649–656. doi: 10.1001/jama.2010.1111. [DOI] [PMC free article] [PubMed] [Google Scholar]
- 12.Liew G., Klein R., Wong T.Y. The role of genetics in susceptibility to diabetic retinopathy. Int. Ophthalmol. Clin. 2009;49:35–52. doi: 10.1097/IIO.0b013e31819fd5d7. [DOI] [PMC free article] [PubMed] [Google Scholar]
- 13.Sobrin L., Green T., Sim X., Jensen R.A., Tai E.S., Tay W.T., Wang J.J., Mitchell P., Sandholm N., Liu Y., et al. Candidate gene association study for diabetic retinopathy in persons with Type 2 Diabetes: The Candidate Gene Association Resource (CARe) Invest. Ophthalmol. Vis. Sci. 2011;52:7593–7602. doi: 10.1167/iovs.11-7510. [DOI] [PMC free article] [PubMed] [Google Scholar]
- 14.Hallman D.M., Boerwinkle E., Gonzalez V.H., Klein B.E., Klein R., Hanis C.L. A genome-wide linkage scan for diabetic retinopathy susceptibility genes in Mexican Americans with type 2 diabetes from Starr County, Texas. Diabetes. 2007;56:1167–1173. doi: 10.2337/db06-1373. [DOI] [PubMed] [Google Scholar]
- 15.Imperatore G., Hanson R.L., Pettitt D.J., Kobes S., Bennett P.H., Knowler W.C. Sib-pair linkage analysis for susceptibility genes for microvascular complications among Pima Indians with type 2 diabetes. Pima Diabetes Genes Group. Diabetes. 1998;47:821–830. doi: 10.2337/diabetes.47.5.821. [DOI] [PubMed] [Google Scholar]
- 16.Looker H.C., Nelson R.G., Chew E., Klein R., Klein B.E., Knowler W.C., Hanson R.L. Genome-wide linkage analyses to identify loci for diabetic retinopathy. Diabetes. 2007;56:1160–1166. doi: 10.2337/db06-1299. [DOI] [PubMed] [Google Scholar]
- 17.Fu Y.P., Hallman D.M., Gonzalez V.H., Klein B.E., Klein R., Hayes M.G., Cox N.J., Bell G.I., Hanis C.L. Identification of diabetic retinopathy genes through a genome-wide association study among Mexican-Americans from Starr County, Texas. J. Ophthalmol. 2010 doi: 10.1155/2010/861291. doi:10.1155/2010/861291. [DOI] [PMC free article] [PubMed] [Google Scholar]
- 18.Huang Y.C., Lin J.M., Lin H.J., Chen C.C., Chen S.Y., Tsai C.H., Tsai F.J. Genome-wide association study of diabetic retinopathy in a Taiwanese population. Ophthalmology. 2011;118:642–648. doi: 10.1016/j.ophtha.2010.07.020. [DOI] [PubMed] [Google Scholar]
- 19.Grassi M.A., Tikhomirov A., Ramalingam S., Below J.E., Cox N.J., Nicolae D.L. Genome-wide meta-analysis for severe diabetic retinopathy. Hum. Mol. Genet. 2011;20:2472–2481. doi: 10.1093/hmg/ddr121. [DOI] [PMC free article] [PubMed] [Google Scholar]
- 20.Patel A., MacMahon S., Chalmers J., Neal B., Billot L., Woodward M., Marre M., Cooper M., Glasziou P., Grobbee D., et al. Intensive blood glucose control and vascular outcomes in patients with type 2 diabetes. N. Engl. J. Med. 2008;358:2560–2572. doi: 10.1056/NEJMoa0802987. [DOI] [PubMed] [Google Scholar]
- 21.Varma R., Choudhury F., Klein R., Chung J., Torres M., Azen S.P. Four-year incidence and progression of diabetic retinopathy and macular edema: the Los Angeles Latino Eye Study. Am. J. Ophthalmol. 2010;149:752–761. doi: 10.1016/j.ajo.2009.11.014. e751–753. [DOI] [PMC free article] [PubMed] [Google Scholar]
- 22.Klein R., Klein B.E., Moss S.E., Cruickshanks K.J. The Wisconsin Epidemiologic Study of diabetic retinopathy. XIV. Ten-year incidence and progression of diabetic retinopathy. Arch. Ophthalmol. 1994;112:1217–1228. doi: 10.1001/archopht.1994.01090210105023. [DOI] [PubMed] [Google Scholar]
- 23.Baus D., Heermeier K., De Hoop M., Metz-Weidmann C., Gassenhuber J., Dittrich W., Welte S., Tennagels N. Identification of a novel AS160 splice variant that regulates GLUT4 translocation and glucose-uptake in rat muscle cells. Cell. Signal. 2008;20:2237–2246. doi: 10.1016/j.cellsig.2008.08.010. [DOI] [PubMed] [Google Scholar]
- 24.Suzuki M., Setsuie R., Wada K. Ubiquitin carboxyl-terminal hydrolase l3 promotes insulin signaling and adipogenesis. Endocrinology. 2009;150:5230–5239. doi: 10.1210/en.2009-0332. [DOI] [PubMed] [Google Scholar]
- 25.Sano Y., Furuta A., Setsuie R., Kikuchi H., Wang Y.L., Sakurai M., Kwon J., Noda M., Wada K. Photoreceptor cell apoptosis in the retinal degeneration of UCHL3-deficient mice. Am. J. Pathol. 2006;169:132–141. doi: 10.2353/ajpath.2006.060085. [DOI] [PMC free article] [PubMed] [Google Scholar]
- 26.de Bie P., van de Sluis B., Burstein E., Duran K.J., Berger R., Duckett C.S., Wijmenga C., Klomp L.W. Characterization of COMMD protein-protein interactions in NF-kappaB signalling. Biochem. J. 2006;398:63–71. doi: 10.1042/BJ20051664. [DOI] [PMC free article] [PubMed] [Google Scholar]
- 27.Kuo J.Z., Guo X., Klein R., Klein B.E., Cui J., Rotter J.I., Ipp E., Chen Y.D. Systemic soluble tumor necrosis factor receptors 1 and 2 are associated with severity of diabetic retinopathy in Hispanics. Ophthalmology. 2012;119:1041–1046. doi: 10.1016/j.ophtha.2011.10.040. [DOI] [PMC free article] [PubMed] [Google Scholar]
- 28.Cheung N., Mitchell P., Wong T.Y. Diabetic retinopathy. Lancet. 2010;376:124–136. doi: 10.1016/S0140-6736(09)62124-3. [DOI] [PubMed] [Google Scholar]
- 29.Raila J., Willnow T.E., Schweigert F.J. Megalin-mediated reuptake of retinol in the kidneys of mice is essential for vitamin A homeostasis. J. Nutr. 2005;135:2512–2516. doi: 10.1093/jn/135.11.2512. [DOI] [PubMed] [Google Scholar]
- 30.Nykjaer A., Dragun D., Walther D., Vorum H., Jacobsen C., Herz J., Melsen F., Christensen E.I., Willnow T.E. An endocytic pathway essential for renal uptake and activation of the steroid 25-(OH) vitamin D3. Cell. 1999;96:507–515. doi: 10.1016/s0092-8674(00)80655-8. [DOI] [PubMed] [Google Scholar]
- 31.Kantarci S., Al-Gazali L., Hill R.S., Donnai D., Black G.C., Bieth E., Chassaing N., Lacombe D., Devriendt K., Teebi A., et al. Mutations in LRP2, which encodes the multiligand receptor megalin, cause Donnai-Barrow and facio-oculo-acoustico-renal syndromes. Nat. Genet. 2007;39:957–959. doi: 10.1038/ng2063. [DOI] [PMC free article] [PubMed] [Google Scholar]
- 32.Loktev A.V., Zhang Q., Beck J.S., Searby C.C., Scheetz T.E., Bazan J.F., Slusarski D.C., Sheffield V.C., Jackson P.K., Nachury M.V. A BBSome subunit links ciliogenesis, microtubule stability, and acetylation. Dev. Cell. 2008;15:854–865. doi: 10.1016/j.devcel.2008.11.001. [DOI] [PubMed] [Google Scholar]
- 33.D'Souza Y.B., Short C.D. The eye—a window on the kidney. Nephrol. Dial. Transplant. 2009;24:3582–3584. doi: 10.1093/ndt/gfp406. [DOI] [PubMed] [Google Scholar]
- 34.Nachury M.V., Loktev A.V., Zhang Q., Westlake C.J., Peranen J., Merdes A., Slusarski D.C., Scheller R.H., Bazan J.F., Sheffield V.C., et al. A core complex of BBS proteins cooperates with the GTPase Rab8 to promote ciliary membrane biogenesis. Cell. 2007;129:1201–1213. doi: 10.1016/j.cell.2007.03.053. [DOI] [PubMed] [Google Scholar]
- 35.Mockel A., Perdomo Y., Stutzmann F., Letsch J., Marion V., Dollfus H. Retinal dystrophy in Bardet-Biedl syndrome and related syndromic ciliopathies. Prog. Retin. Eye Res. 2011;30:258–274. doi: 10.1016/j.preteyeres.2011.03.001. [DOI] [PubMed] [Google Scholar]
- 36.Engel T., Lueken A., Bode G., Hobohm U., Lorkowski S., Schlueter B., Rust S., Cullen P., Pech M., Assmann G., et al. ADP-ribosylation factor (ARF)-like 7 (ARL7) is induced by cholesterol loading and participates in apolipoprotein AI-dependent cholesterol export. FEBS Lett. 2004;566:241–246. doi: 10.1016/j.febslet.2004.04.048. [DOI] [PubMed] [Google Scholar]
- 37.Lim L.S., Wong T.Y. Lipids and diabetic retinopathy. Expert Opin. Biol. Ther. 2012;12:93–105. doi: 10.1517/14712598.2012.641531. [DOI] [PubMed] [Google Scholar]
- 38.Tosoni D., Puri C., Confalonieri S., Salcini A.E., De Camilli P., Tacchetti C., Di Fiore P.P. TTP specifically regulates the internalization of the transferrin receptor. Cell. 2005;123:875–888. doi: 10.1016/j.cell.2005.10.021. [DOI] [PubMed] [Google Scholar]
- 39.Swaroop A., Branham K.E., Chen W., Abecasis G. Genetic susceptibility to age-related macular degeneration: a paradigm for dissecting complex disease traits. Hum. Mol. Genet. 2007;16(Spec No. 2):R174–R182. doi: 10.1093/hmg/ddm212. [DOI] [PubMed] [Google Scholar]
- 40.American Diabetes Association. Standards of medical care in diabetes–2011. Diabetes Care. 2011;34(Suppl. 1):S11–S61. doi: 10.2337/dc11-S011. [DOI] [PMC free article] [PubMed] [Google Scholar]
- 41.Wilkinson C.P., Ferris F.L., 3rd, Klein R.E., Lee P.P., Agardh C.D., Davis M., Dills D., Kampik A., Pararajasegaram R., Verdaguer J.T. Proposed international clinical diabetic retinopathy and diabetic macular edema disease severity scales. Ophthalmology. 2003;110:1677–1682. doi: 10.1016/S0161-6420(03)00475-5. [DOI] [PubMed] [Google Scholar]
- 42.Gunderson K.L., Steemers F.J., Ren H., Ng P., Zhou L., Tsan C., Chang W., Bullis D., Musmacker J., King C., et al. Whole-genome genotyping. Methods Enzymol. 2006;410:359–376. doi: 10.1016/S0076-6879(06)10017-8. [DOI] [PubMed] [Google Scholar]
- 43.Howie B.N., Donnelly P., Marchini J. A flexible and accurate genotype imputation method for the next generation of genome-wide association studies. PLoS Genetics. 2009;5:e1000529. doi: 10.1371/journal.pgen.1000529. [DOI] [PMC free article] [PubMed] [Google Scholar]
- 44.Price A.L., Patterson N.J., Plenge R.M., Weinblatt M.E., Shadick N.A., Reich D. Principal components analysis corrects for stratification in genome-wide association studies. Nat. Genet. 2006;38:904–909. doi: 10.1038/ng1847. [DOI] [PubMed] [Google Scholar]
- 45.Purcell S., Neale B., Todd-Brown K., Thomas L., Ferreira M.A., Bender D., Maller J., Sklar P., de Bakker P.I., Daly M.J., et al. PLINK: a tool set for whole-genome association and population-based linkage analyses. Am. J. Hum. Genet. 2007;81:559–575. doi: 10.1086/519795. [DOI] [PMC free article] [PubMed] [Google Scholar]
- 46.Chen M.H., Yang Q. GWAF: an R package for genome-wide association analyses with family data. Bioinformatics. 2010;26:580–581. doi: 10.1093/bioinformatics/btp710. [DOI] [PMC free article] [PubMed] [Google Scholar]
- 47.Willer C.J., Li Y., Abecasis G.R. METAL: fast and efficient meta-analysis of genomewide association scans. Bioinformatics. 2010;26:2190–2191. doi: 10.1093/bioinformatics/btq340. [DOI] [PMC free article] [PubMed] [Google Scholar]
- 48.Pruim R.J., Welch R.P., Sanna S., Teslovich T.M., Chines P.S., Gliedt T.P., Boehnke M., Abecasis G.R., Willer C.J. LocusZoom: regional visualization of genome-wide association scan results. Bioinformatics. 2010;26:2336–2337. doi: 10.1093/bioinformatics/btq419. [DOI] [PMC free article] [PubMed] [Google Scholar]
- 49.Johnson A.D., Handsaker R.E., Pulit S.L., Nizzari M.M., O'Donnell C.J., de Bakker P.I. SNAP: a web-based tool for identification and annotation of proxy SNPs using HapMap. Bioinformatics. 2008;24:2938–2939. doi: 10.1093/bioinformatics/btn564. [DOI] [PMC free article] [PubMed] [Google Scholar]
Associated Data
This section collects any data citations, data availability statements, or supplementary materials included in this article.