

Abstract
Introduction:
Our objective was to determine the proportion of publications arising from abstracts presented at the Quebec Urological Association (QUA). We wanted to analyze differences in publication rates according to certain parameters, and to examine the quality of publications using journal impact factors.
Methods:
All abstracts presented at the annual meetings of the QUA between 2000 and 2010 were obtained from the QUA archives and searched using the PubMed database. Variables included: institute, number of abstracts presented, year of presentation and publication, impact factor of publishing journal (according to 2010 Thomson Reuters report), time to publication (months), research type, presenter and location of research. Kaplan Meier methods were used for analysis.
Results:
By May 2012, 248 out of 439 abstracts (QUA 2000 to 2010) were published in peer-reviewed journals, resulting in a publication rate of 56%. There were significant differences in publication rates according to institution, research type and location of research. Researchers from non-Quebec institutions were twice as likely to publish compared to those from Quebec institutions (Cox HR 2.13, CI 1.20–3.76, p < 0.01).
Discussion:
The QUA publication rate was considerably higher than previously studied by the American Urological Association (37.8%) and British Association of Urological Surgeons (≈42%); however length of follow-up and presentation types differed. Research conducted outside Quebec was more likely to be published, reflecting the multi-institution robust study designs and higher level of evidence. Factors influencing publication deserve further attention, and clinicians are encouraged to conduct research with intent to publish.
See related article on page e455.
Introduction
Annual meetings, including the Canadian Urological Association (CUA), American Urological Association (AUA) and European Urological Association (EUA), are attended by practitioners from all over the world, with the goal of extrapolating novel and up-to-date evidence and recommendation from research lead by pioneers in the different urological disciplines. On a smaller scale, the Quebec Urological Association (QUA) is an annual scientific meeting of urologists practicing in the province of Quebec. At the QUA, clinical and basic science research is presented.
Publication rates from presentations and their corresponding journal statuses can serve as robust measures to quantify the merit and quality of these annual scientific meetings. Previously the AUA and the British Association of Urological Surgeons (BAUS) have reported publication rates of 37.8% and 40% over a 2- and 3-year period,1,2 and the CUA has studied the percentage of publications by their individual active members.3 These reports aim to highlight the importance of validating research by transforming the verbal and graphical form of evidence relayed in presentation and poster, to a publication in peer-reviewed journal that undergoes review of study design, methodology and results. The factors governing publication rates were also examined with results yielding no significant predictors. The quality of these publications however was not objectively examined.
In this report, we determine the publication rate of presentations at the QUA annual meetings over a 10-year period, and analyzed predictors of publication rate. In addition, we examined the quality of the subsequent publications by looking at journal impact factors (IF).
Methods
We included all abstracts accepted for presentation at the annual QUA meetings from 2000 to 2010. The abstract lists were retrieved from the director of administration at the QUA. The annual meetings included only podium presentations. Subsequently, each of the abstracts was searched on PubMed. The abstracts were searched using the first author of the abstract presentation and several sections from the title. If no corresponding paper was retrieved, then the following authors in order and keywords from the title were used. Once a matching publication was found, its abstract was then reviewed. The match was confirmed based on near identical title, hypothesis, cohort and study design.
The following variables were then entered into a dataset including: abstract number, year of presentation, publications status and year of publication, time to publication in months, corresponding journal, journal IF, institution (anonymous Quebec institutions 1 to 4 representing the 4 faculties of medicine and non-Quebec institutions categorized into 1 group), research type (basic science vs. clinical), presenter (staff vs. student/resident/fellow), and location of conducted research (Quebec vs. outside Quebec). The first of the month of each corresponding annual meeting and the first of the month of publication were used for time to presentation analysis. Publications before the date of presentation were classified as published by day 1. The latest Thomson Reuter report of Journals’ impact factors was used.
Our analyses were similar to the AUA and BAUS studies.1,2 Using the STATA analysis software (Stata Corporation, College Station, TX), crude percentages and means were first computed in an aggregate manner and then stratified by institution, and ANOVA tests used to test differences. Kaplan-Meier analysis was used to analyze the rate at which presentations remained unpublished. Univariate and multivariate predictors of successful publication were also examined using log-rank tests and Cox regression models. Assessed variables included: institution, research type, presenter and location of research. A p value <0.05 was deemed significant, percentages were rounded up to the nearest number, and means were rounded up to 1 and 2 decimal places.
Results
A total of 439 abstracts were podium presentations at the annual QUA meetings from 2000 to 2010. As of May 2012, 248 of these were published in peer-reviewed journals (56%). Of these presentations, 388 were presented by Quebec institutions and 51 were presented by non-Quebec institutions (88% vs. 12%). The aggregate crude mean time to publication was 19.5 months. Most presentations were clinical research (76%) and performed by residents and fellows (70%). We tallied descriptive data stratified by institution (Table 1). Institute #4 demonstrated the highest percentage of publications, however the journals had the lowest mean IF.
Table 1.
Number of abstracts presented at QUA and their subsequent publications stratified by institution (2000–2010)
| Institute | Abstracts (n=439) | Published (%) (n=248, 56%) | Mean IF (range) | Mean time (months, 95% CI) |
|---|---|---|---|---|
| 1 | 144 | 94 (65) | 3.18 (0.59–8.84) | 21.8 (17.7–25.8) |
| 2 | 163 | 82 (50) | 4.49 (0.86–14.69) | 16.9 (14.1–19.6) |
| 3 | 67 | 26 (39) | 3.11 (0.61–8.84) | 28.3 (19.1–37.5) |
| 4 | 14 | 10 (71) | 2.87 (0.61–8.84) | 23.3 (12.6–33.9) |
| Non-Quebec | 51 | 36 (70) | 4.97 (0.85–33.6) | 12.3 (8.1–16.6) |
| p value* | <0.001 | 0.04 | 0.02 |
IF: impact factor; CI: confidence interval;
ANOVA test.
We illustrated the Kaplan Meier analysis for the proportion of publications that remain unpublished (Fig. 1), which demonstrated that by 50 months (4 years) less than 50% of presentations remain unpublished, and by the end of our follow-up (11 years), 40% remain unpublished yielding a publication rate of about 60%. Univariate analysis using log rank tests demonstrated institution, research type and location as significant predictors of publication (Table 2). In multivariate analysis, non-Quebec research was twice as likely to be published compared to Quebec research; location of research was the only significant predictor on multivariate analysis.
Fig. 1.
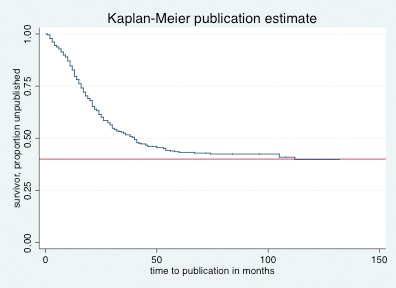
Kaplan Meier analysis for the rate of presentations that remain unpublished (horizontal line denotes the cut-off at 0.40).
Table 2.
Univariate and multivariate analysis
| Variable | Log rank test p value (Univariate) | Cox-regression model (95% CI) (Multivariate) | p value |
|---|---|---|---|
| Institute | |||
| 1 | <0.01 | 1 | |
| 2 | 0.74 (0.53–1.02) | 0.07 | |
| 3 | 0.52 (0.33–0.82) | 0.01 | |
| 4 | 1.27 (0.65–2.46) | 0.47 | |
| Non-Quebec | 1.78 (0.41–1.46) | 0.44 | |
| Research type | |||
| Basic science | <0.01 | 1 | |
| Clinical | 0.98 (0.72–1.33) | 0.91 | |
| Presenter | |||
| Staff | 0.87 | 1 | |
| Student/resident/fellow | 1.33 (0.96–1.85) | 0.08 | |
| Location | |||
| Quebec | <0.01 | 1 | |
| Non-Quebec | 2.13 (1.20–3.76) | 0.01 |
CI: confidence interval.
Discussion
The quality of the QUA Annual Meeting can be quantified by the number of publications arising from the presentations and the status of the journals publishing the research. We document a publication rate of 56% (about 60% on Kaplan Meier analysis) that is higher than that previously reported by the AUA and BAUS. However, the length of follow-up and scale of each scientific meeting differs. Our analysis however also shows that the time to publication is considerably longer compared to the AUA and BAUS. Our smaller group and attendance compared to the AUA might explain the relatively higher proportion of publications, however one would expect the competition and possibly higher standards of the AUA to translate into higher rates of publication.
Our stratified analysis according to institution shows discrepancy between the highest publication rate and the lowest mean IF, which highlights the important point that quantity and quality of publications are not necessarily related. The IF, devised originally in the 1960s, is the most widely used method of rating quality of published evidence,4 and is defined as the mean citation rate, during that given year, of the papers published in that journal during the previous 2 years. The IF can be perceived as a fortifying measure of journal quality, its papers and corresponding authors. Researchers consider IFs when choosing their publication outlets, journal editors formulate policies explicitly designed to improve their IFs, and publishers advertise their IFs on their websites to further magnify this proxy measure of quality. However, we also acknowledge the limitations of the IF.5 The value of the IF is affected by sociological and statistical factors. Sociological factors include the subject area of the journal, the type of journal (letters to editor, papers, reviews), and the average number of authors per paper (which is related to subject area). Statistical factors include the size of the journal and the citation measurement window; as statistical measures, these factors fluctuate by year so that great care needs to be taken in interpreting changes in IF. Journals in medical fields frequently contain many more types of source items than the standard research journal, hence, errors can arise in ensuring the right types of article are counted in calculating the IF.
Within our study, the institution, research type and location of research were all significant predictors of publication. There may be several reasons for this significance. Different institutions will inherently have varying specialists, resources and capabilities that inevitably confer diverse research weight to each. In addition, significant differences exist between basic science research and clinical research projects, and ease for publication especially in a clinical discipline and/or meeting. Multivariable analysis demonstrated that location of research was the only significant independent predictor of publication. Interestingly, other authors have cited research that examined the lack of time and equal incentives, lack of interest in publication, and positive versus negative result bias as potential factors that warrant further attention.6,7
Inherently, our study includes its own limitations. During the search for publications, if information from the abstract was buried in another article, this abstract would not have been retrieved and not counted as published. This would inevitably decrease the true publication rate. A second limitation is the use of the PubMed database. Bearing in mind that the PubMed database encases the vast majority of urology journals, about 80% of published studies are accounted for by the database, hence some publications from the QUA might be part of the 20% not included in the PubMed database.8 Our English-language restriction may also under-represent publications in other languages, especially in the context of Quebec where French is the principal language in most universities.
Conclusion
About 60% of the abstracts presented at the QUA are ultimately published in peer-reviewed journals with reasonably good IFs. However, this conversion takes longer compared to other major urology scientific meetings, but closely resembles the high publication rates of other scientific meetings in other medical disciplines. Nevertheless, a significant proportion of research presentations at the QUA remain unpublished. Thus, QUA presenters should be encouraged to complete their research work and to publish in peer-reviewed publications.
Footnotes
Competing interests: None declared.
This paper has been peer-reviewed.
References
- 1.Ng L, Hersey K, Fleshner N. Publication rate of abstracts presented at the annual meeting of the American Urological Association. BJU Int. 2004;94:79–81. doi: 10.1111/j.1464-410X.2004.04905.x. [DOI] [PubMed] [Google Scholar]
- 2.Rao AR, Beatty JD, Laniado M, et al. Publication rate of abstracts presented at the British Association of Urological Surgeons Annual Meeting. BJU Int. 2006;97:306–9. doi: 10.1111/j.1464-410X.2006.05863.x. Published online June 12, 2013 (early released November 14, 2012). [DOI] [PubMed] [Google Scholar]
- 3.Gotto G T, Afshar K, Eftekhari A, et al. Peer-reviewed publications by CUA members: then and now. Can Urol Assoc J. 2010;4:385–90. doi: 10.5489/cuaj.950. [DOI] [PMC free article] [PubMed] [Google Scholar]
- 4.Archambault É, Larivière V. History of the journal impact factor: contingencies and consequences. Scientometrics. 2009;79:635–49. doi: 10.1007/s11192-007-2036-x. [DOI] [Google Scholar]
- 5.Larivière V, Gingras Y, Archambault É. The decline in the concentration of citations, 1900–2007. J Am Soc Inf Sci Technol. 2009;60:858–62. doi: 10.1002/asi.21011. [DOI] [Google Scholar]
- 6.Dickersin K, Min YI, Meinert CL. Factors influencing publication of research results. Follow-up of applications, submitted to two institutional review boards. JAMA. 1992;267:374–8. doi: 10.1001/jama.1992.03480030052036. Published online June 12, 2013 (early released November 14, 2012). [DOI] [PubMed] [Google Scholar]
- 7.Dickersin K, Min YI. Publication bias: the problem that won’t go away. Ann N Y Acad Sci. 1993;703:135–48. doi: 10.1111/j.1749-6632.1993.tb26343.x. [DOI] [PubMed] [Google Scholar]
- 8.Timmer A, Blum T, Lankisch PG. Publication rates following pancreas meetings. Pancreas. 2001;23:212–5. doi: 10.1097/00006676-200108000-00012. [DOI] [PubMed] [Google Scholar]