Abstract
Purpose
To demonstrate the feasibility of evaluating the articular cartilage of the knee joint at 3.0T using gradient refocused acquisition in the steady-state (GRASS) and iterative decomposition of water and fat with echo asymmetry and least-squares estimation (IDEAL) fat-water separation.
Materials and Methods
Bloch equation simulations and a clinical pilot study (n = 10 knees) were performed to determine the influence of flip angle of the IDEAL-GRASS sequence on the signal-to-noise ratio (SNR) of cartilage and synovial fluid and the contrast-to-noise ratio (CNR) between cartilage and synovial fluid at 3.0T. The optimized IDEAL-GRASS sequence was then performed on 30 symptomatic patients as part of the routine 3.0T knee MRI examination at our institution.
Results
The optimal flip angle was 50° for IDEAL-GRASS cartilage imaging, which maximized contrast between cartilage and synovial fluid. The IDEAL-GRASS sequence consistently produced high-quality fat- and water-separated images of the knee with bright synovial fluid and 0.39 × 0.67 × 1.0 mm resolution in 5 minutes. IDEAL-GRASS images had high cartilage SNR and high contrast between cartilage and adjacent joint structures. The IDEAL-GRASS sequence provided excellent visualization of cartilage lesions in all patients.
Conclusion
The IDEAL-GRASS sequence shows promise for use as a morphologic cartilage imaging sequence at 3.0T.
Keywords: IDEAL, fat-water separation, magnetic resonance imaging, cartilage, knee
MAGNETIC RESONANCE IMAGING (MRI) is the modality of choice for noninvasive morphologic evaluation of articular cartilage (1). With promising new treatment options available for patients with osteoarthritis and posttraumatic cartilage defects, there is increased need for detecting early morphologic changes of articular cartilage (2-6). Cartilage volume measurements are also an important component of research studies designed to better understand the pathogenesis of osteoarthritis and to evaluate the efficacy of newly developed disease-modifying agents (7,8). For these reasons there has been much recent effort to develop MRI pulse sequences that allow more accurate assessment of cartilage morphology (9).
MRI sequences used to evaluate cartilage morphology can be broadly divided into dark fluid and bright fluid sequences, depending on the signal intensity of synovial fluid. Dark fluid cartilage imaging is primarily performed using spoiled gradient recalled-echo (SPGR) sequences. SPGR sequences have been successfully used to evaluate articular cartilage in clinical practice (10,11) and to perform cartilage volume measurements in research studies (12-15). However, the main disadvantage of using these sequences for clinical cartilage imaging is the low signal intensity of synovial fluid, which may decrease the conspicuity of superficial cartilage lesions (16,17).
Bright fluid cartilage imaging sequences include T2-weighted and intermediate-weighted fast spin-echo (FSE) (16,18-20), driven equilibrium Fourier transform (DEFT) (21), dual echo in the steady-state (DESS) (22,23), and various steady-state free-precession (SSFP) sequences (24-28). Bright fluid sequences are especially useful for clinical cartilage imaging since the high signal intensity synovial fluid creates an arthrogram-like effect against the intermediate-to-low signal intensity articular cartilage. However, there are disadvantages associated with all currently available bright fluid cartilage imaging sequences. Intermediate-weighted FSE images suffer from blurring due to the acquisition of high spatial frequencies late in the echo train. T2-weighted FSE images have poor contrast between articular cartilage and subchondral bone, which makes it difficult to detect diffuse cartilage thinning and to determine the exact thickness of focal cartilage defects. On DESS images it is often difficult to delineate articular cartilage when synovial fluid is not present within the joint to create an arthrogram-like effect. SSFP images are prone to banding artifact in areas of magnetic susceptibility, which is particularly severe at 3.0T.
Gradient refocused acquisition in the steady-state (GRASS) is another sequence that can produce three-dimensional images of the knee with bright synovial fluid due to coherence of transverse magnetization with secondary T2 weighting. GRASS sequences have been previously used to evaluate the articular cartilage of the knee joint (29-31). Suppressing signal from adipose tissue can improve GRASS cartilage assessment by reducing chemical shift artifact and by optimizing the overall dynamic contrast range of the images (32). However, there are no previously published studies on the evaluation of articular cartilage using a fat-suppressed GRASS sequence. This is perhaps secondary to the poor signal-to-noise ratio (SNR) efficiency of currently available fat-suppressed GRASS sequences that prevents them from providing complete anatomic coverage of the knee joint in a reasonable scan time.
Iterative decomposition of water and fat with echo asymmetry and least-squares estimation (IDEAL) is a recently developed chemical shift-based technique that may be useful for providing fat-water separation for GRASS cartilage imaging. IDEAL is a three-point fat-water separation method that uses asymmetric echoes and least-squares estimation in order to achieve the maximum possible SNR performance. Echo shifts are optimized to provide the most effective signal averaging at 3.0T (33-36). Signal from the source images is decomposed into separate fat and water signals using a least-squares solution matrix inversion (37). Once fat and water have been separated they can be recombined into in-phase (water+fat) and out-of-phase (water−fat) images after correction for chemical shift artifact in the readout direction (34,35,37).
IDEAL fat-water separation has been previously used in SPGR (38) and SSFP (25) cartilage imaging. This study was performed to demonstrate the feasibility of combining IDEAL fat-water separation with a GRASS sequence to produce high-quality 3D images of the knee with bright synovial fluid at 3.0T. This study was also performed to provide a preliminary comparison of the IDEAL-GRASS and IDEAL-SPGR sequences for evaluating articular cartilage and to demonstrate the usefulness of the IDEAL-GRASS sequence for clinical cartilage imaging.
MATERIALS AND METHODS
The study was approved by our Institutional Review Board and was performed in compliance with HIPAA regulations. Informed consent was obtained from all subjects prior to their participation in the study.
Optimization of IDEAL-GRASS Sequence
The echo time (TE) values of the IDEAL-GRASS sequence were based on previous work by Pineda et al (33) and Reeder et al (35), which showed that optimal SNR performance is achieved when the phase between fat and water for the center echo is π/2 + k π (k is any integer), ie, when water and fat signals are in quadrature. The two remaining echoes are placed before and after the center echo by a water-fat phase shift of 2π/3 relative to the center echo. The shortest group of echoes is optimal for IDEAL-GRASS cartilage imaging to maximize SNR efficiency and to minimize the loss of signal from articular cartilage and other joint structures secondary to T2* decay. However, the choice of the echo group, determined by the echo group index k, will depend on the minimum possible TE of the sequence. To be compatible with the minimum possible TE of the IDEAL-GRASS sequence, an echo group index k of 4 was required at 3.0T. Based on the water-fat chemical shift of –420 Hz at 3.0T, this resulted in optimal TE values of 4.4 msec, 5.4 msec, and 6.1 msec.
A repetition time (TR) of 10 msec was used for the IDEAL-GRASS sequence. This was the shortest TR compatible with the optimal echo group of 4.4 msec, 5.4 msec, and 6.1 msec needed for IDEAL fat-water separation. The short TR of the IDEAL-GRASS is important to maintain steady-state transverse magnetization and to reduce overall scan time. Minimizing TR in refocused steady-state sequences such as GRASS is widely understood to produce maximum image contrast per unit time and to reduce the deleterious effects of motion (22,39).
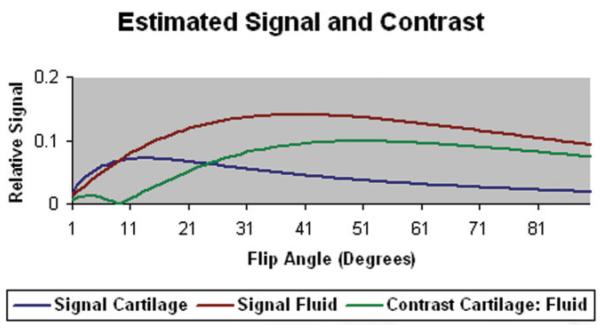
The optimal flip angle for IDEAL-GRASS cartilage imaging was determined using Bloch equation simulations. Unlike SPGR imaging, which has analytic solutions for its signal behavior, GRASS signal behavior is far more complex, requiring the use of Bloch equation simulations to determine the optimal flip angle for cartilage imaging. Simulations were performed to assess the influence of flip angle on the SNR of articular cartilage and synovial fluid and the contrast-to-noise ratio (CNR) between articular cartilage and synovial fluid. For the computer simulations, a TR of 10 msec, a TE of 4.4 msec, and previously published relaxation parameters for articular cartilage (T1= 1240 msec and T2= 37 msec) and synovial fluid (T1= 3620 msec and T2= 767 msec) at 3.0T (40) were used.
The Bloch equation simulations were validated in a clinical pilot study involving 10 knees in five asymptomatic volunteers (four males and one female; age range, 27–31 years, average age 29 years). All five subjects underwent an MRI examination of both knees on the same General Electric 3.0T scanner (HDx, GE Healthcare, Waukesha, WI) using a single-channel extremity coil. The IDEAL-GRASS sequence was performed during all MRI examinations using the following imaging parameters: 20°, 30°, 40°, 50°, and 60° flip angles, TR = 10 msec, TE = 4.4/5.4/6.1 msec, 2.5 mm slice thickness, 384 × 224 matrix, 15 cm field of view, ±41.47 kHz bandwidth, 1 signal average, and 4:20 minutes acquisition time.
For each MRI examination the SNR of articular cartilage, synovial fluid, subchondral bone, and muscle and the CNR between articular cartilage and synovial fluid, subchondral bone, and muscle were measured for all flip angles. The region of interest (ROI) used for each signal and noise measurement was placed at identical locations on normal-appearing articular cartilage, synovial fluid, subchondral bone, muscle, and background of the water IDEAL-GRASS images. Each ROI contained ≈50 pixels for signal measurements of articular cartilage, subchondral bone, and muscle and ≈20 pixels for signal measurements for synovial fluid. Each ROI contained ≈50 pixels for noise measurements. The standard deviation of the background ROI was used as an estimate of image noise. SNR values were calculated using the following equation:
CNR values were calculated using the following equation:
The factor 0.655 in Eqs. [1] and [2] accounts for the fact that the SNR and CNR measurements were obtained using magnitude images (41).
Comparison of IDEAL-GRASS Sequence With IDEAL-SPGR Sequence
In order to provide a preliminary comparison of the IDEAL-GRASS and IDEAL-SPGR sequences for evaluating articular cartilage, the two sequences were performed on a single knee of seven asymptomatic volunteers (six males and one female; age range, 27–33 years, average age, 29 years) and on the symptomatic knee of three volunteers with osteoarthritis (two males and one female; age range, 47–62 years, average age, 56 years). All subjects underwent an MRI examination of the knee on the same General Electric 3.0T scanner (HDx, GE Healthcare) using an 8-channel phased array extremity coil (Invivo, Orlando, FL). All MRI examinations consisted of an IDEAL-GRASS sequence and an IDEALSPGR sequence. Both sequences had an acquisition time of 5 minutes and were performed with TR = 10 msec, TE = 4.4/5.4/6.1 msec, 1.0 mm slice thickness, 384 × 224 matrix, 15 cm field of view, ±41.47 kHz bandwidth, and 1 signal average. The IDEAL-GRASS and IDEAL-SPGR images were acquired with flip angles of 50° and 14°, respectively, in order to maximize contrast between articular cartilage and synovial fluid. Theoretical calculations using SPGR signal equations have shown that maximum contrast between articular cartilage and synovial fluid is achieved when a flip angle of 14° is used for IDEAL-SPGR imaging, which agrees with the results of a small unpublished pilot study performed at our institution. A SENSE-based (42) parallel acceleration method (ASSET, GE Healthcare) with an acceleration factor of 2.2 was used for both IDEAL-GRASS and IDEAL-SPGR imaging.
For each MRI examination the SNR of articular cartilage, synovial fluid, and subchondral bone and the CNR between articular cartilage and synovial fluid and subchondral bone were calculated for the IDEAL-GRASS and IDEAL-SPGR sequences. SNR and CNR measurements were obtained from the IDEAL-GRASS and IDEAL-SPGR water images in the same manner as described previously. Student t-tests were used to compare SNR and CNR measurements for the IDEAL-GRASS and IDEAL-SPGR sequences. Differences in SNR and CNR measurements were considered statistically significant at P < 0.05.
IDEAL-GRASS Sequence for Routine Cartilage Imaging
The IDEAL-GRASS sequence was performed on 30 consecutive patients (19 males and 11 females; age range, 18–61 years, average age, 41 years) with knee pain as part of the routine knee MRI examination at our institution. All patients underwent a routine MRI examination of their symptomatic knee on the same General Electric 3T scanner (HDx, GE Healthcare) using an 8-channel phased array extremity coil (Invivo). The MRI examination consisted of an axial frequency selective fat-suppressed T2-weighted FSE sequence (TR/TE = 2200/80 msec), a coronal T1-weighted FSE sequence (TR/TE = 1000/20 msec), a coronal frequency selective fat-suppressed intermediate-weighted FSE sequence (TR/TE = 2000/30 msec), a sagittal intermediate-weighted FSE sequence (TR/TE = 2000/20 msec), a sagittal frequency selective fat-suppressed T2-weighted FSE sequence (TR/TE = 5000/80 msec), and a sagittal IDEAL-GRASS sequence. The imaging parameters for the IDEAL-GRASS sequence were identical to those used for the previously described comparison study between the IDEAL-GRASS and IDEAL-SPGR sequences.
All MRI examinations were reviewed by a fellowship-trained musculoskeletal radiologist with 9 years of clinical experience. The radiologist subjectively assessed the ability of the IDEAL-GRASS sequence to evaluate the articular cartilage of the knee joint. The radiologist then used the IDEAL-GRASS sequence and the remaining sequences in the routine MRI protocol independently and at separate sittings to identify articular cartilage lesions within the knee joint. In order to prevent recall bias the two independent cartilage assessments were performed at least 4 months apart. The radiologist then used the IDEAL-GRASS sequence and the remaining sequences in the routine MRI protocol together to evaluate the articular cartilage of the knee joint. During the third review of the MRI examinations the radiologist determined whether the cartilage lesions were better visualized on the IDEAL-GRASS sequence or on the remaining sequences in the MRI protocol.
RESULTS
Optimization of IDEAL-GRASS Sequence
According to Bloch equation simulations the signal of articular cartilage was highest at a flip angle of ≈10° and the signal of synovial fluid was highest at a flip angle of ≈40° (Fig. 1). The contrast between articular cartilage and synovial fluid was highest at a flip angle of ≈50° (Fig. 1).
Figure 1.
Signal of articular cartilage and synovial fluid and contrast between articular cartilage and synovial fluid for the IDEAL-GRASS sequence using various flip angles calculated from Bloch equation simulations. The maximum contrast between articular cartilage and synovial fluid occurs at a flip angle of 50°.
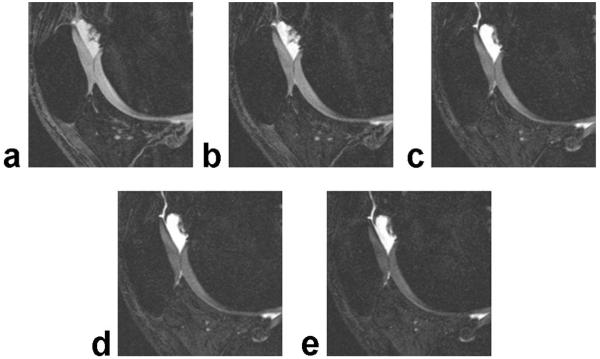
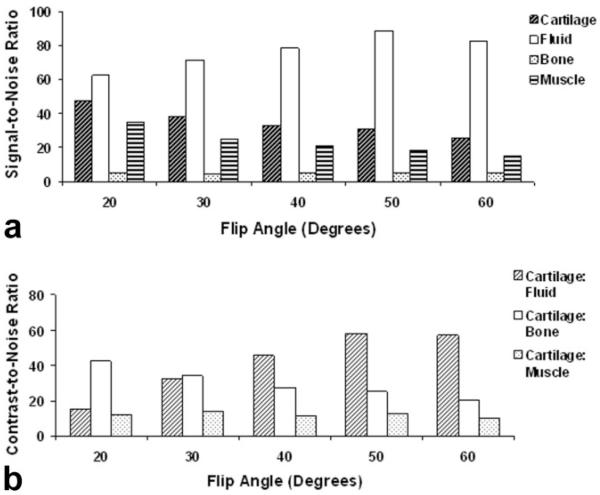
Figure 2 shows IDEAL-GRASS water images of the patellofemoral compartment of the knee joint in an asymptomatic volunteer obtained using various flip angles. According to the clinical pilot study the SNR of articular cartilage was highest at a flip angle of 20° and the SNR of synovial fluid was highest at a flip angle of 50° (Fig. 3a). The CNR between articular cartilage and synovial fluid was highest at a flip angle of 50° (Fig. 3b).
Figure 2.
Sagittal IDEAL-GRASS water images of the patellofemoral compartment of the knee joint in an asymptomatic volunteer obtained using a 20° (a), 30° (b), 40° (c), 50° (d), and 60° (e) flip angle.
Figure 3.
a: Signal-to-noise ratio of articular cartilage, synovial fluid, subchondral bone, and muscle for the IDEAL-GRASS sequence using various flip angles according to the clinical pilot study. b: Contrast-to-noise ratio between articular cartilage and synovial fluid, subchondral bone, and muscle for the IDEAL-GRASS sequence using various flip angles according to the clinical pilot study. The maximum contrast between articular cartilage and synovial fluid occurs at a flip angle of 50°.
Comparison of IDEAL-GRASS Sequence With IDEAL-SPGR Sequence
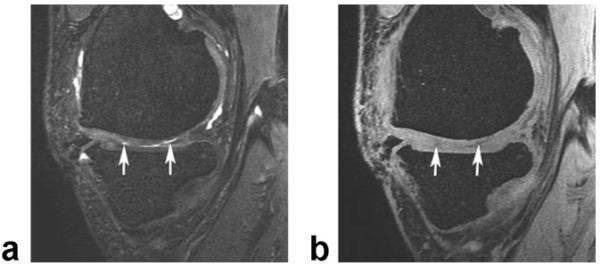
Figure 4 compares the appearance of cartilage lesions on bright fluid IDEAL-GRASS and dark fluid IDEALSPGR images in a symptomatic volunteer with osteoarthritis of the knee joint.
Figure 4.
Sagittal IDEAL-GRASS water image (a) and IDEAL-SPGR water image (b) of the knee in a 47-year-old volunteer with osteoarthritis show partial-thickness cartilage defects (arrows) within the medial femoral condyle.
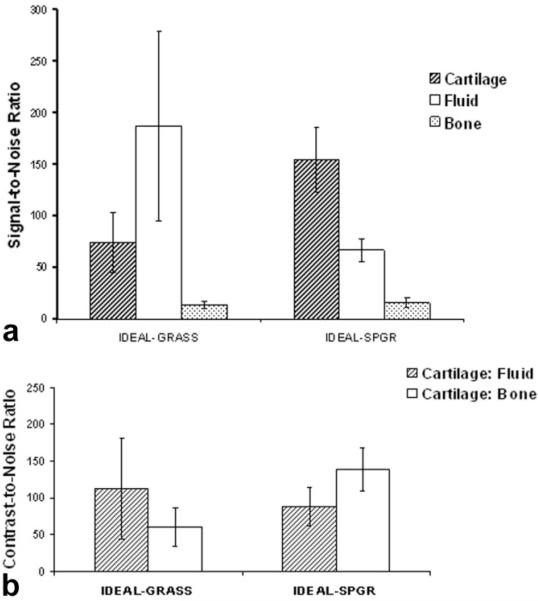
The IDEAL-GRASS sequence had significantly lower (P < 0.001) cartilage SNR and significantly higher (P < 0.001) synovial fluid SNR when compared to the IDEALSPGR sequence (Fig. 5a). The IDEAL-GRASS sequence had, on average, 14% lower subchondral bone SNR when compared to the IDEAL-SPGR sequence (Fig. 5a). However, this difference was not statistically significant (P = 0.243).
Figure 5.
a: Signal-to-noise ratio of articular cartilage, synovial fluid, and subchondral bone for the IDEAL-GRASS and IDEAL-SPGR sequences. b: Contrast-to-noise ratio between articular cartilage and synovial fluid and subchondral bone for the IDEAL-GRASS and IDEAL-SPGR sequences.
The IDEAL-GRASS sequence had, on average, 28% higher contrast between articular cartilage and synovial fluid when compared to the IDEAL-SPGR sequence (Fig. 5b). However, this difference was not statistically significant (P = 0.298). The IDEAL-GRASS sequence had significantly lower (P < 0.001) CNR between articular cartilage and subchondral bone when compared to the IDEAL-SPGR sequence (Fig. 5b).
IDEAL-GRASS Sequence for Clinical Cartilage Imaging
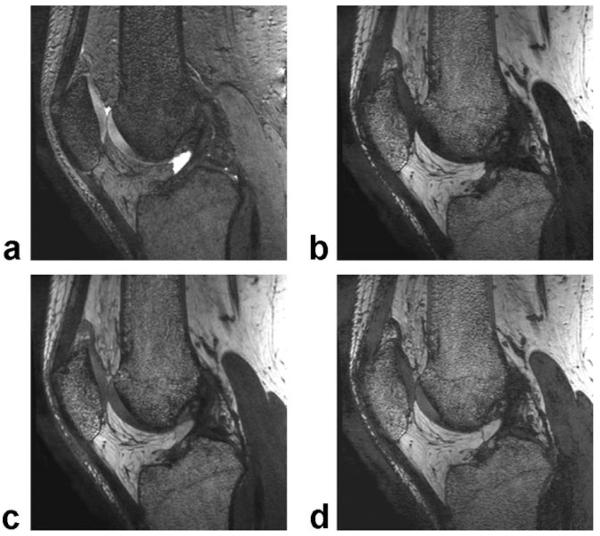
The IDEAL-GRASS sequence produced high-quality 3D water, fat, combined in-phase (water+fat), and combined out-of-phase (water-fat) images of the knee with 0.39 mm × 0.67 mm × 1.0 mm spatial resolution in a single 5-minute acquisition (Fig. 6). On subjective analysis the IDEAL-GRASS sequence provided excellent visualization of the articular cartilage of the knee joint. On IDEAL-GRASS water images the intermediate signal intensity cartilage was well distinguished from the adjacent high signal intensity synovial fluid and low signal intensity subchondral bone.
Figure 6.
Sagittal IDEAL-GRASS water image (a), fat image (b), combined in-phase (water+fat) image (c), and combined out-of-phase (water−fat) image (d) of the knee in a 28-year-old asymptomatic volunteer. The combined in-phase and out-of-phase IDEAL-GRASS images are corrected for chemical shift artifact.
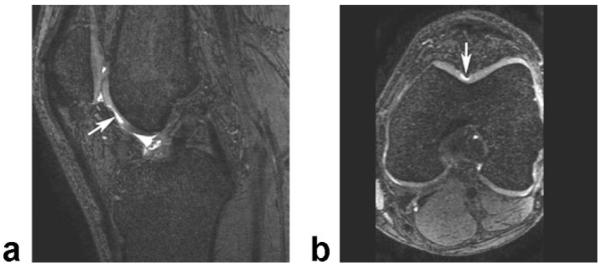
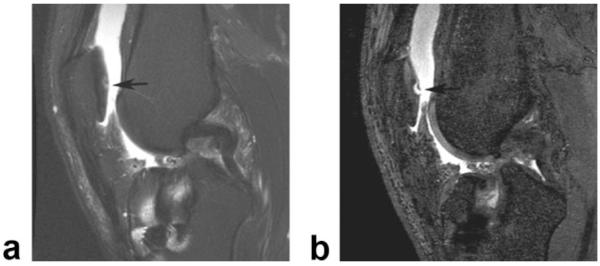
The IDEAL-GRASS sequence allowed excellent visualization of cartilage lesions within the knee joint. Forty-four cartilage lesions were identified in 17 patients on the routine knee MRI examination. All 44 cartilage lesions were well visualized on IDEAL-GRASS images. High-quality axial and coronal IDEAL-GRASS reformat images allowed cartilage lesions to be evaluated in multiple planes (Fig. 7). In a side-by-side comparison of the IDEAL-GRASS sequence and the remaining sequences in the routine knee MRI examination, the IDEAL-GRASS sequence provided better characterization of four of the 44 cartilage lesions (Figs. 8, 9).
Figure 7.
Sagittal IDEAL-GRASS water image (a) and axial IDEAL-GRASS water reformat image (b) of the knee in a 42-year-old symptomatic patient show a deep partial-thickness cartilage defect (arrows) in the femoral trochlea.
Figure 8.
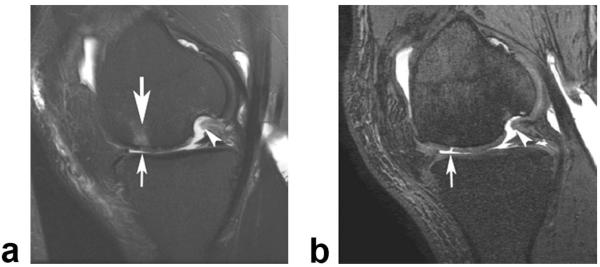
a: Sagittal frequency selective fat-suppressed T2-weighted FSE image (0.36 × 0.63 × 3.0 mm resolution) of the knee in a 38-year-old symptomatic patient shows linear intermediate signal intensity (arrow) within the articular cartilage of the patella which was thought to represent a small cartilage fissure. b: Corresponding sagittal IDEAL-GRASS water image (0.39 × 0.67 × 1.0 mm resolution) better characterizes the cartilage lesion and shows a superficial partial-thickness flap tear (arrow) of the articular cartilage of the patella.
Figure 9.
a: Sagittal frequency selective fat-suppressed T2-weighted FSE image (0.36 × 0.63 × 3.0 mm resolution) of the knee in a 44-year-old symptomatic patient shows subtle increased signal intensity (small arrow) within the articular cartilage of the medial femoral condyle which was thought to represent early cartilage degeneration. Also note the adjacent subchondral bone marrow edema (large arrow). b: Corresponding sagittal IDEAL-GRASS image (0.39 × 0.67 × 1.0 mm resolution) better characterizes the cartilage lesion and shows a full-thickness flap tear (arrow) of the articular cartilage of the medial femoral condyle. Note that the subchondral bone marrow edema is not visualized on the IDEAL-GRASS image. Of incidental note in both images is an osteochondral defect (arrowheads) within the more posterior portion of the medial femoral condyle.
DISCUSSION
This study has documented the feasibility of combining IDEAL fat-water separation with a GRASS sequence to produce high-quality 3D images of the knee with bright synovial fluid at 3.0T. According to both Bloch equation simulations and a clinical pilot study, 50° is the optimal flip angle for IDEAL-GRASS cartilage imaging. This flip angle provides the greatest contrast between articular cartilage and synovial fluid while maintaining high cartilage SNR and adequate contrast between articular cartilage, subchondral bone, and muscle.
The optimized IDEAL-GRASS sequence produces high-quality 3D fat- and water-separated images of the knee that are well suited for evaluating cartilage morphology. IDEAL-GRASS water images have high cartilage SNR and high contrast between articular cartilage and adjacent joint structures. The intermediate signal intensity articular cartilage is well distinguished from the adjacent high signal intensity synovial fluid and low signal intensity subchondral bone. The bright synovial fluid creates an arthrogram-like effect which may increase the conspicuity of superficial cartilage lesions. The high contrast between articular cartilage and subchondral bone is important for delineating the cartilage–bone interface when performing cartilage volume measurements and allows accurate assessment of the exact depth of focal cartilage lesions.
The optimized IDEAL-GRASS sequence produces images with 0.39 mm × 0.67 mm in-plane spatial resolution and 1.0 mm slice thickness in 5 minutes. The high in-plane spatial resolution is beneficial for identifying early cartilage degeneration and superficial posttraumatic cartilage defects. The thin slice thickness decreases partial volume averaging and allows for the production of high-quality multiplanar reformat images. The 5-minute acquisition time of the IDEAL-GRASS sequence is sufficiently short to limit patient motion artifact and to allow the specialized cartilage imaging sequence to be incorporated into routine knee MRI protocols.
A unique advantage of the optimized IDEAL-GRASS sequence is that the fat- and water-separated images can be used to generate various recombined images with no increase in acquisition time. The combined in-phase (water+fat) IDEAL-GRASS images, in which the intermediate signal intensity of articular cartilage is well distinguished from the adjacent high signal intensity synovial fluid and subchondral bone, may be especially useful for cartilage imaging. The in-phase images have contrast similar to intermediate-weighted FSE imaging without fat-saturation, which is a popular technique for evaluating articular cartilage (20). However, unlike intermediate-weighted FSE images, IDEAL-GRASS in-phase images are corrected for chemical shift artifact, which is especially important when evaluating articular cartilage at 3.0T.
IDEAL fat-water separation has been previously combined with an SPGR sequence to evaluate articular cartilage. IDEAL-SPGR images of the knee have significantly higher cartilage SNR and higher contrast between articular cartilage and synovial fluid when compared to frequency selective fat-suppressed SPGR images (38). However, the main disadvantage of using the IDEAL-SPGR sequence for clinical cartilage imaging is the low signal intensity of synovial fluid on SPGR images, which may decrease the conspicuity of superficial cartilage lesions (16,17).
Our study has shown no statistically significant difference in contrast between articular cartilage and synovial fluid for the IDEAL-GRASS and IDEAL-SPGR sequences. However, the CNR measurements in our study were calculated using cartilage SNR measurements obtained in areas of normal-appearing and pre-sumably healthy cartilage. Mosher and Pruett (17) postulated that superficial degeneration shortens the T2 relaxation time of articular cartilage. For dark fluid sequences such as IDEAL-SPGR, the T2 shortening of degenerative cartilage has no effect on its signal intensity and contrast relative to synovial fluid. However, for bright fluid sequences such as IDEAL-GRASS, the effect of T2 shortening is to decrease the signal intensity of degenerative cartilage and thus increase its contrast relative to synovial fluid, which may result in greater conspicuity of superficial cartilage lesions.
There is ongoing debate over the superiority of dark fluid versus bright fluid sequences for clinical cartilage imaging. Future clinical trials with surgical correlation are needed to compare the ability of these sequences for detecting early cartilage degeneration and superficial posttraumatic cartilage defects. With IDEAL fat-water separation the choice between using a bright fluid GRASS sequence or a dark fluid SPGR sequence allows great flexibility depending on specific applications or personal preferences.
IDEAL fat-water separation has been previously combined with an SSFP sequence to evaluate the articular cartilage of the knee joint. IDEAL-SSFP images of the knee have significantly higher cartilage SNR and higher contrast between articular cartilage and synovial fluid when compared to frequency selective fat-suppressed SPGR and SSFP images (24). On IDEAL-SSFP images the bright synovial fluid creates an arthrogram-like effect that may increase the conspicuity of superficial cartilage lesions. However, the main disadvantage of IDEAL-SSFP imaging is banding artifacts in areas of magnetic field inhomogeneity. To minimize banding artifacts the TR of the IDEAL-SSFP sequence must kept short, which ultimately limits spatial resolution. The 0.67 × 0.67 × 1.5 mm voxel size of IDEAL-SSFP images described in previous studies (24) is 2.5 times larger than the 0.39 × 0.67 × 1.0 mm voxel size of IDEAL-GRASS images obtained in our study.
The major limitations of our study are the small number of patients with cartilage lesions imaged with the IDEAL-GRASS sequence and the lack of surgical correlation. To truly determine the ability of the IDEAL-GRASS sequence to evaluate the articular cartilage of the knee joint, large clinical studies with arthroscopic correlation are needed. However, this preliminary study was performed to merely implement and optimize the IDEAL-GRASS sequence for use as an alternative MRI sequence with bright synovial fluid for evaluating cartilage morphology. A second limitation of our study is that the IDEAL-GRASS sequence was not directly compared to other recently developed SNR efficient, 3D cartilage imaging sequences (21,24-28). Future studies are needed to directly compare the imaging characteristics of these newly developed sequences and to compare their accuracy for detecting cartilage lesions and for performing cartilage volume measurements.
In conclusion, this study has shown that the IDEAL-GRASS sequence consistently produces high-quality 3D fat- and water-separated images of the knee with bright synovial fluid and 0.39 × 0.67 × 1.0 mm spatial resolution in 5 minutes. IDEAL-GRASS images have high cartilage SNR and high contrast between cartilage and adjacent joint structures. The IDEAL-GRASS sequence has a sufficiently short acquisition time to be incorporated into routine knee MRI protocols and can produce high-quality multiplanar reformat images for evaluating articular cartilage. For these reasons the IDEAL-GRASS sequence shows great promise for use as a morphologic cartilage imaging sequence at 3.0T.
REFERENCES
- 1.Peterfy C, Woodworth T, Altman R. Introduction: workshop for consensus on Osteoarthritis imaging: MRI of the knee. Osteoarthritis Cartilage. 2006;14:A44–A45. [Google Scholar]
- 2.Brief AA, Maurer SG, Di Cesare PE. Use of glucosamine and chondroitin sulfate in the management of osteoarthritis. J Am Acad Orthop Surg. 2001;9:71–78. doi: 10.5435/00124635-200103000-00001. [DOI] [PubMed] [Google Scholar]
- 3.Brittberg M, Lindahl A, Nilsson A, Ohlsson C, Isaksson O, Peterson L. Treatment of deep cartilage defects in the knee with autologous chondrocyte transplantation. N Engl J Med. 1994;331:889–895. doi: 10.1056/NEJM199410063311401. [DOI] [PubMed] [Google Scholar]
- 4.Hangody L, Fules P. Autologous osteochondral mosaicplasty for the treatment of full-thickness defects of weight-bearing joints: ten years of experimental and clinical experience. J Bone Joint Surg Am. 2003;85-A(Suppl 2):25–32. doi: 10.2106/00004623-200300002-00004. [DOI] [PubMed] [Google Scholar]
- 5.Jakob RP, Franz T, Gautier E, Mainil-Varlet P. Autologous osteochondral grafting in the knee: indication, results, and reflections. Clin Orthop Relat Res. 2002:170–184. doi: 10.1097/00003086-200208000-00020. [DOI] [PubMed] [Google Scholar]
- 6.Towheed TE. Published meta-analyses of pharmacological therapies for osteoarthritis. Osteoarthritis Cartilage. 2002;10:836–837. doi: 10.1053/joca.2002.0841. [DOI] [PubMed] [Google Scholar]
- 7.Abadie E, Ethgen D, Avouac B, et al. Recommendations for the use of new methods to assess the efficacy of disease-modifying drugs in the treatment of osteoarthritis. Osteoarthritis Cartilage. 2004;12:263–268. doi: 10.1016/j.joca.2004.01.006. [DOI] [PubMed] [Google Scholar]
- 8.Eckstein F, Cicuttini F, Raynauld JP, Waterton JC, Peterfy C. Magnetic resonance imaging (MRI) of articular cartilage in knee osteoarthritis (OA): morphological assessment. Osteoarthritis Cartilage. 2006;14(Suppl A):A46–75. doi: 10.1016/j.joca.2006.02.026. [DOI] [PubMed] [Google Scholar]
- 9.Gold GE, Burstein D, Dardzinski B, Lang P, Boada F, Mosher T. MRI of articular cartilage in OA: novel pulse sequences and compositional/functional markers. Osteoarthritis Cartilage. 2006;14(Suppl A):A76–86. doi: 10.1016/j.joca.2006.03.010. [DOI] [PubMed] [Google Scholar]
- 10.Disler DG, McCauley TR, Wirth CR, Fuchs MD. Detection of knee hyaline cartilage defects using fat-suppressed three-dimensional spoiled gradient-echo MR imaging: comparison with standard MR imaging and correlation with arthroscopy. AJR Am J Roentgenol. 1995;165:377–382. doi: 10.2214/ajr.165.2.7618561. [DOI] [PubMed] [Google Scholar]
- 11.Recht MP, Piraino DW, Paletta GA, Schils JP, Belhobek GH. Accuracy of fat-suppressed three-dimensional spoiled gradient-echo FLASH MR imaging in the detection of patellofemoral articular cartilage abnormalities. Radiology. 1996;198:209–212. doi: 10.1148/radiology.198.1.8539380. [DOI] [PubMed] [Google Scholar]
- 12.Kshirsagar AA, Watson PJ, Tyler JA, Hall LD. Measurement of localized cartilage volume and thickness of human knee joints by computer analysis of three-dimensional magnetic resonance images. Invest Radiol. 1998;33:289–299. doi: 10.1097/00004424-199805000-00006. [DOI] [PubMed] [Google Scholar]
- 13.Marshall KW, Mikulis DJ, Guthrie BM. Quantitation of articular cartilage using magnetic resonance imaging and three-dimensional reconstruction. J Orthop Res. 1995;13:814–823. doi: 10.1002/jor.1100130603. [DOI] [PubMed] [Google Scholar]
- 14.Peterfy CG, van Dijke CF, Janzen DL, et al. Quantification of articular cartilage in the knee with pulsed saturation transfer subtraction and fat-suppressed MR imaging: optimization and validation. Radiology. 1994;192:485–491. doi: 10.1148/radiology.192.2.8029420. [DOI] [PubMed] [Google Scholar]
- 15.Stammberger T, Eckstein F, Englmeier KH, Reiser M. Determination of 3D cartilage thickness data from MR imaging: computational method and reproducibility in the living. Magn Reson Med. 1999;41:529–536. doi: 10.1002/(sici)1522-2594(199903)41:3<529::aid-mrm15>3.0.co;2-z. [DOI] [PubMed] [Google Scholar]
- 16.Mohr A. The value of water-excitation 3D FLASH and fat-saturated PDw TSE MR imaging for detecting and grading articular cartilage lesions of the knee. Skeletal Radiol. 2003;32:396–402. doi: 10.1007/s00256-003-0635-z. [DOI] [PubMed] [Google Scholar]
- 17.Mosher TJ, Pruett SW. Magnetic resonance imaging of superficial cartilage lesions: role of contrast in lesion detection. J Magn Reson Imaging. 1999;10:178–182. doi: 10.1002/(sici)1522-2586(199908)10:2<178::aid-jmri11>3.0.co;2-w. [DOI] [PubMed] [Google Scholar]
- 18.Bredella MA, Tirman PF, Peterfy CG, et al. Accuracy of T2-weighted fast spin-echo MR imaging with fat saturation in detecting cartilage defects in the knee: comparison with arthroscopy in 130 patients. AJR Am J Roentgenol. 1999;172:1073–1080. doi: 10.2214/ajr.172.4.10587150. [DOI] [PubMed] [Google Scholar]
- 19.Rose PM, Demlow TA, Szumowski J, Quinn SF. Chondromalacia patellae: fat-suppressed MR imaging. Radiology. 1994;193:437–440. doi: 10.1148/radiology.193.2.7972759. [DOI] [PubMed] [Google Scholar]
- 20.Sonin AH, Pensy RA, Mulligan ME, Hatem S. Grading articular cartilage of the knee using fast spin-echo proton density-weighted MR imaging without fat suppression. AJR Am J Roentgenol. 2002;179:1159–1166. doi: 10.2214/ajr.179.5.1791159. [DOI] [PubMed] [Google Scholar]
- 21.Gold GE, Fuller SE, Hargreaves BA, Stevens KJ, Beaulieu CF. Driven equilibrium magnetic resonance imaging of articular cartilage: initial clinical experience. J Magn Reson Imaging. 2005;21:476–481. doi: 10.1002/jmri.20276. [DOI] [PubMed] [Google Scholar]
- 22.Hardy PA, Recht MP, Piraino D, Thomasson D. Optimization of a dual echo in the steady state (DESS) free-precession sequence for imaging cartilage. J Magn Reson Imaging. 1996;6:329–335. doi: 10.1002/jmri.1880060212. [DOI] [PubMed] [Google Scholar]
- 23.Murphy BJ. Evaluation of grades 3 and 4 chondromalacia of the knee using T2*-weighted 3D gradient-echo articular cartilage imaging. Skeletal Radiol. 2001;30:305–311. doi: 10.1007/s002560100330. [DOI] [PubMed] [Google Scholar]
- 24.Gold GE, Hargreaves BA, Vasanawala SS, et al. Articular cartilage of the knee: evaluation with fluctuating equilibrium MR imaging— initial experience in healthy volunteers. Radiology. 2006;238:712–718. doi: 10.1148/radiol.2381042183. [DOI] [PubMed] [Google Scholar]
- 25.Gold GE, Reeder SB, Yu H, et al. Articular cartilage of the knee: rapid three-dimensional MR imaging at 3.0 T with IDEAL balanced steady-state free precession—initial experience. Radiology. 2006;240:546–551. doi: 10.1148/radiol.2402050288. [DOI] [PubMed] [Google Scholar]
- 26.Kornaat PR, Doornbos J, van der Molen AJ, et al. Magnetic resonance imaging of knee cartilage using a water selective balanced steady-state free precession sequence. J Magn Reson Imaging. 2004;20:850–856. doi: 10.1002/jmri.20194. [DOI] [PubMed] [Google Scholar]
- 27.Vasanawala SS, Pauly JM, Nishimura DG. Linear combination steady-state free precession MRI. Magn Reson Med. 2000;43:82–90. doi: 10.1002/(sici)1522-2594(200001)43:1<82::aid-mrm10>3.0.co;2-9. [DOI] [PubMed] [Google Scholar]
- 28.Vasanawala SS, Hargreaves BA, Pauly JM, Nishimura DG, Beaulieu CF, Gold GE. Rapid musculoskeletal MRI with phase-sensitive steady-state free precession: comparison with routine knee MRI. AJR Am J Roentgenol. 2005;184:1450–1455. doi: 10.2214/ajr.184.5.01841450. [DOI] [PubMed] [Google Scholar]
- 29.Heron CW, Calvert PT. Three-dimensional gradient-echo MR imaging of the knee: comparison with arthroscopy in 100 patients. Radiology. 1992;183:839–844. doi: 10.1148/radiology.183.3.1584944. [DOI] [PubMed] [Google Scholar]
- 30.Spritzer CE, Vogler JB, Martinez S, et al. MR imaging of the knee: preliminary results with a 3DFT GRASS pulse sequence. AJR Am J Roentgenol. 1988;150:597–603. doi: 10.2214/ajr.150.3.597. [DOI] [PubMed] [Google Scholar]
- 31.Tyrrell RL, Gluckert K, Pathria M, Modic MT. Fast three-dimensional MR imaging of the knee: comparison with arthroscopy. Radiology. 1988;166:865–872. doi: 10.1148/radiology.166.3.3340786. [DOI] [PubMed] [Google Scholar]
- 32.Gold GE, McCauley TR, Gray ML, Disler DG. What’s new in cartilage? Radiographics. 2003;23:1227–1242. doi: 10.1148/rg.235035113. [DOI] [PubMed] [Google Scholar]
- 33.Pineda AR, Reeder SB, Wen Z, Pelc NJ. Cramer-Rao bounds for three-point decomposition of water and fat. Magn Reson Med. 2005;54:625–635. doi: 10.1002/mrm.20623. [DOI] [PubMed] [Google Scholar]
- 34.Reeder SB, Pineda AR, Wen Z, et al. Iterative decomposition of water and fat with echo asymmetry and least-squares estimation (IDEAL): application with fast spin-echo imaging. Magn Reson Med. 2005;54:636–644. doi: 10.1002/mrm.20624. [DOI] [PubMed] [Google Scholar]
- 35.Reeder SB, McKenzie CA, Pineda AR, et al. Water-fat separation with IDEAL gradient-echo imaging. J Magn Reson Imaging. 2007;25:644–652. doi: 10.1002/jmri.20831. [DOI] [PubMed] [Google Scholar]
- 36.An L, Xiang QS. Chemical shift imaging with spectrum modeling. Magn Reson Med. 2001;46:126–130. doi: 10.1002/mrm.1167. [DOI] [PubMed] [Google Scholar]
- 37.Reeder SB, Wen Z, Yu H, et al. Multicoil Dixon chemical species separation with an iterative least-squares estimation method. Magn Reson Med. 2004;51:35–45. doi: 10.1002/mrm.10675. [DOI] [PubMed] [Google Scholar]
- 38.Siepmann DB, McGovern JM, Gold GE, Brittain JH, Reeder SB. High resolution 3D cartilage imaging of the knee at 3T in five minutes using IDEAL-SPGR and parallel imaging; Proc 14th Annual Meeting ISMR; Seattle. 2006; Abstract 1251. [Google Scholar]
- 39.Tkach JA, Haacke EM. A comparison of fast spin echo and gradient field echo sequences. Magn Reson Imaging. 1988;6:373–389. doi: 10.1016/0730-725x(88)90474-2. [DOI] [PubMed] [Google Scholar]
- 40.Gold GE, Suh B, Sawyer-Glover A, Beaulieu C. Musculoskeletal MRI at 3.0 T: initial clinical experience. AJR Am J Roentgenol. 2004;183:1479–1486. doi: 10.2214/ajr.183.5.1831479. [DOI] [PubMed] [Google Scholar]
- 41.Henkelman RM. Measurement of signal intensities in the presence of noise in MR images. Med Phys. 1985;12:232–233. doi: 10.1118/1.595711. [DOI] [PubMed] [Google Scholar]
- 42.Pruessmann KP, Weiger M, Scheidegger MB, Boesiger P. SENSE: sensitivity encoding for fast MRI. Magn Reson Med. 1999;42:952–962. [PubMed] [Google Scholar]


