Abstract
B cells encounter antigen over a wide affinity range, from KA=105 M−1 to KA=1010 M−1. The strength of B cell antigen receptor (BCR) signaling in response to antigen increases with affinity, a process known as “affinity discrimination”. In this work, we use a computational simulation of B cell surface dynamics and membrane-proximal signaling to show that affinity discrimination can arise from the formation of BCR oligomers. It is known that BCRs form oligomers upon encountering antigen, and that the size and rate of formation of these oligomers both increase with affinity. In our simulation, we have introduced a requirement that only BCR-antigen complexes that are part of an oligomer can engage cytoplasmic signaling molecules such as Src-family kinases. Our simulation shows that as affinity increases, BCR signaling activity increases in addition to the number of collected antigen. Our results are also consistent with the existence of an experimentally-observed threshold affinity of activation at KA=105–106 M−1 (no signaling activity below this affinity value) and affinity discrimination ceiling of KA=1010 M−1 (no affinity discrimination above this affinity value). Comparison with experiments shows that the time scale of BCR oligomer formation predicted by our model (less than 10 s) is well within the time scale of experimentally observed association of BCR with Src-family kinases (10–20 s).
Keywords: B cell receptor, antigen, Lyn, Syk, lymphocyte, signaling, computational model, Monte Carlo
INTRODUCTION
B cells, the cells responsible for antibody production, are activated by recognizing antigen (Ag) through the B cell antigen receptor (BCR) located on their surface. The strength of BCR signaling in response to stimulation by antigen is known to increase monotonically with antigen affinity, a phenomenon known as “affinity discrimination” [1–9]. B cell affinity discrimination is critical to the process of affinity maturation that results in the production of high affinity antibodies [9], and is thus important in applications such as vaccine design [9]. The precise mechanisms by which B cell receptors sense antigen affinity are still not fully known [10]. While the first studies of B cell affinity discrimination focused on multivalent antigen encountered in soluble form, recent research shows that antigens presented on the surface of antigen presenting cells (APCs), typically dendritic cells or macrophages, are potent stimulators of B cells [4,10–21].
Further studies have shown that during the initial stages of contact between B cells and APCs, micro-clusters of 10–100 BCR-antigen complexes form on protrusions of the B cell surface [8,9,13,22,23]. These micro-clusters are signaling-active [8,9,13,22,23], as they trigger affinity-dependent spreading of the B cell surface over the antigen presenting cell surface, increasing the cell-cell contact area [8]. This spreading response leads to the formation of micro-clusters at the leading edges [8,22], culminating in the formation of the immunological synapse [7,8,10,12]. It has also been shown that early signaling events (~100 seconds) such as Ca2+ flux, as well as antigen accumulation in the immunological synapse, all increase with antigen affinity [8,9]. Thus, affinity discrimination has been observed at the earliest stages of contact between B cell receptors and antigen [8,9].
However, little is known about how B cells discriminate between membrane antigens of varying affinity at the level of BCR-antigen micro-clusters. In previous work, we showed that kinetic proofreading [24,25] was needed to generate the affinity discrimination pattern observed in B cell affinity discrimination experiments [26]. Kinetic proofreading was simulated in an ad hoc manner, by introducing a threshold time for which antigen had to stay bound to a BCR before that BCR could engage cytoplasmic signaling molecules. The kinetic proofreading requirement, in the form of the threshold time, needed to be long enough to predominate over the competing effect of reduced serial engagement with increasing affinity, which was detrimental to affinity discrimination. In the absence of a kinetic proofreading requirement, our previous modeling studies demonstrated that the strength of B cell signaling actually decreased as affinity increased, which is the opposite of B cell affinity discrimination. However, the physical mechanism that could give rise to kinetic proofreading still needs to be explored in terms of molecular level interactions.
It is known that BCRs form oligomers in the presence of antigen [9,27], leading to the formation of the larger BCR-antigen microclusters reported in the literature. However, the molecular mechanism of BCR oligomer formation is not known. While cross-linking by soluble multivalent antigens has traditionally been used to explain BCR oligomer formation, such a mechanism cannot account for the formation of BCR oligomers in the presence of monovalent, membrane-bound antigen [7–9,22,28,29]. According to the “conformation-induced oligomerization model” of Pierce and colleagues, the force exerted by membrane-bound antigen binding to BCR within the restricted 2-D geometry of a cell-cell interaction opens up the Cμ4 domain at the base of the BCR ectodomain into a conformation that is conducive to oligomer formation [27–29]. When a BCR with an “open” Cμ4 domain encounters another BCR with its Cμ4 domain also “open”, the two may form a dimer [27–29].
Here, we explored whether Pierce’s conformation-induced model of oligomer formation can account for B cell affinity discrimination. We removed the threshold time requirement [26], and instead introduced a requirement that only BCRs that have bound antigen can form oligomers, and only BCRs that are part of an oligomer can engage cytoplasmic signaling molecules. Such a requirement favors high affinity BCR-antigen complexes, since as affinity increases, the antigen off-rate generally decreases. Higher affinity BCR-antigen pairs thus have a longer lifetime, which increases the odds of their encountering another BCR-antigen complex and forming an oligomer; the stability of formed oligomers is also enhanced with increasing affinity. Since only BCRs in oligomers can engage signaling molecules, there should be more signaling activity as affinity increases. Hence oligomer formation emerges as a kinetic proofreading mechanism that enables B cells to discriminate between antigens of different affinities.
METHOD
Our method is a three-dimensional, agent-based Monte Carlo simulation of BCR-antigen binding at the surface and membrane-proximal BCR signaling in the cytoplasm. The current method is based on our previous work [26,30]. We modeled the B-cell signaling pathway as far downstream as the Src family kinase Syk. The molecular species included in our model are BCR (and its Ig-α and Ig-β signaling subunits), antigen (Ag), and the kinases Lyn and Syk. Individual molecules are explicitly simulated as discrete agents reacting with each other and diffusing within their respective domains according to probabilistic parameters that can be mapped to kinetic rate constants.
Setup
Because we are interested in the early stages of antigen recognition, we model a single protrusion of a B cell surface, its cytoplasmic interior, and its vertical projection onto a planar bilayer containing antigen. The bilayer and B cell protrusion tip are modeled as lattices of 150×150 nodes, while the interior of the B cell protrusion is modeled to a depth of 40 nodes. We only allow one molecule per node, thus we set the spacing between nodes to 10 nm, roughly the exclusion radius of a membrane protein molecule. The domain size thus corresponds to a physical area of 1.5 μm × 1.5 μm × 0.4 μm. BCR is located on the B cell protrusion surface, antigen on the bilayer surface, Lyn is anchored below the B cell protrusion surface, and Syk is distributed in the B cell protrusion’s cytoplasm. At the start of a simulation run, all of these species are uniformly distributed at random over their respective domains. At each time step, individual molecules in the population are randomly sampled to undergo either diffusion or reaction, determined by means of an unbiased coin toss.
Reaction
Antigen, Lyn and Syk are monovalent, while BCR molecules possess four binding sites: Two extracellular Fab domains for antigen binding, and one Ig-α and one Ig-β cytoplasmic domain, both of which serve as binding sites for Lyn and Syk. If an antigen molecule is selected for reaction, the lattice node on the B cell surface directly opposite the antigen’s location is checked for a Fab domain. If that is the case, a BCR-Ag complex may form with probability pon(BA). If the target BCR molecule happens to also have an antigen bound on the other Fab domain, a BCR-Ag2 complex will form. If a BCR molecule is selected to undergo reaction, an unbiased coin toss is performed to chose between the extracellular or cytoplasmic domains, and an additional unbiased coin toss is performed to chose one of the Fab domains (left or right), or either the Ig-α or Ig-β domain, depending on the result of the preceding coin toss. If a free Fab domain is selected, the node on the bilayer surface directly opposite is checked for antigen, which may bind with probability pon(BA). If the selected Fab domain already has an antigen bound to it, the BCR-Ag bond may dissociate with probability poff(BA).
If a BCR-Ag or BCR-Ag2 complex is next to another BCR-Ag or BCR-Ag2 complex, they may form a dimer with probability pon(olig). This can happen either via reaction (a BCR binding an antigen right next to a BCR-Ag or BCR-Ag2 complex), or diffusion (a BCR-Ag or BCR-Ag2 complex moving next to another BCR-Ag or BCR-Ag2 complex). Another BCR-Ag or BCR-Ag2 complex may subsequently form or diffuse next to the dimer, and join the dimer with probability pon(olig), forming a trimer. The theoretical upper bound on the size of an oligomer is only limited by the number of BCR and antigen molecules in the simulation, whichever is smaller. All BCRs within an oligomer lose the ability to diffuse, however they gain the ability to bind Lyn on their Ig-α or Ig-β domains. Lyn may bind with probability pon(Lyn), either via sampling of the Ig-α or Ig-β domains for reaction, or sampling of a Lyn molecule for reaction (similar to antigen binding on the Fab domains). Upon binding, Lyn may phosphorylate the Ig-α or Ig-β domain it is bound to with probability pphos(Lyn). A bound Lyn may dissociate with probability poff(Lyn) if the Ig-α or Ig-β domain to which it is bound is sampled. Before the dissociation trial with probability poff(Lyn) is carried out, a phosphorylation trial with probability pphos(Lyn) is performed.
If a BCR that is part of an oligomer loses all of its bound antigens through dissociation, it ceases being part of the oligomer, regaining its ability to diffuse but losing the ability to bind Lyn. Depending on whether its neighboring BCR/Ag or BCR/Ag2 complexes neighbor other BCR/Ag or BCR/Ag2 complexes, they may also revert to the un-oligomerized state. For example, if one of the BCRs in a dimer is no longer bound to antigen, the other BCR formerly in the dimer also regains the ability to diffuse and loses the ability to bind Lyn. Similarly, if the BCR in the middle of a trimer is no longer bound to antigen, all three BCRs revert to the un-oligomerized state. However, if the BCR at the edge of a trimer is no longer bound to antigen, the other two BCRs remain in a dimer configuration.
Syk may bind to Ig-α or Ig-β domains that have been phosphorylated by Lyn (BCRs with at least one Ig-α or Ig-β domain phosphorylated by Lyn are designated pBCR), initially with probability pon(Syk)low. Upon binding, Syk may phosphorylate the Ig-α or Ig-β domain it is bound to with probability pphos(Syk)low. If the phosphorylation trial by Syk is successful, the pBCR molecule with at least one Ig-α or Ig-β domain phosphorylated by Syk is designated as a ppBCR molecule. Also, if the phosphorylation trial is successful, the Syk molecule may itself become phosphorylated (phosphorylated Syk molecules are designated pSyk), either by a Lyn molecule or another pSyk molecule located on a neighboring node, with probability psyk(phos). If the phosphorylation trial of Ig-α or Ig-β by Syk is unsuccessful, and the pBCR molecule does not transition to the ppBCR state, the Syk molecule also remains in the inactive state (designated iSyk) and will not become phosphorylated by a Lyn or pSyk (at the start of the simulation, all Syk molecules are in the iSyk state). A phosphorylation trial of Ig-α or Ig-β by Syk occurs every time the Ig-α or Ig-β to which the Syk is attached is sampled for dissociation.
The dissociation kinetics of Syk attached to an Ig-α or Ig-β domain depend on the phosphorylation status of the Syk and the Ig-α or Ig-β domain it is bound to. If the phosphorylation trial Ig-α or Ig-β by Syk was unsuccessful, and the Syk molecule remains in the iSyk stage and BCR molecule in the pBCR stage, the Syk molecule may dissociate with probability poff(Syk)high. If the phosphorylation trial is successful, the Syk molecule will dissociate with probability poff(Syk)high from the ppBCR if the Syk molecule is successfully phosphorylated by a nearby Lyn or pSyk (becoming a pSyk molecule in the process). However, if the phosphorylation trial Ig-α or Ig-β by Syk was successful but the Syk molecule is not phosphorylated by a nearby Lyn or pSyk molecule, the probability of the iSyk molecule dissociating is governed by poff(Syk)low, and it remains in the iSyk state.
Later in the simulation it is possible for an iSyk molecule to encounter a ppBCR that has reached that state from previous interactions. In that case, it may bind to the Ig-α or Ig-β domains with probability pon(Syk)high. The dissociation kinetics in such an instance are as described above: If the Syk molecule is phosphorylated by a nearby Lyn or pSyk, the attached Syk molecule transitions to the pSyk state and the probability used in subsequent dissociation trials is poff(Syk)high. However if the Syk molecules is not phosphorylated, it remains in the iSyk state and the probability used in subsequent dissociation trials is poff(Syk)low.
A pSyk molecule encountering a pBCR or ppBCR may bind the Ig-α or Ig-β domains with probability pon(Syk)low and dissociate with probability poff(Syk)high. In the case of a pSyk molecule binding to a pBCR molecule, the probability of the pBCR becoming phosphorylated by the pSyk molecule and transitioning to the ppBCR state is governed by pphos(Syk)high. Lastly, a pSyk molecule that is diffusing in the cytoplasm may also phosphorylate an iSyk molecule it encounters with probability pphos(SykSyk). The kinetic rules for Syk are summarized in Table 1. These simulation rules for Syk are significantly more complex than those used in our previous work, and are based on a survey of the literature on the subject [31–34].
Table 1.
Kinetic rules for Syk used in our simulation.
| pBCR | ppBCR | |
|---|---|---|
| iSyk | Binds with pon(Syk)low Phosphorylates Ig-α/β with pphos(Syk)low Unbinds with poff(Syk)high |
Binds with pon(Syk)high Unbinds with poff(Syk)low |
| pSyk | Binds with pon(Syk)low Phosphorylates Ig-α/β with pphos(Syk)high Unbinds with poff(Syk)high |
Binds with pon(Syk)high Unbinds with poff(Syk)high |
Diffusion
If a molecule has been selected to undergo diffusion, a random number trial with probability pdiff(i) is used to determine whether the diffusion move will occur. The diffusion probability pdiff is directly analogous to the diffusion coefficient D. The probability of diffusion of free molecules is denoted by pdiff(F), and that of BCR-antigen complexes and BCR signalosomes by pdiff(C). If the trial with probability pdiff(i) is successful, a neighboring node is selected at random (4 possibilities for BCR, antigen, and Lyn, 6 possibilities for Syk) and the target node is checked for occupancy. The move will occur only if the target node is vacant, as no two molecules are allowed to occupy the same node. BCR molecules, BCR-antigen complexes, and BCR signalosomes are generally assumed to be much larger than antigen, Lyn and Syk molecules and occupy several nodes; thus in these instances there will be several target nodes that need to be vacant for the move to occur. BCR-antigen complexes and BCR signalosomes are generally assumed to diffuse slower than free molecules [22], hence pdiff(C) is an order of magnitude lower than pdiff(F). Since free molecules are the fastest diffusing species, we set pdiff(F)=1, and pdiff(C)=0.1.
Sampling and time step size
In our algorithm, the entire molecular population is randomly sampled M times at every time step for diffusion or reaction. Whether it is diffusion or reaction that occurs is determined by means of an unbiased coin toss. The number of random samplings M is set equal to the total number of molecules (free plus bound) present in the system at the beginning of each time step, and the simulation is run for a number of time steps T.
A distinguishing feature of our method is a mapping between the probabilistic parameters of the Monte Carlo simulation and their physical counterparts. We do this by setting pdiff of the fastest diffusing species, in this case free molecules (pdiff(F)), equal to 1 and matching that quantity to the species’ measured diffusion coefficient D. The diffusion coefficient of free molecules on a cell membrane has been experimentally measured to be of the order of 0.1 μm2/s [35]. In one time step, a molecule with pdiff=1 will on average (since each molecule is on average sampled once per time step) have covered a distance of one nodal spacing, or 10 nm, giving a mean square displacement <r2> of 10−4 μm2. Using <r2>=Dt, this results in a time step size of 10−3 seconds. Once the time step size is known, it is possible to map pon, poff, and their ratio PA to their respective physical counterparts, kon, koff, and KA. A detailed description of the mapping process can be found in our previous work [26]. Such a mapping makes it possible to compare our model’s results to those of physical experiments to within an order of magnitude, without a priori setting of the simulation timescale.
Model parameters
The parameters used in our model are listed in Table 2. Parameter values used in our simulations are given on the left side of Table 2. Their physical equivalent is listed on the right side of Table 2. Where possible, the value of the physical quantity is taken from the literature, and mapped back into a value that can be used in our simulation. This is the case for BCR-antigen kinetic parameters (PA(BA), pon(BA), poff(BA)), the number of BCR and antigen molecules (B0, A0), and the diffusion probability of free molecules (pdiff(F)). We vary BCR-antigen affinity by orders of magnitude across the physiological range for B cells (KA=105–1010 M−1). BCR-antigen affinity is initially varied, as in many B cell activation experiments [7,8], by keeping kon constant and varying koff. For example, in Carrasco et al. [7], affinity for the HEL series of antigen is varied by varying koff across five orders of magnitude, while kon is fixed at 2*106 M−1s−1 [7,8]. This latter value maps to a probability pon(BA) of 0.1 according to our mapping scheme, while the reported koff values ranging from 101 to 10−4 s−1 map to poff(BA) values of 10−2–10−7 for a time step size of 10−3 s. In the Supporting Information, we show the effect of varying kon. Variation in kon (and/or koff) commonly occurs when higher affinity BCRs are generated through somatic hypermutation during the affinity maturation process [36]. The literature value of 105 receptors/cell [37] maps to 400 molecules for the 1.5 μm × 1.5 μm surface domain used in our simulations, while the antigen concentration of 10–100 molecules/μm2 used in experiments [7] maps to 20–200 antigens. In the results shown here we used 200 antigen molecules, and results with 20 and 2000 antigen molecules are included in the Supporting Information.
Table 2.
Parameters of our model, and their physical equivalents.
| Simulation parameter | Value | Physical equivalent | Value |
|---|---|---|---|
| PA(BA) | 101–106 ‡ | KA BCR-antigen | 105–1010 M−1 [7,8] |
| pon(BA) | 0.1‡ | kon BCR-antigen | 106 M−1s−1 [7,8] |
| poff(BA) | 10−2–10−7 ‡ | koff BCR-antigen | 101–10−4 s−1 [7,8] |
| B0 | 400 molecules | BCR molecules/cell | ~105 [37] |
| A0 | 200 molecules ‡ | Antigen conc. | 100 molec./μm2 [7] |
| L0 | 100 molecules †‡ | Lyn molecules/cell | 2×10⁴ |
| S0 | 400 molecules †‡ | Syk molecules/cell | 4×10⁵ |
| pdiff(F) | 1 | Dfree molecules | 0.1 μm2/s [35] |
| pdiff(C) | 0.1 | Dcomplexes | ~0.01 μm2/s [22] |
| pon(olig) | 0.1‡ | kon(BCR-BCR) | 100 molec−1s−1 |
| PA(Lyn) | 102 †‡ | KA Ig-α/β-Lyn | 106 M−1 |
| pon(Lyn) | 1.0 †‡ | kon Ig-α/β-Lyn | ~107 M−1 s−1 |
| poff(Lyn) | 0.01 †‡ | koff Ig-α/β-Lyn | ~10 s−1 |
| pon(Syk)high | 1.0 †‡ | kon Ig-α/β-Syk | ~107 M−1 s−1 |
| pon(Syk)low | 0.1 †‡ | kon Ig-α/β-Syk | ~106 M−1 s−1 |
| poff(Syk)high | 1.0 †‡ | koff Ig-α/β-Syk | ~1000 s−1 |
| poff(Syk)low | 0.001 †‡ | koff Ig-α/β-Syk | ~1 s−1 |
| pphos(Lyn) | 0.1 †‡ | kphos(Lyn) | ~100 s−1 |
| pphos(Syk)high | 1.0 †‡ | kphos(Syk)high | ~1000 s−1 |
| pphos(Syk)low | 0.5 †‡ | kphos(Syk)low | ~500 s−1 |
| pSyk(phos) | 1.0 †‡ | kSyk(phos) | ~1000 s−1 |
| pphos(SykSyk) | 0.01†‡ | kphos(SykSyk) | ~10 s−1 |
We also vary the values of parameters for which we were not able to find measured values in the literature, such as the number of Lyn and Syk molecules (L0, S0), the probability of oligomer formation, pon(olig), the on and off-probabilities of cytoplasmic reactions such as pon(Lyn), poff(Lyn), pon(Syk)low, pon(Syk)high, poff(Syk)low, poff(Syk)high, and the phosphorylation reaction probabilities pphos(Lyn), pphos(Syk)low, pphos(Syk)high, pSyk(phos), and pphos(SykSyk). For the purposes of obtaining ballpark values for these parameters, we have adapted the values used in modeling studies of FcεRI-mediated signaling, which bears many similarities to BCR-mediated signaling [38,39]. Starting from the ballpark values, we performed parametric studies to gauge the effect of these parameters on affinity discrimination. These parametric studies are included as Supporting Information. Here, we show the results obtained for those parameter values that resulted in the best affinity discrimination, while still being physically reasonable. These are the values shown on the left of Table 1, with their mapped physical values shown on the right (though these are not literature values).
RESULTS
Histogram plots show affinity discrimination (from bound antigen to phosphorylated Syk)
We investigate affinity discrimination by tabulating the quantity of several relevant molecular species at the end of a simulation run of 100 physical seconds (i.e. 105 Monte Carlo simulation time steps). The quantities of interest are 1) the number antigen bound to BCR (bdAg), 2) the number of BCRs that are part of an oligomer (dBCR), 3) the number of BCRs with at least one ITAM singly phosphorylated by Lyn (pBCR), 4) the number of BCRs with at least one ITAM doubly phosphorylated by Syk (ppBCR), and 5) the number of phosphorylated Syk (pSyk). Because our simulation is stochastic in nature, these quantities vary from one run to the next. We therefore perform one thousand independent trials (single cell computer experiments) for each affinity value and plot the results in histograms. BCR-antigen affinity is varied by orders of magnitude across the physiological range, from KA=105 M−1 to KA=1010 M−1, as is done in some B cell affinity discrimination experiments [7,8].
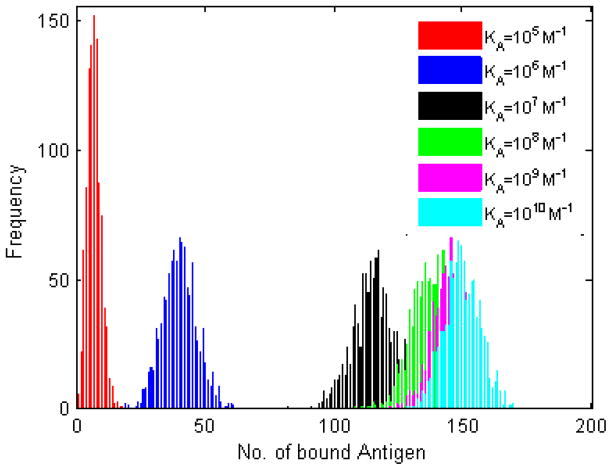
Histogram plots of the number of bound antigen molecules are shown in Figure 1. In line with experimental results [8], the number of bound antigen molecules increases with BCR-antigen affinity. The histogram plots for the four lowest affinity values (KA=105 M−1 to KA=108 M−1) are well separated, and it also is possible to distinguish between KA=108 M−1 and KA=109 M−1. The histograms for KA=109 M−1 and KA=1010 M−1 almost completely overlap, indicative of the ceiling in affinity discrimination around KA=1010 M−1 reported in the experimental literature [2,8].
Figure 1. Histogram plots of the number of bound antigen molecules.
BCR-antigen affinity is varied by orders of magnitude across the physiological range in B cells, KA=105 M−1 to KA=1010 M−1. Because of the probabilistic nature of our simulation, one thousand trials were performed for each affinity value. The parameter values used are those listed in the left column of Table 2, simulation time is 105 time steps (corresponding to T=100 physical seconds). The number of bound antigen generally increases with affinity, as expected.
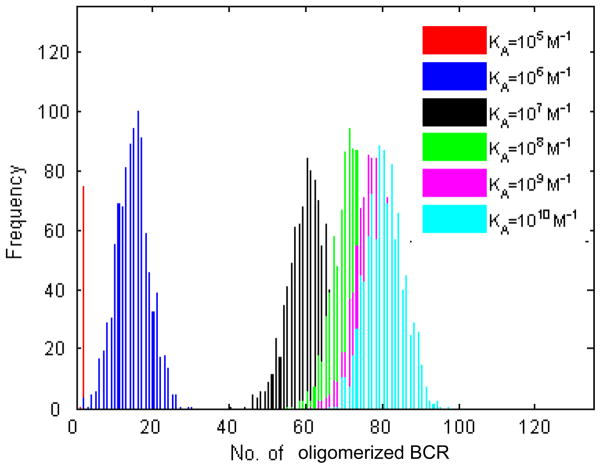
Histogram plots of the number of dBCR are shown in Figure 2. As with bound antigen, the four lowest affinity values are clearly separated, it is possible to distinguish between KA=108 M−1 and KA=109 M−1, while the histograms for KA=109 M−1 and KA=1010 M−1 almost completely overlap. Importantly, the number of dBCR is close to zero for all trials at the lowest affinity value, KA=105 M−1. This is in agreement with the existence of a threshold affinity for B cell activation, such as KA=106 M−1 observed in some B cell activation experiments [2,7,8], below which no B cell activation is observed. Since our simulations show that there is a nonzero number of bound antigen at KA=105 M−1 (Fig. 1), this result suggests that lack of dimer formation below affinity KA=106 M−1 could be one reason for the absence of B cell activation below this affinity value.
Figure 2. Histogram plots of the number of BCRs that are part of an oligomer.
All BCRs in the simulation are checked whether they are part of an oligomer, and if they are, they are included in the tally. One thousand trials, 105 time steps, with the parameters listed in the left of Table 2. As with the number of bound antigen, the number of oligomerized BCR increases with affinity.
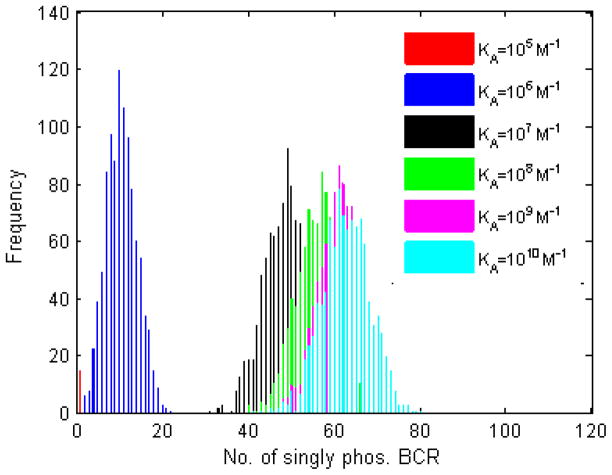
The number of singly phosphorylated BCR, pBCR, is shown in Figure 3. The histograms are less clearly separated than in Figures 1 and 2, though it is still possible to distinguish between KA=107 M−1 and KA=108 M−1, and to a lesser extent between KA=108 M−1 and KA=109 M−1. Nevertheless, the results in Figure 3 closely resemble those of Figure 2. As in Figure 2, the number of pBCR for KA=105 M−1 is usually zero (only for a relatively few trials is this number nonzero).
Figure 3. Histogram plots of the number of BCR molecules with at least one ITAM phosphorylated by Lyn.
Included in the histograms is any BCR with at least one ITAM phosphorylated by Lyn. One thousand trials, 105 time steps, with the parameters listed in the left of Table 2. As with upstream quantities (bound antigen, oligomerized BCR), the number of Lyn-phosphorylated BCRs increases with affinity.
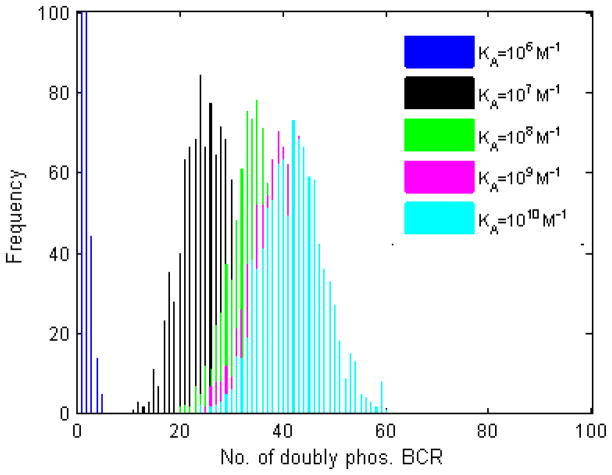
The number of doubly phosphorylated BCR, ppBCR is shown in Figure 4. The pattern resembles that of Figure 3, the main difference being that the number of ppBCR for KA=106 M−1 is much smaller, and for KA=105 M−1 is zero for all trials. Thus, affinity discrimination seen in Figures 1 and 2 is maintained at the level of pBCR and ppBCR, albeit with some loss.
Figure 4. Histogram plots of the number of BCR molecules with at least one ITAM phosphorylated by Syk.
Included in the histograms is any BCR with at least one ITAM phosphorylated by Syk. One thousand trials, 105 time steps, with the parameters listed in the left of Table 2. As with upstream quantities, the number of Syk-phosphorylated BCR increases with affinity.
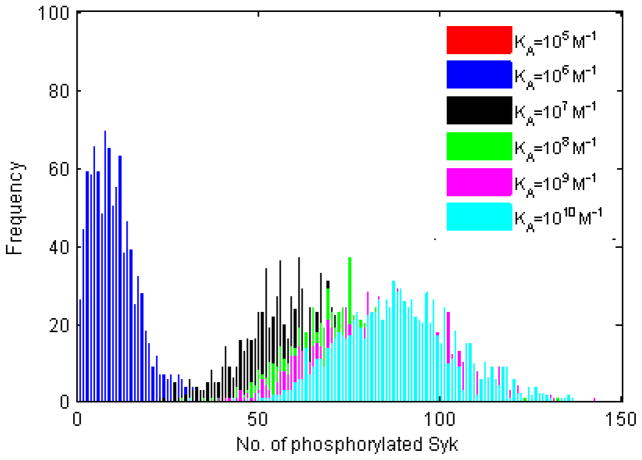
The number of phosphorylated Syk is shown in Figure 5. It is still possible to distinguish between KA=107 M−1, KA=108 M−1, and KA=109 M−1, thus affinity discrimination is still evident at the level of pSyk. The histograms in Figure 5 have noticeably higher standard deviations than those of Figs 1–4. Of note is that our results reproduce the threshold affinity of activation at KA=106 M−1 and affinity discrimination ceiling at KA=1010 M−1 all the way down to the level of pSyk.
Figure 5. Histogram plots of the number of phosphorylated Syk molecules.
Includes any Syk molecule that is in the phosphorylated state, whether attached to an Ig-α/β or freely diffusing in the cytoplasm. One thousand trials, 105 time steps, with the parameters listed in the left of Table 2. As with upstream quantities, the number of twice-phosphorylated Syk increases with affinity.
Analysis of histogram overlaps: quantitative metric for affinity discrimination
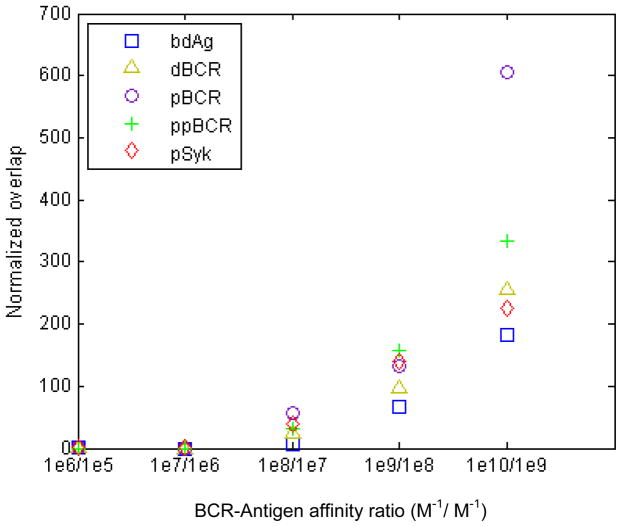
We quantify affinity discrimination in the histograms of Figure 1–5 using the metric Δ=(overlap area)/(m1−m2), where the area of overlap between the histograms for two adjacent affinity values is divided by m1 and m2, the histograms’ mean values for those two affinities. Lower Δ values correspond to better affinity discrimination, with the best discrimination occurring at Δ=0 (no overlap between histograms). When Δ=0, it is necessary to compare the mean values of the histograms (Figure 7). In Figure 6, we show Δ for the quantities in Figures 1–5. For 106 M−1/105 M−1 and 107 M−1/106 M−1 there is full separation, with increases in Δ thereafter. Bound antigen has the lowest Δ, indicating a loss in affinity discrimination downstream, although this loss is proportionately small for 108 M−1/107 M−1 and to a lesser extent for 109 M−1/108 M−1. For 1010 M−1/109 M−1, we note that the histograms in Figures 1–5 almost completely overlap, while in Figure 6 the value of Δ is 200 or greater. We thus take Δ=200 or greater to indicate absence of affinity discrimination.
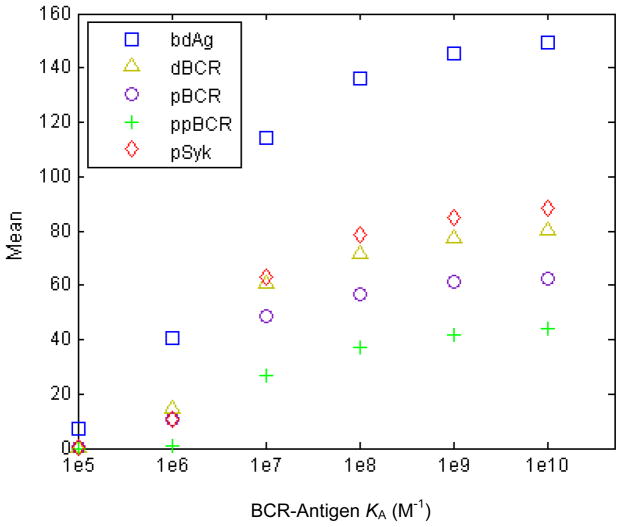
Figure 7. Plots of the mean values of the histogram plots in Figs. 1–5.
All five quantities plotted in the histograms of Figs. 1–5 show a monotonic, sigmoid increase with affinity.
Figure 6. Quantitative comparison of affinity discrimination between adjacent affinity values.
Plots of the quantity Δ=(overlap area)/(m1 − m2), where Δ, the area of overlap between the histograms for two adjacent affinity values (e.g. KA=107 M−1 and KA=108 M−1) is divided by m1 and m2, the histograms’ mean values. A lower value of Δ corresponds to better affinity discrimination, while for the case of Δ=0 one needs to compare the difference between mean values (Fig. 7). Affinity discrimination decreases with affinity, and also downstream of BCR-antigen binding.
Mean value plots show a sigmoid affinity discrimination profile with increasing affinity
In Figure 7, we plot the trial-averaged (mean) values of the quantities represented in the histograms of Figures 1–5. Trial-averaged quantities are important as they can be thought of as analogous to the signaling response integrated from multiple protrusions on a single cell. All five quantities plotted show a monotonic, sigmoid increase with affinity, starting with a small increase from KA=105 M−1 to KA=106 M−1, a steeper increases between KA=106 M−1 and KA=107 M−1, leveling off as the ceiling of KA=1010 M−1 is approached. The strength of BCR signaling is known from experiments to increase monotonically with affinity, and our simulation results reproduce this. As shown in the Supporting Information, the affinity discrimination pattern, activation threshold and affinity discrimination ceiling in our above results are generally robust with regards to variations in individual parameter values.
Average time of initial oligomer formation shows a non-linear decrease with increasing affinity
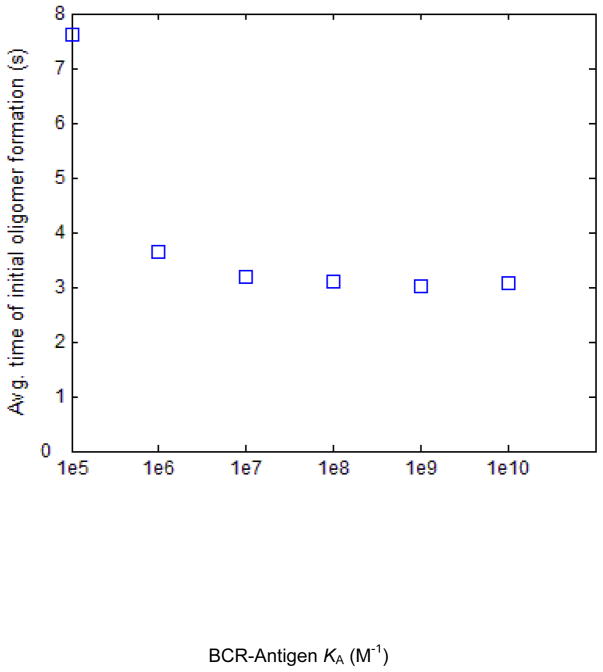
In Figure 8, we show the trial-averaged time of formation of the first oligomer (almost always a dimer). In every simulation trial, the time at which the first oligomer forms is recorded, and the results for each affinity value are averaged over 1000 trials and plotted in Figure 8. The average time of initial oligomer formation decreases by about half from KA=105 M−1 to KA=106 M−1, with smaller decreases as affinity increases thereafter. The relatively high time of initial oligomer formation for KA=105 M−1 is due to the high value of koff at this affinity value, which results in a low rate of encounter between BCR/Ag complexes. The times shown in Figure 8 are well within the experimentally observed ~10 second timescale of BCR association with Lyn [22,23]. The standard deviation of the time of initial oligomer formation is roughly 6 s for KA=105 M−1, and roughly 2 s for all affinity values above that.
Figure 8. Plot of the trial-averaged time of initial dimer formation for each affinity value simulated.
For each trial, the time at which the first BCR-BCR dimer forms is recorded, and the average over one thousand trials is plotted here. This quantity decreases with affinity, and the average time of initial dimer formation for the lowest affinity value, KA=105 M−1 is about twice that of higher affinity values.
Time series plots for signaling activation
Plots of the trial-averaged number of bdAg, dBCR, pBCR, ppBCR, and aSyk as functions of time are shown in Figure 9. The number of bdAg, dBCR and pBCR approaches equilibrium after T=105 time steps, particularly for the lower affinity values, but the number of ppBCR and pSyk is still far from equilibrium. This is to be expected, as these quantities are further downstream in the signaling pathway. The plots in Figure 9 are also in agreement with the experimental finding of faster growth in signaling for higher affinity values [9]. For the lowest affinity value, KA=105 M−1, the number of dBCR, pBCR, ppBCR and pSyk is close to zero for all times. Affinity discrimination generally improves with time, as can be seen from the fact that the gap between the curves widens as time increases.
Figure 9. Plot of the mean values of the histograms in Figs. 1–5 as functions of time.
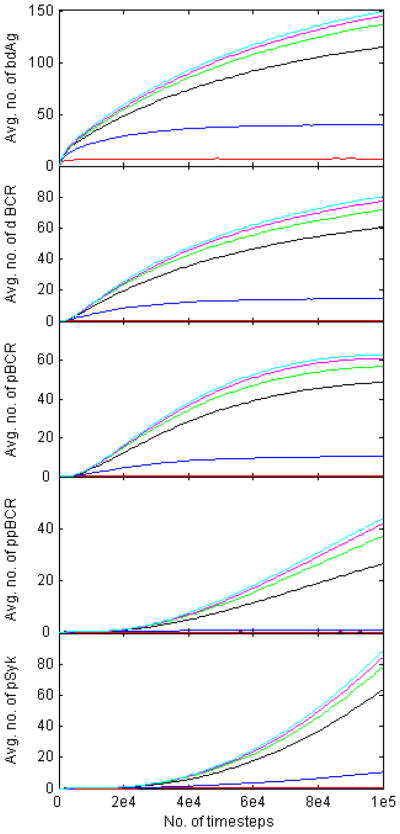
We record the mean value of the quantities plotted in Figs. 1–5 over 105 time steps, and plot the results in Fig. 9. All quantities increase monotonically with affinity, with the number of bound antigen, oligomerized BCR, and Lyn-phosphorylated BCR approaching equilibrium at T=105 time steps.
DISCUSSION
In this work, we show that the process of oligomer formation among BCRs can give rise to affinity discrimination as observed in B cell activation experiments. We have introduced simulation rules that BCRs that have bound antigen may form oligomers, and that only oligomerized BCRs can associate with Lyn and Syk. Our results clearly show that just as the number of antigens bound to BCR increases with affinity, so does the number of phosphorylated Syk molecules. Though there is some loss in definition downstream of BCR-antigen binding, the affinity discrimination pattern observed at the level of BCR-antigen complexes is observable at the level of phosphorylated Syk molecules.
While the loss in definition downstream of bound antigen (Fig. 6) may make it appear that oligomerization is detrimental to affinity discrimination, the oligomerization rule is in fact necessary for affinity discrimination. If the oligomerization rule is removed from the simulation, the number of phosphorylated BCR molecules decreases, and the number of phosphorylated Syk molecules remains constant with increasing affinity as seen in Fig. 3A in [26]. This is due to a loss in serial engagement as affinity increases [26]. In previous work, we showed that a form of kinetic proofreading was required to overcome the loss in serial engagement in order for affinity discrimination to be observed in simulations [26]. However, in that work kinetic proofreading was implemented in an ad hoc manner, via a threshold time for antigen to stay bound to BCR before the latter could associate with Lyn [26]. Here, we show that oligomer formation can act as a type of kinetic proofreading that counters the loss in serial engagement and results in increasing signaling activity with affinity. Because of their longer lifetime, high affinity BCR-antigen pairs are more likely to encounter one another and form an oligomer. This is reflected in our finding that the average time of dimer formation decreases with affinity. More oligomer formation directly leads to more phosphorylation of BCR ITAMs by Lyn, which in turn leads to more Syk activity. Thus, kinetic proofreading emerges naturally from our simulation. This type of oligomer formation-mediated mechanism of affinity discrimination would ensure that significant affinity discrimination is achieved even between closely related antibodies, such as those generated during the process of affinity maturation.
Our simulation results are also consistent with the existence of an experimentally observed threshold affinity of activation and affinity discrimination ceiling. Our simulations predict a B cell activation threshold at KA=106 M−1, as shown by the fact that the number of dBCR and other downstream quantities is zero below KA=106 M−1, even though the number of bound antigen at KA=105 M−1 is nonzero. This indicates that the threshold of B cell activation for downstream quantities is at least an order of magnitude higher than that for bound antigen. The precise value of the threshold affinity of activation and affinity discrimination ceiling may vary from one experimental setup to another (e.g. cell line, antigen family used, etc …), however the existence of the affinity threshold and affinity discrimination ceiling has been established experimentally. Similarly, in our simulation the precise value of the threshold and ceiling may vary depending on the parameter values used, however, the threshold and ceiling are always present, as shown in the Supporting Information. The B cell activation threshold could also be modulated by lipid-mediated interactions, such as those between BCRs and raft-forming sphingolipids, which could perturb the natural lipid environment of resting B cells. For example, the formation of BCR oligomers is difficult for BCRs with low kon, but lipid mediated mechanisms can lower the affinity threshold in such cases. A detailed model of BCR-lipid raft formation, which includes both BCR-BCR interactions (that can result in BCR oligomer formation) and BCR-lipid interactions, is currently under development.
Supplementary Material
Highlight.
We model B cell receptor affinity discrimination.
Affinity discrimination can arise from the formation of BCR oligomers.
Results consistent with affinity threshold of KA=105–106 and ceiling of KA=1010 M−1.
Footnotes
Publisher's Disclaimer: This is a PDF file of an unedited manuscript that has been accepted for publication. As a service to our customers we are providing this early version of the manuscript. The manuscript will undergo copyediting, typesetting, and review of the resulting proof before it is published in its final citable form. Please note that during the production process errors may be discovered which could affect the content, and all legal disclaimers that apply to the journal pertain.
References
- 1.Lanzavecchia A. Antigen-specific interaction between T and B cells. Nature. 1985;314:537–539. doi: 10.1038/314537a0. [DOI] [PubMed] [Google Scholar]
- 2.Batista FD, Neuberger M. Affinity dependence of the B-cell response to antigen: A threshold, a ceiling, and the importance of off-rate. Immunity. 1998;8:751–759. doi: 10.1016/s1074-7613(00)80580-4. [DOI] [PubMed] [Google Scholar]
- 3.Kouskoff V, Famiglietti S, Lacaud G, Lang P, Rider JE, et al. Antigens varying in affinity for the B cell receptor induce differential B lymphocyte responses. J Exp Med. 1998;188:1453–1464. doi: 10.1084/jem.188.8.1453. [DOI] [PMC free article] [PubMed] [Google Scholar]
- 4.Batista FD, Neuberger M. B cells extract and present immobilized antigen: Implications for affinity discrimination. EMBO J. 2000;19:513–520. doi: 10.1093/emboj/19.4.513. [DOI] [PMC free article] [PubMed] [Google Scholar]
- 5.Shih TA, Meffre E, Roederer M, Nussenzweig MC. Role of antigen receptor affinity in T cell-independent antibody responses in vivo. Nat Immunol. 2002a;3:399–406. doi: 10.1038/ni776. [DOI] [PubMed] [Google Scholar]
- 6.Shih TA, Meffre E, Roederer M, Nussenzweig MC. Role of antigen receptor affinity in T cell-independent antibody responses in vivo. Nat Immunol. 2002b;3:570–575. doi: 10.1038/ni776. [DOI] [PubMed] [Google Scholar]
- 7.Carrasco YR, Fleire SJ, Cameron T, Dustin ML, Batista FD. LFA-1/ICAM-1 interaction lowers the threshold of B cell activation by facilitating B cell adhesion and synapse formation. Immunity. 2004;20:589–599. doi: 10.1016/s1074-7613(04)00105-0. [DOI] [PubMed] [Google Scholar]
- 8.Fleire SJ, Goldman JP, Carrasco YR, Weber M, Bray D, et al. B cell ligand discrimination through a spreading and contracting response. Science. 2006;312:738–741. doi: 10.1126/science.1123940. [DOI] [PubMed] [Google Scholar]
- 9.Liu W, Meckel T, Tolar P, Sohn HW, Pierce SK. Antigen affinity discrimination is an intrinsic function of the B cell receptor. J Exp Med. 2010;207:1095–1111. doi: 10.1084/jem.20092123. [DOI] [PMC free article] [PubMed] [Google Scholar]
- 10.Carrasco YR, Batista FD. B cell recognition of membrane-bound antigen: An exquisite way of sensing ligands. Curr Op Immunol. 2006;18:286–291. doi: 10.1016/j.coi.2006.03.013. [DOI] [PubMed] [Google Scholar]
- 11.Batista FD, Iber D, Neuberger MS. B cells acquire antigen from target cells after synapse formation. Nature. 2001;411:489–494. doi: 10.1038/35078099. [DOI] [PubMed] [Google Scholar]
- 12.Carrasco YR, Batista FD. B cells acquire particulate antigen in a macrophage- rich area at the boundary between the follicle and the subcapsular sinus of the lymph node. Immunity. 2007;27:160–171. doi: 10.1016/j.immuni.2007.06.007. [DOI] [PubMed] [Google Scholar]
- 13.Depoil D, Fleire S, Treanor BL, Weber M, Harwood NE. CD19 is essential to B cell activation by promoting B cell receptor-antigen micro-cluster formation in response to membrane-bound ligand. Nat Immunol. 2008;9:63–72. doi: 10.1038/ni1547. [DOI] [PubMed] [Google Scholar]
- 14.Batista FD, Harwood NE. The who, how, and where of antigen presentation to B cells. Nat Rev Immunol. 2009;9:15–27. doi: 10.1038/nri2454. [DOI] [PubMed] [Google Scholar]
- 15.Carrasco YR, Batista FD. B-cell activation by membrane-bound antigens is facilitated by the interaction of VLA-4 with VCAM-1. EMBO J. 2006;25:889–899. doi: 10.1038/sj.emboj.7600944. [DOI] [PMC free article] [PubMed] [Google Scholar]
- 16.Bergtold A, Desai DD, Gavhane A, Clynes R. Cell surface recycling of internalized antigen permits dendritic cell priming of B cells. Immunity. 2005;23:503–514. doi: 10.1016/j.immuni.2005.09.013. [DOI] [PubMed] [Google Scholar]
- 17.Junt T, Moseman EA, Iannacone M, Massberg S, Lang PA, et al. Subcapsular sinus macrophages in lymph nodes clear lymph-borne viruses and present them to antiviral B cells. Nature. 2007;450:110–114. doi: 10.1038/nature06287. [DOI] [PubMed] [Google Scholar]
- 18.Phan TG, Grigorova I, Okada T, Cyster JG. Subcapsular encounter and complement-dependent transport of immune complexes by lymph node B cells. Nat Immunol. 2007;8:992–1000. doi: 10.1038/ni1494. [DOI] [PubMed] [Google Scholar]
- 19.Qi H, Egen JG, Huang AY, Germain RN. Extrafollicular activation of lymph node B cells by antigen-bearing dendritic cells. Science. 2006;312:1672–1676. doi: 10.1126/science.1125703. [DOI] [PubMed] [Google Scholar]
- 20.Schwickert TA, Lindquist RL, Shakhar G, Livshits G, Skokos D. In vivo imaging of germinal centers reveals a dynamic open structure. Nature. 2007;446:83–87. doi: 10.1038/nature05573. [DOI] [PubMed] [Google Scholar]
- 21.Balázs M, Martin F, Zhou T, Kearney J. Blood dendritic cells interact with Splenic marginal zone B cells to initiate T-independent immune responses. Immunity. 2002;17:341–352. doi: 10.1016/s1074-7613(02)00389-8. [DOI] [PubMed] [Google Scholar]
- 22.Tolar P, Sohn HW, Pierce SK. Viewing the antigen induced initiation of B cell activation in living cells. Immunol Rev. 2008;221:64–76. doi: 10.1111/j.1600-065X.2008.00583.x. [DOI] [PubMed] [Google Scholar]
- 23.Sohn HW, Tolar P, Pierce SK. Membrane heterogeneities in the formation of B cell receptor–Lyn kinase microclusters and the immune synapse. J Cell Bio. 2008;182:367–379. doi: 10.1083/jcb.200802007. [DOI] [PMC free article] [PubMed] [Google Scholar]
- 24.McKeithan TW. Kinetic proofreading in T-cell receptor signal-transduction. Proc Natl Acad Sci USA. 1995;92:5042–5046. doi: 10.1073/pnas.92.11.5042. [DOI] [PMC free article] [PubMed] [Google Scholar]
- 25.Goldstein B, Faeder JR, Hlavacek WS. Mathematical and computational models of immune-receptor signaling. Nat Rev Immunol. 2004;4:445–456. doi: 10.1038/nri1374. [DOI] [PubMed] [Google Scholar]
- 26.Tsourkas P, Liu W, Das SC, Pierce SK, Raychaudhuri S. Discrimination of membrane antigen affinity by B cells requires dominance of kinetic proofreading over serial engagement. Cell & Mol Immunol. 2012;9:62–74. doi: 10.1038/cmi.2011.29. [DOI] [PMC free article] [PubMed] [Google Scholar]
- 27.Tolar P, Hanna J, Krueger PD, Pierce SK. The constant region of the membrane immunoglobulin mediates B cell-receptor clustering and signaling in response to membrane antigens. Immunity. 2009;30:44–55. doi: 10.1016/j.immuni.2008.11.007. [DOI] [PMC free article] [PubMed] [Google Scholar]
- 28.Tolar P, Sohn HW, Liu W, Pierce SK. The molecular assembly and organization of signaling active B-cell receptor oligomers. Immunol, Rev. 2009;232:34–41. doi: 10.1111/j.1600-065X.2009.00833.x. [DOI] [PubMed] [Google Scholar]
- 29.Pierce SK, Liu W. The tipping points in the initiation of B cell signaling: How small changes make big differences. Nat Rev Immunol. 2010;10:767–778. doi: 10.1038/nri2853. [DOI] [PMC free article] [PubMed] [Google Scholar]
- 30.Tsourkas P, Baumgarth N, Simon SI, Raychaudhuri S. Mechanisms of B cell synapse formation predicted by Monte Carlo simulation. Biophys J. 2007;92:4196–4208. doi: 10.1529/biophysj.106.094995. [DOI] [PMC free article] [PubMed] [Google Scholar]
- 31.Reth M, Wienands J. Initiation and processing of signals from the B cell antigen receptor. Annu Rev Immunol. 1997;15:453–479. doi: 10.1146/annurev.immunol.15.1.453. [DOI] [PubMed] [Google Scholar]
- 32.Dal Porto JM, Gauld SB, Merrell KT, Mills D, Pugh-Bernard AE, Cambier J. B cell antigen receptor signaling 101. Mol Immunol. 2004;41:599–613. doi: 10.1016/j.molimm.2004.04.008. [DOI] [PubMed] [Google Scholar]
- 33.Kurosaki T, Hikida M. Tyrosine kinases and their substrates in B lymphocytes. Immunol Rev. 2009;228:132–148. doi: 10.1111/j.1600-065X.2008.00748.x. [DOI] [PubMed] [Google Scholar]
- 34.Geahlen RL. Syk and p’Tyrd: Signaling through the B cell antigen receptor. Biochim et Biophys Acta. 2009;1793:1115–1127. doi: 10.1016/j.bbamcr.2009.03.004. [DOI] [PMC free article] [PubMed] [Google Scholar]
- 35.Favier B, Burroughs NJ, Weddeburn L, Valitutti S. T cell antigen receptor dynamics on the surface of living cells. Int Immunol. 2001;13:1525–1532. doi: 10.1093/intimm/13.12.1525. [DOI] [PubMed] [Google Scholar]
- 36.Peled JU, Kuang FL, Iglesias-Ussel MD, Roa S, Kalis SL, Goodman MF, Scharff MD. The biochemistry of somatic hypermutation. Annu Rev Immunol. 2008;26:481–511. doi: 10.1146/annurev.immunol.26.021607.090236. [DOI] [PubMed] [Google Scholar]
- 37.Bell GI. Cell-cell adhesion in the immune system. Immunol Today. 1983;4:237–240. doi: 10.1016/0167-5699(83)90035-X. [DOI] [PubMed] [Google Scholar]
- 38.Wofsy C, Torigoe C, Kent UM, Metzger H, Goldstein B. Exploiting the difference between intrinsic and extrinsic kinases: implications for regulation of signaling by immunoreceptors. J Immunol. 1997;159:5984–5992. [PubMed] [Google Scholar]
- 39.Faeder JR, Hlavacek WS, Reischl I, Blinov ML, Metzger H, Redondo A, et al. Investigation of early events in FcεRI-mediated signaling using a detailed mathematical model. J Immunol. 2003;170:3769–3781. doi: 10.4049/jimmunol.170.7.3769. [DOI] [PubMed] [Google Scholar]
Associated Data
This section collects any data citations, data availability statements, or supplementary materials included in this article.


