

Abstract
Purpose
Health care providers need simple tools to identify patients at genetic risk of breast and ovarian cancers. Genetic risk prediction models such as BRCAPRO could fill this gap if incorporated into Electronic Medical Records or other Health Information Technology solutions. However, BRCAPRO requires potentially extensive information on the counselee and her family history. Thus, it may be useful to provide simplified version(s) of BRCAPRO for use in settings that do not require exhaustive genetic counseling.
Methods
We explore four simplified versions of BRCAPRO, each using less complete information than the original model. BRCAPROLYTE uses information on affected relatives only up to second degree. It is in clinical use but has not been evaluated. BRCAPROLYTE-Plus extends BRCAPROLYTE by imputing the ages of unaffected relatives. BRCAPROLYTE-Simple reduces the data collection burden associated with BRCAPROLYTE and BRCAPROLYTE-Plus by not collecting the family structure. BRCAPRO-1Degree only uses first-degree affected relatives. We use data on 2713 individuals from seven sites of the Cancer Genetics Network and MD Anderson Cancer Center to compare these simplified tools with the Family History Assessment Tool (FHAT) and BRCAPRO, with the latter serving as the benchmark.
Results
BRCAPROLYTE retains high discrimination, however, because it ignores information on unaffected relatives, it overestimates carrier probabilities. BRCAPROLYTE-Plus and BRCAPROLYTE-Simple provide better calibration than BRCAPROLYTE, so they have higher specificity for similar values of sensitivity. BRCAPROLYTE-Plus performs slightly better than BRCAPROLYTE-Simple. The Areas Under the ROC curve are 0.783 (BRCAPRO), 0.763 (BRCAPROLYTE), 0.772 (BRCAPROLYTE-Plus), 0.773 (BRCAPROLYTE-Simple), 0.728 (BRCAPRO-1Degree), and 0.745 (FHAT). The simpler versions, especially BRCAPROLYTE-Plus and BRCAPROLYTE-Simple, lead to only modest loss in overall discrimination compared to BRCAPRO in this dataset.
Conclusion
Simplified implementations of BRCAPRO can be used for genetic risk prediction in settings where collection of complete pedigree information is impractical.
Introduction
Carriers of deleterious mutations of the BRCA1 and BRCA2 genes are at a much higher lifetime risk of developing breast and ovarian cancers than the general population [1, 2], and may benefit from more intensive screening, prophylactic surgery, and/or chemoprevention [3]. Yet a majority of mutation carriers remain unaware of their status and risk, and are not managed in a way that might mitigate their risk [4]. This is partly because health care providers lack tools that can help them efficiently identify high-risk patients within the time and resource constraints of a busy practice. Genetic risk prediction models used currently in genetic counseling could help fill this gap if adapted and incorporated into Electronic Medical Records (EMR) or other Health Information Technology (HIT) solutions [5]. Such adaptation could play a central role in identifying potential carriers so that they can be referred for risk assessment, genetic testing, and appropriate management.
The BRCAPRO genetic risk prediction model [6] is widely used in genetic counseling and is freely available through the BayesMendel R package [7], CancerGene genetic counseling package (http://www.utsouthwestern.edu/utsw/cda/dept47829/files/65844.html), HughesRiskApps (HRA; http://www.HughesRiskApps.net), and through a web-based risk service (http://bayesmendel.dfci.harvard.edu/risk/). It estimates the probability that a counselee carries a deleterious mutation of BRCA1 or BRCA2 as well as his/her risk of developing cancer. BRCAPRO is improved continually and currently can utilize a wealth of relevant information on proband and family history [8-12]. However, in many health care settings, collecting exhaustively the family history used by BRCAPRO is not practical. Thus, it is useful to develop simplified adaptations of BRCAPRO. An example, named BRCAPROLYTE, is implemented in HRA [13].
HRA is a freeware program designed to manage high risk clinic data as well as to identify high risk women within the framework of a breast imaging center, a breast surgery practice, or an obstetrics practice. HRA collects family history via a tablet-based, patient self administered questionnaire and assesses risk fully electronically [13]. To address time and resource constraints, the basic HRA survey only collects a limited family history including the numbers and types of affected first- and second-degree relatives, and their ages of diagnosis. The data are analyzed in real time by BRCAPROLYTE and other models to assess the risk of carrying a BRCA1/2 mutation. If the risk is high (10% or greater in many clinical applications), the patient is informed that counseling is advised. The electronic nature of the process makes it highly efficient. HRA and hence BRCAPROLYTE are currently in use in many clinical settings, however, BRCAPROLYTE has not been evaluated and tested.
In this article, we evaluate BRCAPROLYTE and three other simplified versions of BRCAPRO that we refer to as BRCAPROLYTE-Plus, BRCAPROLYTE-Simple, and BRCAPRO-1Degree. BRCAPROLYTE-Plus takes the same information as BRCAPROLYTE plus the family structure and additionally imputes ages of unaffected relatives. BRCAPROLYTE-Simple does not require knowledge of family structure and imputes both the family structure and the ages of unaffected relatives. BRCAPRO-1Degree is the same as BRCAPROLYTE but uses information on first degree affected relatives only. In addition, we also consider the Family History Assessment Tool (FHAT) [14], another tool designed to rapidly identify high risk individuals for testing. We compare the performances of these five tools and also investigate the clinical implications of using them.
Methods
Data
We use data originally collected for the Cancer Genetics Network (CGN) Carrier Probability Validation project [15], and additional data from the MD Anderson Cancer Center (MDA), as summarized in Table 1. While MDA was one of the sites in [15], we excluded it from this analysis to avoid overlap with larger and more up-to-date data we have available. Data from Baylor College of Medicine are a population-based sample of Ashkenazi Jews and include a much smaller proportion of BRCA mutation carriers (2.1%) compared to other sites, wherein families were selected for participation in high-risk clinics. In total, we consider 2713 probands with family history information and genetic test results. A total of 576 (21.2%) probands are BRCA mutation carriers. Three probands are carriers of both BRCA1 and BRCA2 mutations. The median family size ranges from 10 to 35, which highlights the practical difficulty of collecting complete family information in many health care settings. We ran BRCAPRO, BRCAPROLYTE, BRCAPROLYTE-Plus, BRCAPROLYTE-Simple, BRCAPRO-1Degree, and FHAT on all probands. In the following, we discuss these tools and the evaluation strategy.
Table 1.
Pedigree Characteristics by Sites. All data except for the MDA site are from [15]. Entries are numbers followed by percents in parentheses except for rows denoted by ** where entries are median followed by Inter-quartile range (IQR) in parenthesis. Also, Pro. is Proband, BC is Breast Cancer and OC is Ovarian Cancer.
| All Sites | MDA | GT | Penn | Duke | JHU | Baylor | UTSW | HCI | |
|---|---|---|---|---|---|---|---|---|---|
| Total pedigrees | 2713 | 796 | 248 | 773 | 277 | 106 | 282 | 115 | 116 |
| Pro. AJ descent | 744 (27.4) | 80 (10.1) | 89 (35.9) | 194 (25.1) | 26 (9.4) | 48 (45.3) | 282 (100) | 22 (19.1) | 3 (2.6) |
| Pro. BRCA1+ | 377 (13.9) | 107 (13.4) | 54 (21.8) | 131 (16.9) | 37 (13.4) | 10 (9.4) | 6 (2.1) | 17 (14.8) | 15 (12.9) |
| Pro. BRCA2+ | 202 (7.4) | 80 (10.1) | 22 (8.9) | 57 (7.4) | 17 (6.1) | 5 (4.7) | 0 (0) | 9 (7.8) | 12 (10.3) |
| Pedigree size** | 20 (15) | 35 (19) | 18 (8) | 16 (10) | 19 (8) | 15 (7) | 15 (7) | 10 (6) | 23 (16.5) |
| Age of pro.** | 49 (17) | 46 (16) | 51.5 (14) | 49 (19) | 48 (13) | 50 (12.75) | 52 (14) | 47 (16) | 61.5 (24.25) |
| Males tested | 87 (3.2) | 9 (1.1) | 2 (0.8) | 68 (8.8) | 0 (0) | 2 (1.9) | 0 (0) | 6 (5.2) | 0 (0) |
| Males tested & BC | 48 (1.8) | 5 (0.6) | 1 (0.4) | 39 (5) | 0 (0) | 1 (0.9) | 0 (0) | 2 (1.7) | 0 (0) |
| Pro. unilateral BC | 1628 (60) | 517 (64.9) | 198 (79.8) | 500 (64.7) | 193 (69.7) | 49 (46.2) | 33 (11.7) | 51 (44.3) | 87 (75) |
| Pro. bilateral BC | 244 (9) | 94 (11.8) | 34 (13.7) | 51 (6.6) | 46 (16.6) | 7 (6.6) | 0 (0) | 12 (10.4) | 0 (0) |
| Pro. with OC | 245 (9) | 87 (10.9) | 21 (8.5) | 86 (11.1) | 27 (9.7) | 5 (4.7) | 2 (0.7) | 10 (8.7) | 7 (6) |
| Pro. with BC & OC | 88 (3.2) | 27 (3.4) | 8 (3.2) | 35 (4.5) | 11 (4) | 1 (0.9) | 0 (0) | 6 (5.2) | 0 (0) |
| BC age for pro.** | 43 (14) | 42 (13) | 44 (12) | 42 (15) | 42 (12) | 46 (10.25) | 48 (13) | 42 (13.5) | 47 (20.5) |
| OC age for pro.** | 51 (14) | 54 (17) | 47 (8) | 53.5 (14.75) | 49 (7) | 50 (14) | 58 (20) | 49 (11.75) | 52 (8.5) |
MDA: MD Anderson Cancer Center, GT: Georgetown University, Penn: University of Pennsylvania, Duke: Duke University, JHU: Johns Hopkins University, Baylor: Baylor College of Medicine, UTSW: University of Texas Southwestern Medical Center, HCI: Huntsman Cancer Institute.
BRCAPRO
BRCAPRO is a Mendelian model utilizing detailed information on all available relatives (of any degree) including relationships between members, ethnicity, ages of breast and ovarian cancer diagnosis, and current age/age of death for unaffected members. We used the version implemented in BayesMendel 2.0-8, which also incorporates breast tumor marker (ER, PR, and Her-2/neu) information for members affected with breast cancer [8, 12]. However, this information was only available for MDA, and so for those families, we evaluated BRCAPRO both with and without using marker information. To be consistent across all sites while combining the results, the latter is the one we used in our summaries. We present differences resulting from including tumor marker in the Discussion section. None of the following simpler tools use marker information.
BRCAPROLYTE
BRCAPROLYTE evaluates BRCAPRO using age of the proband and ages of diagnosis for affected first- and second-degree relatives. A proband is asked about the numbers and types of first-and second-degree relatives (including maternal/paternal side information), and if any of those relatives are affected with cancer. If the proband indicates that a relative has cancer, BRCAPROLYTE further requires the age of diagnosis. For unaffected relatives, no additional information is collected. Also, the AJ status of the proband is collected and utilized in calculations. We evaluated BRCAPROLYTE using BRCAPRO, by setting the current age/age at death of unaffected relatives as missing.
BRCAPROLYTE-Plus
As BRCAPROLYTE ignores unaffected relatives, its carrier probabilities are generally inflated. However, it is not excessively onerous to collect information on the numbers of first- and second-degree relatives, as HRA does currently. Using these, in BRCAPROLYTE-Plus, we impute the ages of unaffected relatives to compensate for this inflation, and thereby reduce false positives.
For imputation purposes, “age” refers to current age or age at death. BRCAPROLYTE-Plus imputes ages by utilizing an external independent dataset of unaffected relatives from families collected in colorectal cancer high risk clinics [16]. In Table 2, we list the median and interquartile range of ages for different first- and second-degree relative types in this dataset, stratified by the number of relatives of that type (1, 2-4, and ≥5). For imputation, we use the median age from this table. For example, if a proband has 3 maternal aunts, we impute their current ages using the median age of maternal aunts of probands who have 2-4 maternal aunts (67.5 years). We do not impute family structure in BRCAPROLYTE-Plus, so BRCAPROLYTE-Plus requires the same information as BRCAPROLYTE.
Table 2.
Median and interquartile range of ages of various relative types stratified by the number of relatives obtained from the colorectal data [16]. BRCAPROLYTE-Plus and BRCAPROLYTE-Simple impute the median ages for ages of unaffected relatives.
| Relative Type | Number of Relatives
|
||
|---|---|---|---|
| 1 | 2 – 4 | ≥ 5 | |
| Sister | 48 (20) | 48.5 (18.5) | 54 (19.4) |
| Brother | 49 (19) | 48 (16) | 57.1 (19.4) |
| Daughter | 28 (23) | 33.5 (21.5) | 48.2 (13.1) |
| Son | 28 (21) | 30 (23.2) | 46.4 (8.9) |
| Maternal aunt | 70 (17) | 67.5 (19) | 68.2 (16.3) |
| Maternal uncle | 67 (20.5) | 65.7 (19.2) | 61.8 (13.5) |
| Paternal aunt | 70 (28) | 68.5 (18.5) | 69.5 (14.3) |
| Paternal uncle | 67 (21.8) | 66 (16) | 67.5 (15.3) |
| Mother | 70 (20) | — | — |
| Father | 69 (19) | — | — |
| Paternal grandmother | 76 (20) | — | — |
| Paternal grandfather | 70 (25) | — | — |
| Maternal grandmother | 75 (22) | — | — |
| Maternal grandfather | 70 (24) | — | — |
BRCAPROLYTE-Simple
BRCAPROLYTE-Plus requires that the family structure be known. To explore whether the burden for data collection can be further reduced, we examine BRCAPROLYTE-Simple, which only requires information on the numbers and types of affected relatives and their ages of diagnosis. Unlike BRCAPROLYTE-Plus, this does not need knowledge of the total number of relatives of each type. BRCAPROLYTE-Simple imputes the number of relatives using the median number of relatives for each relative type from the same colorectal data used for imputing ages in BRCAPROLYTE-Plus [16]. The median number of relatives is one for each relative type that is listed in Table 2. So, if a proband does not have an affected relative of a particular type, a single unaffected relative of that type is created. Imputation of ages for the newly created unaffected relatives proceeds as in BRCAPROLYTE-Plus.
BRCAPRO-1Degree
This tool is similar to BRCAPROLYTE but only uses affected relatives up to the first degree. So, to run it, we set information on all relatives beyond the first degree and all unaffected first degree relatives as missing.
FHAT
FHAT uses a 17-question interview about affected relatives to produce a quantitative score. Any relative affected with breast, ovarian, prostate, or colon cancer up to 3rd degree contribute to the score. A score of 10 or higher is typically considered as indicative of high risk. So, for FHAT, we use this cutoff for calculating sensitivity, specificity, and predictive values as described below.
Evaluation Strategy
We use scatterplots to visually compare the probability of carrying any BRCA mutation, as generated by each of the simpler tools to those obtained using BRCAPRO. Next, we evaluate the clinical impact of using a simplified tool in place of BRCAPRO. For this, first we compare various tools in terms of the numbers of probands whose carrier probabilities exceed or are equal to different cutoffs (i.e., the number of referrals) by each tool, and the number of carriers captured among those referred. With this information, we investigate what cutoffs may be appropriate for simpler tools to clinically perform similarly to how BRCAPRO performs at 10%, the most commonly used cutoff. To further assess clinical impact, we consider the additional numbers of probands who are classified correctly or incorrectly as high or low risk (i.e., referred or not referred) using a simpler version as compared to BRCAPRO. Here the classification is considered correct if a carrier is classified as high risk or a non-carrier is classified as low risk. Thus, for such comparison, four numbers are of interest — two each for correct and incorrect classification. These are combined in a measure called Net Reclassification Improvement (NRI) [17], which we report along with its four components. Next, we plot the Receiver Operating Characteristic (ROC) curve and report the Area under the ROC curve (AUC) for all tools. We also report the sensitivity, specificity, predictive value (PV) positive (PVP) and negative (PVN) at various cutoffs. To assess calibration, we compare the observed number of carriers to the number of carriers expected according to each method. For FHAT, we do not evaluate calibration and NRI as the FHAT score is not in the probability scale. We find 95% confidence interval (CI) obtained using the bootstrap method [18] for each of the reported statistics. We used the statistical software R 2.15.2 for all computations.
Results
Figure 1 shows scatterplots of carrier probabilities from the five simpler tools plotted against those from BRCAPRO. The BRCAPROLYTE probabilities are, in general, larger than the corresponding BRCAPRO probabilities. This is expected as BRCAPROLYTE only uses information on affected relatives, leading to inflation of the probability. BRCAPROLYTE-Plus, by imputing the ages for those relatives, decreases the probabilities across the range as seen from the fact that the points in its plot are closer to the diagonal line of equality with BRCAPRO. BRCAPROLYTE-Simple shows an intermediate pattern between those of BRCAPROLYTE and BRCAPROLYTE-Plus. The probabilities from BRCAPRO-1Degree seem to have the least correlation with those from BRCAPRO. This demonstrates that information on first degree relatives only is not generally enough to capture family history for counseling purposes. Finally, FHAT scores are positively correlated with BRCAPRO probabilities.
Figure 1.

Probabilities of carrying any BRCA mutation as computed by the five simpler tools plotted against those from BRCAPRO.
In clinical applications it is common to consider a specific threshold of risk as a trigger for differential clinical management, as in this case, referral to counseling. In Table 3, we report the total number of referrals and the number of carriers captured in those referrals. We would ideally like to have fewer referrals (and hence reduced burden of following up the referred patients) but capture more carriers in those referrals. At the most commonly used cutoff of 10%, BRCAPRO captures 413 carriers out of 1031 referrals giving a percentage of carriers per referral (or predictive value positive) of 40%. In other words, among probands whose carrier probability is 10% or higher, 40% are actually carriers. The corresponding percentages for other tools are 30% (BRCAPROLYTE), 42% (BRCAPROLYTE-Plus), 32% (BRCAPRO-1Degree), 36% (BRCAPROLYTE-Simple), and 30% (FHAT). Thus, BRCAPROLYTE-Plus is closest to BRCAPRO in this regard followed by BRCAPROLYTE-Simple. The tools compare similarly at other cutoffs. Table 3 can also be used to find cutoffs at which simpler tools perform closest to what BRCAPRO provides at the 10%, or other, cutoff. For example, if we want the number of referrals to be similar to that of BRCAPRO at 10% (1031), the cutoff to be used for BRCAPROLYTE should be slightly less than 30%, however, if we want to capture similar number of carriers (413) we might set the threshold between 20-25%. For BRCAPROLYTE-Plus and BRCAPROLYTE-Simple, the respective cutoffs should be slightly lower and higher than 10%, and they will capture comparable numbers of carriers as BRCAPRO. For BRCAPRO-1Degree, the cutoff should be close to 20%, and it will capture fewer carriers than BRCAPRO. Overall, it is clear that BRCAPROLYTE-Plus performs best among all simpler tools. Finally, FHAT at cutoff 10 has a comparable number of referrals as do BRCAPRO at cutoff 3% and BRCAPROLYTE at cutoff 10%, and has also comparable percentage of carriers captured among those referred as BRCAPROLYTE.
Table 3.
Numbers of referrals (denominator) made by each tool at different cutoffs and the number of carriers (numerator) out of those referrals. The bold numbers correspond to the commonly used threshold of 10% for referral by BRCAPRO and for simpler tools, they correspond to the modified thresholds at which the respective tools perform closest to BRCAPRO. LYTE represents BRCAPROLYTE.
| Cutoff | BRCAPRO | LYTE | LYTE-Plus | BRCAPRO-1Degree | LYTE-Simple | FHAT |
|---|---|---|---|---|---|---|
| 0.3 | 300/580 = 0.52 | 387/997 = 0.39 | 276/527 = 0.52 | 307/713 = 0.43 | 316/648 = 0.49 | |
| 0.25 | 320/649 = 0.49 | 407/1105 = 0.37 | 298/590 = 0.51 | 329/815 = 0.40 | 334/721 = 0.46 | |
| 0.2 | 345/734 = 0.47 | 436/1250 = 0.35 | 319/652 = 0.49 | 352/922 = 0.38 | 357/818 = 0.44 | |
| 0.1 | 413/1031 = 0.40 | 493/1631 = 0.30 | 379/902 = 0.42 | 418/1301 = 0.32 | 426/1166 = 0.37 | |
| 0.05 | 457/1358 = 0.34 | 531/2027 = 0.26 | 438/1243 = 0.35 | 475/1726 = 0.28 | 486/1521 = 0.32 | |
| 0.03 | 497/1620 = 0.31 | 552/2254 = 0.24 | 471/1476 = 0.32 | 516/2060 = 0.25 | 511/1788 = 0.29 | |
| 0.01 | 547/2069 = 0.26 | 568/2583 = 0.22 | 535/2002 = 0.27 | 560/2542 = 0.22 | 556/2299 = 0.24 | |
| 10 | 488/1625 = 0.30 |
To further evaluate the clinical implications of using these simpler versions, we consider how many additional probands would be reclassified if one was to switch from BRCAPRO to a simplified implementation. At the threshold of 10% carrier probability, BRCAPROLYTE reclassifies to high risk (i.e., the carrier probability moves above the threshold), 14% of carriers (a desirable reclassification) and 25% of non-carriers (an undesirable reclassification), while it does not reclassify any carrier or non-carrier to low risk. This is summarized in NRI (Table 4), which is calculated as (0.14 - 0) - (0.25 - 0) = -0.11; the negative value in this case reflects the fact that BRCAPROLYTE is worse in classification than BRCAPRO. BRCAPROLYTE-Plus, at the same cutoff, reclassifies fewer families than BRCAPROLYTE, and the difference with BRCAPRO is not statistically significant on the NRI scale. In Table 4, we report the NRI and its four components for the tools studied here, at three different clinically relevant thresholds. BRCAPROLYTE-Plus is closest to BRCAPRO with its CI including 0 for each threshold. The next best is BRCAPROLYTE-Simple.
Table 4.
NRI statistic and its four components representing the proportions of carriers (C) and non-carriers (NC) who got reclassified as high risk (moved up) or low risk (moved down) when a simplified tool is used in place of BRCAPRO at the same cutoff. So, the four components are C.up, C.down, NC.up, and NC.down.
| Cutoff | Tool | C.up | C.down | NC.up | NC.down | NRI | 95% CI |
|---|---|---|---|---|---|---|---|
| 0.01 | BRCAPROLYTE | 0.04 | 0 | 0.23 | 0 | -0.19 | (-0.22, -0.17) |
| BRCAPRO-1Degree | 0.03 | 0.01 | 0.22 | 0.01 | -0.19 | (-0.22, -0.17) | |
| BRCAPROLYTE-Plus | 0.01 | 0.03 | 0.04 | 0.07 | 0 | (-0.02, 0.03) | |
| BRCAPROLYTE-Simple | 0.02 | 0 | 0.11 | 0.01 | -0.09 | (-0.11, -0.07) | |
|
| |||||||
| 0.05 | BRCAPROLYTE | 0.13 | 0 | 0.28 | 0 | -0.15 | (-0.18, -0.12) |
| BRCAPRO-1Degree | 0.1 | 0.07 | 0.21 | 0.05 | -0.13 | (-0.17, -0.1) | |
| BRCAPROLYTE-Plus | 0.02 | 0.05 | 0.02 | 0.07 | 0.01 | (-0.01, 0.04) | |
| BRCAPROLYTE-Simple | 0.06 | 0.01 | 0.09 | 0.02 | -0.01 | (-0.04, 0.01) | |
|
| |||||||
| 0.1 | BRCAPROLYTE | 0.14 | 0 | 0.25 | 0 | -0.1 | (-0.14, -0.07) |
| BRCAPRO-1Degree | 0.1 | 0.09 | 0.18 | 0.05 | -0.12 | (-0.15, -0.07) | |
| BRCAPROLYTE-Plus | 0.01 | 0.07 | 0.01 | 0.06 | -0.01 | (-0.04, 0.01) | |
| BRCAPROLYTE-Simple | 0.05 | 0.02 | 0.08 | 0.02 | -0.03 | (-0.06, -0.01) | |
Figure 2 shows ROC curves and the corresponding AUC for the combined sample. Among the simplified tools, BRCAPROLYTE-Plus and BRCAPROLYTE-Simple have the highest AUC while BRCAPRO-1Degree performs worst. The AUCs vary by sites as reported in Table 5. In general, of the simpler tools, BRCAPROLYTE-Plus performs best followed closely by BRCAPROLYTE-Simple.
Figure 2.

ROC curves with AUC and their 95% CI.
Table 5.
AUC and its 95% CI by site. LYTE represents BRCAPROLYTE.
| BRCAPRO | LYTE | LYTE-Plus | BRCAPRO-1Degree | LYTE-Simple | FHAT | |
|---|---|---|---|---|---|---|
| MDA | 0.774 (0.735, 0.812) | 0.737 (0.693, 0.779) | 0.768 (0.729, 0.808) | 0.681 (0.631, 0.728) | 0.759 (0.715, 0.802) | 0.737 (0.694, 0.779) |
| GT | 0.765 (0.7, 0.826) | 0.743 (0.674, 0.807) | 0.755 (0.689, 0.822) | 0.722 (0.643, 0.793) | 0.75 (0.68, 0.816) | 0.716 (0.643, 0.785) |
| Penn | 0.771 (0.732, 0.811) | 0.765 (0.724, 0.806) | 0.765 (0.724, 0.806) | 0.745 (0.7, 0.784) | 0.772 (0.732, 0.81) | 0.716 (0.671, 0.759) |
| Duke | 0.823 (0.763, 0.877) | 0.816 (0.75, 0.874) | 0.827 (0.768, 0.881) | 0.781 (0.706, 0.85) | 0.819 (0.76, 0.873) | 0.754 (0.68, 0.821) |
| JHU | 0.829 (0.722, 0.914) | 0.81 (0.703, 0.906) | 0.841 (0.744, 0.931) | 0.7 (0.522, 0.856) | 0.816 (0.709, 0.917) | 0.83 (0.721, 0.921) |
| Baylor | 0.699 (0.588, 0.816) | 0.723 (0.61, 0.842) | 0.727 (0.613, 0.836) | 0.744 (0.61, 0.869) | 0.717 (0.591, 0.844) | 0.759 (0.661, 0.845) |
| UTSW | 0.82 (0.72, 0.907) | 0.808 (0.71, 0.892) | 0.817 (0.72, 0.899) | 0.744 (0.615, 0.86) | 0.821 (0.726, 0.905) | 0.772 (0.673, 0.859) |
| HCI | 0.696 (0.569, 0.815) | 0.641 (0.52, 0.754) | 0.675 (0.539, 0.797) | 0.618 (0.494, 0.734) | 0.673 (0.546, 0.791) | 0.599 (0.474, 0.725) |
MDA: MD Anderson Cancer Center, GT: Georgetown University, Penn: University of Pennsylvania, Duke: Duke University, JHU: Johns Hopkins University, Baylor: Baylor College of Medicine, UTSW: University of Texas Southwestern Medical Center, HCI: Huntsman Cancer Institute.
Next, in Table 6, we report sensitivity, specificity, and PVs. These statistics vary across different tools at the same cutoff as reflected earlier in the varying numbers of referral and carriers captured. In fact, PVP is equivalent to the % of carriers captured per referral as reported in Table 3. At 10% cutoff, BRCAPROLYTE has the highest sensitivity, even higher than BRCAPRO, but has the lowest specificity while BRCAPROLYTE-Plus has the lowest sensitivity and highest specificity. If one is interested in comparing specificities of different tools for a fixed sensitivity, Figure 3 may be used. For example, at the 80% sensitivity value denoted by the horizontal gray line, the specificity values for different tools can be found by drawing a vertical line from the 80% sensitivity point to the corresponding specificity curve. BRCAPROLYTE-Plus and BRCAPROLYTE-Simple give slightly higher specificity than BRCAPROLYTE for similar values of sensitivity. Also, from Table 6, the specificity, sensitivity, and PVs of FHAT is similar to that of BRCAPROLYTE at 10% cutoff.
Table 6.
Sensitivity, Specificity, PVP, and PVN, and their 95% CI. LYTE represents BRCAPROLYTE.
| Cutoff | BRCAPRO | LYTE | LYTE-Plus | BRCAPRO-1Degree | LYTE-Simple | FHAT | |
|---|---|---|---|---|---|---|---|
| Se | 0.1 | 0.72 (0.68, 0.75) | 0.86 (0.83, 0.88) | 0.66 (0.62, 0.7) | 0.73 (0.69, 0.76) | 0.74 (0.7, 0.77) | |
| Sp | 0.71 (0.69, 0.73) | 0.47 (0.45, 0.49) | 0.76 (0.74, 0.77) | 0.59 (0.57, 0.61) | 0.65 (0.63, 0.67) | ||
| Se | 0.05 | 0.79 (0.76, 0.83) | 0.92 (0.9, 0.94) | 0.76 (0.72, 0.79) | 0.82 (0.79, 0.85) | 0.84 (0.81, 0.87) | |
| Sp | 0.58 (0.56, 0.6) | 0.3 (0.28, 0.32) | 0.62 (0.6, 0.64) | 0.41 (0.39, 0.44) | 0.52 (0.49, 0.54) | ||
| Se | 0.03 | 0.86 (0.83, 0.89) | 0.96 (0.94, 0.97) | 0.82 (0.79, 0.85) | 0.9 (0.87, 0.92) | 0.89 (0.86, 0.91) | |
| Sp | 0.47 (0.45, 0.5) | 0.2 (0.19, 0.22) | 0.53 (0.51, 0.55) | 0.28 (0.26, 0.3) | 0.4 (0.38, 0.42) | ||
| Se | 0.01 | 0.95 (0.93, 0.97) | 0.99 (0.98, 0.99) | 0.93 (0.91, 0.95) | 0.97 (0.96, 0.98) | 0.97 (0.95, 0.98) | |
| Sp | 0.29 (0.27, 0.31) | 0.06 (0.05, 0.07) | 0.31 (0.29, 0.33) | 0.07 (0.06, 0.08) | 0.18 (0.17, 0.2) | ||
| Se | 10 | 0.85 (0.82, 0.88) | |||||
| Sp | 0.47 (0.45, 0.49) | ||||||
|
| |||||||
| PVP | 0.1 | 0.4 (0.37, 0.43) | 0.3 (0.28, 0.32) | 0.42 (0.39, 0.45) | 0.32 (0.3, 0.35) | 0.37 (0.34, 0.39) | |
| PVN | 0.9 (0.89, 0.92) | 0.92 (0.91, 0.94) | 0.89 (0.88, 0.9) | 0.89 (0.87, 0.9) | 0.9 (0.89, 0.92) | ||
| PVP | 0.05 | 0.34 (0.31, 0.36) | 0.26 (0.24, 0.28) | 0.35 (0.33, 0.38) | 0.28 (0.25, 0.3) | 0.32 (0.3, 0.34) | |
| PVN | 0.91 (0.9, 0.93) | 0.93 (0.92, 0.95) | 0.91 (0.89, 0.92) | 0.9 (0.88, 0.92) | 0.92 (0.91, 0.94) | ||
| PVP | 0.03 | 0.31 (0.28, 0.33) | 0.24 (0.23, 0.26) | 0.32 (0.3, 0.34) | 0.25 (0.23, 0.27) | 0.29 (0.26, 0.31) | |
| PVN | 0.93 (0.91, 0.94) | 0.95 (0.93, 0.97) | 0.92 (0.9, 0.93) | 0.91 (0.89, 0.93) | 0.93 (0.91, 0.95) | ||
| PVP | 0.01 | 0.26 (0.25, 0.28) | 0.22 (0.2, 0.24) | 0.27 (0.25, 0.29) | 0.22 (0.2, 0.24) | 0.24 (0.22, 0.26) | |
| PVN | 0.95 (0.94, 0.97) | 0.94 (0.89, 0.98) | 0.94 (0.92, 0.96) | 0.91 (0.86, 0.95) | 0.95 (0.93, 0.97) | ||
| PVP | 10 | 0.3 (0.28, 0.32) | |||||
| PVN | 0.92 (0.9, 0.94) | ||||||
Figure 3.
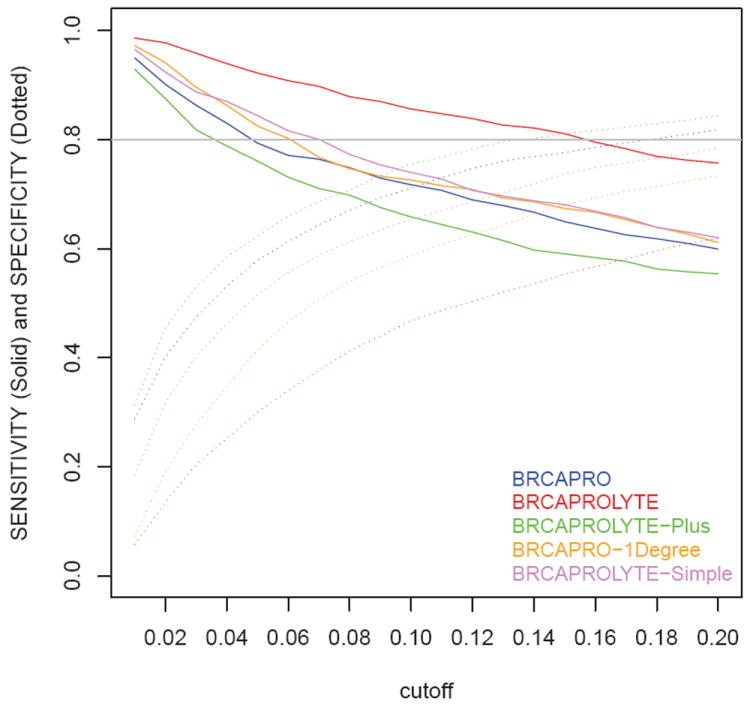
Sensitivity and Specificity for cutoffs ranging from 0.01 to 0.2 calculated at an increment of 0.01.
With regard to calibration, the average number of carriers estimated by each tool is 517.30 (BRCAPRO), 820.83 (BRCAPROLYTE), 604.34 (BRCAPRO-1Degree), 464.71 (BRCAPROLYTE-Plus) and 577.91 (BRCAPROLYTE-Simple). By comparing these to the observed number of carriers, 576, we see that BRCAPROLYTE overestimates the overall number of carriers while BRCAPROLYTE-Plus underestimates. BRCAPROLYTE-Simple is best and even slightly better than BRCAPRO.
Discussion
We have developed and evaluated simplified versions of BRCAPRO. Of these, BRCAPROLYTE has been in use in clinical settings, though this is the first time that it is empirically evaluated. Our results show that it has high sensitivity but it overestimates carrier probabilities by a potentially large extent as it relies only on the affected relatives. Thus, we proposed BRCAPROLYTE-Plus wherein ages for unaffected relatives are imputed. This attempts to correct for the overestimation without increasing the burden of data collection. BRCAPROLYTE-Plus does balance the overestimation to some extent and thus gives higher specificity than BRCAPROLYTE for similar values of sensitivity. We also showed that the burden of data collection can be further reduced by asking only about the affected relatives and using BRCAPROLYTE-Simple to impute the rest of the family members and their ages. BRCAPROLYTE-Simple performs slightly better than BRCAPROLYTE. FHAT at cutoff 10 performed similar to BRCAPROLYTE at cutoff 10%, however, BRCAPROLYTE has larger AUC. BRCAPRO-1Degree performs worst, clearly demonstrating the need for collecting information on affected second-degree relatives for genetic risk prediction.
We also found that there is only modest loss in discrimination and calibration by BRCAPROLYTE-Plus and BRCAPROLYTE-Simple as compared to the complete BRCAPRO. From a practical point of view, as these simpler versions take limited amount of family information, they can be efficiently integrated into the EMR and other HIT solutions at the primary care or screening level, and thus can be routinely used to screen patients for their genetic risk. Nonetheless, it must be pointed out that BRCAPRO has additional features that are not included in simplified tools. It can utilize information on tumor markers, genetic test results, and medical interventions such as oophorectomy [8, 10, 12]. BRCAPRO must also be available for management beyond screening.
In our data, MDA is the only site that had information on ER, PR, and Her-2/neu. These were not utilized to assess BRCAPRO in the results presented here, to facilitate comparison with other sites and to better focus on assessing the information loss from omitting the questions about unaffected relatives’ age and/or family structure. If tumor marker information is available, the loss in using simplified versions of BRCAPRO is greater. For the MDA site, the AUC of BRCAPRO including marker information increases from 0.774 (in Table 5) to 0.802, and sensitivity/specificity at 10% cutoff increase from 0.64/0.78 to 0.66/0.79. The calibration is only slightly changed. If tumor marker information is readily available, the loss in using simpler tools is generally greater and must be weighed against the data collection burden associated with complete BRCAPRO.
For BRCAPROLYTE-Plus, we imputed missing ages using the median age, after stratifying by the number of relatives. We also carried out two sensitivity analyses by using the mean age in place of the median age and by using a coarser stratification by numbers of relatives. The results from both analyses are very close to what we have reported.
A practical issue is the choice of cutoff to be used for the simplified tools in clinical settings. We described how cutoffs may be chosen so that the number of referrals by a tool is comparable to that of BRCAPRO. One could also consider sensitivity and specificity. The trade-off between sensitivity, specificity, and burden of following up of referrals can be evaluated using Table 6, Figure 3, and Table 3 together to choose a cutoff that suits specific needs. For example, a user of BRCAPROLYTE-Simple could achieve a sensitivity of 0.84 and a specificity of 0.52 using a cutoff of 0.05. This would lead to referral of about half of the patients (1521/2713). As seen in Figure 3, for achieving the same sensitivity, different tools require different cutoffs. As different clinical scenarios may require a different balance of specificity, sensitivity, and cost and benefit of genetic counseling, we recommend a careful weighing of cutoffs prior to implementation. One should also keep in mind that the widely used 10% cutoff has different interpretation and implications depending on the tool used, as we have discussed in the Results section. For a specific clinical scenario, more formal statistical analysis can be carried out to determine an optimal cutoff if the associated cost and benefit for genetic risk prediction can be quantified [19].
A limitation of our study is that the data used here are mostly from high-risk families. For our one population-based sample, Baylor, we found that sensitivity dropped faster with increasing cutoff and so smaller cutoffs should be used for such a scenario, as expected. The performance of the proposed tools for this site is similar to the results we presented here for combined sample and this is consistent with earlier studies [15]. However, the sample size and the number of carriers for this site is small and so it would be useful to validate these approaches on a larger population-based sample.
In summary, we have shown that one can use modifications of BRCAPRO with limited collection of family history to construct simple and practical risk assessment tools whose performance is comparable to that of standard tools used in high risk clinics. This limited data collection is feasible in a busy practice. Thus, these tools have formidable potential to bring the benefits of genetic counseling and testing to large sections of the population who are still unaware of the important prevention implications of inherited susceptibility.
Acknowledgments
This work was supported in part by Susan G Komen grant KG081303, National Cancer Institute grants 1R03CA173834-01 and 2P30CA006516-47 and the Dana Farber Cancer Institute.
Footnotes
Conflict of Interest
The BayesMendel and HRA software are free to nonprofit institutions. HRA may be licensed to commercial entities, which would generate royalties for Hughes and Parmigiani.
References
- 1.Antoniou A, Pharoah PD, Narod S, et al. Average risks of breast and ovarian cancer associated with BRCA1 or BRCA2 mutations detected in case series unselected for family history: a combined analysis of 22 studies. Am J Hum Genet. 2003;72:1117–1130. doi: 10.1086/375033. [DOI] [PMC free article] [PubMed] [Google Scholar]
- 2.King MC, Marks JH, Mandell JB. Breast and ovarian cancer risks due to inherited mutations in BRCA1 and BRCA2. Science. 2003;302:643–646. doi: 10.1126/science.1088759. [DOI] [PubMed] [Google Scholar]
- 3.Schwartz GF, Hughes KS, Lynch HT, Fabian CJ, Fentiman IS, Robson ME, Domchek SM, Hartmann LC, Holland R, Winchester DJ Consensus Conference Committee The International Consensus Conference Committee. Cancer; Proceedings of the international consensus conference on breast cancer risk, genetics, & risk management; April, 2007; 2008. pp. 2627–2637. [DOI] [PubMed] [Google Scholar]
- 4.Drohan B, Roche CA, Cusack JC, Hughes KS. Hereditary breast and ovarian cancer and other hereditary syndromes: using technology to identify carriers. Ann Surg Oncol. 2012;19:1732–1737. doi: 10.1245/s10434-012-2257-y. [DOI] [PubMed] [Google Scholar]
- 5.Drohan B, Ozanne EM, Hughes KS. Electronic health records and the management of women at high risk of hereditary breast and ovarian cancer. Breast J. 2009;15(Suppl 1):46–55. doi: 10.1111/j.1524-4741.2009.00796.x. [DOI] [PubMed] [Google Scholar]
- 6.Parmigiani G, Berry D, Aguilar O. Determining carrier probabilities for breast cancer-susceptibility genes BRCA1 and BRCA2. Am J Hum Genet. 1998;62:145–158. doi: 10.1086/301670. [DOI] [PMC free article] [PubMed] [Google Scholar]
- 7.Chen S, Wang W, Broman KW, et al. BayesMendel: an R environment for Mendelian risk prediction. Stat Appl Genet Mol Biol. 2004;3 doi: 10.2202/1544-6115.1063. Article21. [DOI] [PMC free article] [PubMed] [Google Scholar]
- 8.Tai YC, Chen S, Parmigiani G, et al. Incorporating tumor immunohistochemical markers in BRCA1 and BRCA2 carrier prediction. Breast Cancer Res. 2008;10:401. doi: 10.1186/bcr1866. [DOI] [PMC free article] [PubMed] [Google Scholar]
- 9.Katki HA, Blackford A, Chen S, et al. Multiple diseases in carrier probability estimation: accounting for surviving all cancers other than breast and ovary in BRCAPRO. Stat Med. 2008;27:4532–4548. doi: 10.1002/sim.3302. [DOI] [PMC free article] [PubMed] [Google Scholar]
- 10.Katki HA. Incorporating medical interventions into Mendelian mutation prediction models. BMC Med Genet. 2007;8:13. doi: 10.1186/1471-2350-8-13. [DOI] [PMC free article] [PubMed] [Google Scholar]
- 11.Chen S, Blackford AL, Parmigiani G. Tailoring BRCAPRO to Asian-Americans. J Clin Oncol. 2009;27:642–643. doi: 10.1200/JCO.2008.20.6896. [DOI] [PMC free article] [PubMed] [Google Scholar]
- 12.Biswas S, Tankhiwale N, Blackford A, et al. Assessing the added value of breast tumor markers in genetic risk prediction model BRCAPRO. Breast Cancer Res Treat. 2012;133:347–355. doi: 10.1007/s10549-012-1958-z. [DOI] [PubMed] [Google Scholar]
- 13.Ozanne EM, Loberg A, Hughes S, et al. Identification and management of women at high risk for hereditary breast/ovarian cancer syndrome. Breast J. 2009;15:155–162. doi: 10.1111/j.1524-4741.2009.00690.x. [DOI] [PubMed] [Google Scholar]
- 14.Gilpin CA, Carson N, Hunter AG. A preliminary validation of a family history assessment form to select women at risk for breast or ovarian cancer for referral to a genetics center Clin. Genet. 2000;58:299–308. doi: 10.1034/j.1399-0004.2000.580408.x. [DOI] [PubMed] [Google Scholar]
- 15.Parmigiani G, Chen S, Iversen ES, et al. Validity of models for predicting BRCA1 and BRCA2 mutations. Ann Intern Med. 2007;147:441–450. doi: 10.7326/0003-4819-147-7-200710020-00002. [DOI] [PMC free article] [PubMed] [Google Scholar]
- 16.Chen S, Wang W, Lee S, et al. Prediction of germline mutations and cancer risk in the Lynch syndrome. J Am Med Assoc. 2006;296:1479–1487. doi: 10.1001/jama.296.12.1479. [DOI] [PMC free article] [PubMed] [Google Scholar]
- 17.Pencina MJ, D’Agostino RB, D’Agostino RB, Vasan RS. Evaluating the added predictive ability of a new marker: from area under the ROC curve to reclassification and beyond. Stat Med. 2008;27:157–172. doi: 10.1002/sim.2929. [DOI] [PubMed] [Google Scholar]
- 18.Efron B, Tibshirani R. An Introduction to the Bootstrap. Chapman and Hall/CRC; 1994. [Google Scholar]
- 19.Parmigiani G. Modeling in Medical Decision Making: A Bayesian Approach. Wiley; 2002. [Google Scholar]