

Abstract
Cigarette smoke is composed of over 4000 chemicals many of which are strong oxidizing agents and chemical carcinogens. Chronic cigarette smoke exposure (CSE) induces mild alterations in liver histology indicative of toxicity though the molecular pathways underlying these alterations remain to be explored. Utilizing a mouse model of ‘active’ developmental CSE (gestational day (GD) 1 through postnatal day (PD) 21; cotinine > 50 ng/mL) characterized by low birth weight offspring, the impact of developmental CSE on liver protein abundances was determined. On PD21, liver tissue was collected from pups for 2D SDS-PAGE based proteome analysis with statistical analysis by Partial Least Squares-Discriminant Analysis (PLS-DA). Protein spots of interest were identified by ESI-MS/MS with impacted molecular pathways identified by Ingenuity Pathway Analysis. Developmental CSE decreased the abundance of proteins associated with the small molecule biochemistry (includes glucose metabolism), lipid metabolism, amino acid metabolism, and inflammatory response pathways. Decreased gluconeogenic enzyme activity and lysophosphatidylcholine availability following developmental CSE were found and supports the impact of CSE on these pathways. Proteins with increased abundance belonged to the cell death and drug metabolism networks. Liver antioxidant enzyme abundances [Glutathione-S-Transferase (GST) and Peroxiredoxins] were also altered by CSE, but GST enzymatic activity was unchanged. In summary, cigarette smoke exposure spanning pre- and post-natal development resulted in persistent decreased offspring weights, decreased abundances of liver metabolic proteins, decreased gluconeogenic activity, and altered lipid metabolism. The companion paper details the kidney proteome alterations in the same offspring.
Keywords: developmental cigarette smoke exposure, CSE, proteome, liver
1. INTRODUCTION
Maternal behavior and nutrition are key determinants of offspring health. According to the Center for Disease Control and Prevention, approximately one in five women will smoke at some time during pregnancy (Centers for Disease Control and Prevention, 2001). Maternal cigarette smoke exposure during gestation is associated with a host of congenital defects and negative outcomes in children including Sudden Infant Death Syndrome, intrauterine growth restriction (IUGR), childhood asthma, and cognitive deficits (Centers for Disease Control and Prevention, 2010; U.S. Department of Health and Human Services, 2006).
Cigarette smoke contains over 4,000 chemical compounds which are present in mainstream and sidestream smoke (American Lung Association, 2010). Nicotine, carbon monoxide, heavy metals (lead, arsenic, and cadmium) and polycyclic aromatic hydrocarbons such as benzo(a)pyrene are present in cigarette smoke—many of which are known human carcinogens (National Toxicology Program, 2005). The toxins in cigarette smoke generally have high water solubility and low molecular weight that allows non-facilitated transfer across the placenta to the fetus (Zdravkovic et al., 2005). Rapidly proliferating fetal/neonatal tissues are highly sensitive to harmful agents including the many chemicals contained in cigarette smoke (Tomatis, 1989). The liver is a primary site of exogenous compound detoxification and possesses a high metabolic capacity (Maton et al., 1993). In a murine model of cigarette smoke exposure (CSE; high dose passive exposure model utilizing 2R1 reference cigarettes), mild liver toxicity was noted (Izzotti et al., 2003).
The present study focused on the impact of developmental CSE on liver proteome expression profiles. A model of active CSE was utilized that exposed C57BL/6 mice for 6 hrs/day and 7 days/week from gestation day (GD) 1 through postnatal day (PD) 21 to Marlboro cigarettes, the most common brand of cigarettes smoked by young women (U.S. Department of Health and Human Services, 2010). CSE induced intrauterine growth retardation with the persistence of decreased pup weights throughout the postnatal exposure window. A narrower objective of this study was to examine whether developmental CSE induced alterations in the abundance of liver metabolic proteins.
2. MATERIALS AND METHODS
2.1. Animals
Adult C57BL/6J mice were purchased from Jackson Labs (Bar Harbor, ME). Animals were housed and maintained in the University of Louisville Research Resources Center, an Association for Assessment and Accreditation of Laboratory Animal Care accredited facility. Animals were maintained in a controlled temperature/humidity environment with a 12 hour light/dark cycle and free access to Purina LabDiet 5015 and water. Adult male and nulliparous female C57BL/6J mice were housed together overnight. Gestational day (GD) 0 was counted as the presence of a seminal plug, indicative of mating, on the following morning.
2.2. Murine Cigarette Smoke Exposure Model
Dams were randomly assigned to either the SHAM or cigarette smoke exposure (CSE) group. A Teague TE-10C whole body cigarette smoke inhalation exposure system (Teague Enterprises; Davis, CA, (Teague et al., 1994) – a microprocessor controlled instrument that produces mainstream and/or sidestream smoke –was used to generate and deliver cigarette smoke. Cigarette smoke was generated from Philip Morris Marlboro Red brand cigarettes™ (Philip Morris; Richmond, VA; 15mg of tar/cigarette; 1.1mg nicotine/cigarette; additives), selected since it represents the most popular brand of cigarettes consumed among 18–25 year olds - the age group containing the majority of maternal smokers (Substance Abuse and Mental Health Services Administration, National Household Survey on Drug Abuse, 1999). Cigarettes were smoked using the standard Federal Trade Commission method: a two second, 35 cm3 puff, once a minute for a total of 9 min (Teague et al., 1994). For quality control purposes, paired exposure chambers (one receiving cigarette smoke and one receiving ambient air [Sham]) were characterized twice during each daily exposure session for: total suspended particulates (TSP), temperature, carbon monoxide levels, and humidity. Animals were exposed to cigarette smoke (CSE) or filtered ambient air (Sham) for 6hr/day from GD1 to PD21. Litters were not culled to generate uniform litter size. Chamber conditions including total suspended particulates (TSP), carbon monoxide levels, humidity, and temperature were measured twice daily. On PD21, pups were euthanized by asphyxiation with carbon dioxide followed by thoracotomy and cardiac puncture. Tissues were harvested and stored at −80°C until analysis.
2.3. 2D-SDS-PAGE
Liver tissue (~ 0.05 g tissue wet weight; 10 Sham and 8 CSE liver samples from a single male pup per litter) was homogenized in 0.5 ml sample preparation buffer [7M urea, 2M thiourea, 40mM dithiothreitol (DTT)] and stored at −80°C for a short time until analysis. Protein concentration for each of the samples was determined using the Bradford Assay (Bradford, 1976). Four hundred micrograms of protein in rehydration buffer (8M urea, 2% CHAPS, 2 μl IPG buffer pH 3–10, 2.5 mg/ml DTT, 0.002% bromophenol blue) was applied to IPGphor Drystrips (Nonlinear, 3–11, 180 mm × 3 mm × 0.5 mm, GE Healthcare, Piscataway, NJ). First dimension separation by isoelectric focusing at 22,000 Volt hours (Vhrs) was performed with a hold at 100 Volts until further processing. The IEF strips were stored at −80°C for 1 hr followed by: 1) equilibration for 30 minutes in reducing buffer (6M urea, 75 mM Tris-HCl pH 8.8, 29.3% glycerol, 2% SDS, 0.002% bromophenol blue with 3.5 mg/ml DTT) and 2) equilibration in alkylating buffer (same buffer with 45 mg/ml iodoacetamide instead of DTT) for an additional 30 minutes. Second dimension SDS-PAGE separation (25cm x 20.5cm 15% polyacrylamide gels) was performed overnight (18 hrs; 100V). Protein spots were visualized by Colloidal Coomassie Blue G-250 (3 day staining) followed by water washes until a clear background was evident.
2.3. Image Analysis
Gels were scanned using an Epson Expression 10000 XL scanner with transparency attachment. Densitometric analysis of gel images was performed with Progenesis SameSpots software (Nonlinear Dynamics; New Castle-on-Tyne, UK). Protein spots were detected automatically and manually adjusted where necessary for accuracy. For each protein spot, intensity was measured, background subtracted, and individual spot density normalized by total pixel density of each gel. Spots with average normalized pixel depth ≤100 relative abundance units and non-normalized areas with pixel depth below 100 were removed as noise. The averaged normalized spot abundance was compared between groups to determine fold differences in abundance.
2.4. Mass Spectrometry-Based Protein Spot Identification
Protein spots were excised and destained with 50% ethanol in 50 mM NH4HCO3 for a minimum of 5 washes. Excised gel spots were then dehydrated in acetonitrile (ACN), dried, and rehydrated with 10 ng/μl trypsin and 40mM NH4HCO3. Proteins were digested at room temperature for approximately 18 hrs. Peptides were eluted in 50% ACN/5% formic acid followed by 95% ACN/5% formic acid and stored at −20°C until analysis. The mass to charge ratio of peptides was determined by direct inject LTQ/FT-ICR-MS/MS (or HPLC interface) with collision induced dissociation for structural feature identification. Peptide identification was performed with the Mascot (Matrix Sciences v 2.2.2) search algorithm utilizing the NCBInr (with decoy) database (updated June 1, 2010). Search parameters included: mammalian class, 2 missed cleavages, carbamidomethyl C variable modification, enzyme trypsin/P, and an allowed peptide charge of 1+, 2+, or 3+. Positive protein identification required a total MOWSE absolute probability entire protein score ≥100 composed of a minimum of two peptides with individual scores MOWSE absolute probability scores ≥50 (Neuhoff et al., 1985; Pappin et al., 1993).
2.5. Statistical Analysis
Data were analyzed using PASW Statistics 18 software. The data for pup weight and litter weight were compared between treatment groups (SHAM and CSE) for from PD7-PD21 (ANOVA). A paired-samples t-test was used to test significance of the average growth across the postnatal days. Analysis of Variance (ANOVA) was used for statistical analysis of protein spot intensities with ρ<0.05 considered statistically significant and ρ<0.10 considered a trend. Partial Least Squares-Discriminant Analysis (PLS-DA) modeling of variance between groups with Variable Importance in Projection (VIP) rankings was used to identify protein spot features whose normalized abundance determined the differences between groups (Karp et al., 2005). Sequential removal of top ranked protein spots was performed until the variance between groups was eliminated. Due to the number of gels per group (n=10 for SHAM group and n=8 for CSE group without technical replicates), the dataset was not split into a test and validation set.
2.6. Ingenuity Pathway Analysis (IPA)
Ingenuity Pathway Analysis was used to determine families of proteins and metabolic pathways of the proteins that were identified (Ingenuity Systems, 2010). The Ingenuity Pathway Analysis (IPA) “Core Analysis” function is an algorithm used to identify interaction networks. IPA does not show a direct connection between groups of proteins of interest; however, IPA identifies significant pathways associated with the altered proteins. IPA uses its own language, which does not correlate with other programs used in protein and gene identification (Jimenez-Marin et al., 2009).
2.7. Glutathione-S-Transferase (GST) Assay
Liver GST activity was measured as an indicator of detoxification activity (Boyland and Chasseaud, 1969). The total GST activity of the liver was measured using the enzyme driven conjugation of 1-chloro-2,4-dinitrobenzene (CDNB) to reduced glutathione (absorbance read at 340 nm each minute for 15 minutes; Cayman Chemical Company). The absorbance per minute was divided by amount of protein (mg) to determine the specific activity for each sample (Jakoby, 1978).
2.8. Fructose 1,6-Bisphosphatase (F1,6-BPase) Activity Assay
A spectrophotometric enzymatic assay developed by Gancedo and Gancedo (1971) was used to determine if F1,6-BPase activity was compromised in the liver of CSE offspring. Fructose 1,6-bisohphatase activity in liver tissue was determined by measuring the rate of NADP conversion to NADPH at 340 nm. The test mixture was made of 50nM imidazole/HCl at a pH of 7, 0.1 M KCl, 10 mM MgCl2, 1 MM EDTA, 0.1 mM Fructose 1,6-bisphophatase, 0.25 mM NADP, 0.5 units of glucose phosphate isomerase, and 0.5 units of glucose-6-phosphate dehydrogenase. Liver homogenates (~200 μg protein) were added to start the reaction. The absorbance was read at 340 nm once a minute for a total of 5 minutes. The change in absorbance per minute was divided by amount of protein (mg) used to determine specific activity for each sample (Jakoby, 1978).
2.9. Pyruvate Carboxylase Activity Assay
A reaction solution (Payne and Morris, 1969) containing the following components was made: 1.0 M Tris/HCl pH=8, 0.5 NaHCO3, 0.1 M MgCl2, 1.0 mM Acetyl CoA, 0.1 M Pyruvate, 0.1 M ATP, 0.0039 g DTNB in 1.0 mL ethanol, and 1000 units per mL of citrate synthase. Liver homogenates (~200 μg protein) were added to the wells to start the reaction. Absorbance was read at 412 nm for a total of 5 minutes. The change in absorbance per minute was divided by amount of protein (mg) to determine specific activity for each sample (Jakoby, 1978).
2.10. Serum Metabolome Profiles
Serum (10 μL) was extracted with 100 μL of ice cold methanol. The mixture was vortexed for 30 seconds, incubated on ice for 1hr, followed by centrifugation at 4 ºC for 20 minutes. The clear supernatant was separated into several aliquots and speedvaced to dryness for storage. Following reconstitution and acidification with methanol and 0.1% formic acid, 10μL of this solution was introduced via direct chip-based nanoelectrospray (Advion TriVersa Nanomate) into a Thermo Electron LTQ-FT-ICR-MS (7 Tesla). The sample spray characteristics in positive ion mode were stable for greater than 10 minutes with an ion current between 10–90 nA, 2.1 kV spray voltage, and 0.05 psi head pressure. A spectral range of 50–1000 m/z was recorded for 0.5 min with 100,000 resolution. The raw spectra were processed with background noise filtered prior to peak detection and shaping, spectra deisotoping, and removal of blank peaks. Isotopic clusters were identified using an mass/charge (m/z) tolerance of 0.0010 Da, minimum/maximum charge 1, and first allowed gap at position 3. The isotopic clustered peaks were excluded from analysis. Since the sample solution was prepared under acidic condition, proton adducts were considered. Analysis of variance (ANOVA) tests were performed.
The proton adducts of all possible lysophosphatidylcholines (LysoPC) were listed with varying numbers of double bonds added. The saturated fatty acid chains from 3 carbons LysoPC(3:0) to 30 carbons Lyso(30:0) were included with between 1 to 14 double bonds listed as possible (252 possible LysoPCs). The monoisotopic masses of these LysoPCs were calculated and compared with the mass list from our experimental spectra. The masses within 5ppm error were treated as masses of interest that perhaps contained LysoPCs.
The identification of the lipid content in the masses of interest were conducted in two steps. The accurate masses of interest were searched with Human Metabolome Database (HMDB) and Lipid MAPS for preliminary identification (proton adduct only, within 5 ppm error). The results were combined and the preliminary redundant identifications were deleted. The mass features of interest were subjected to MS/MS fragmentation for confirmation of the preliminary identifications. Samples (10 μL) were re-injected and an Nth order double play method was utilized. The two scan events included were: 1) FT scan of 50–1000 m/z with 100,000 resolution, and 2) MS/MS analysis with CID (35 keV). Dynamic exclusion was enabled with mass window of 1.5 Da and exclusion duration of 600s.
In the current study, a putative phosphatidylcholine was positively identified if a fragment of m/z=184 was found (phosphocholine ion). Though in the literature, the neutral lost of 183 and 59 are usually used to identified the adduct of the PCs, the M+H-183 peak was shown in the mass spectra with similar intensities (Han et al., 1996). In our study, m/z=184 and a neutral loss of M+H-183 (neutral loss of the phosphocholine headgroup) and/or M+H-59 [neutral loss of trimethylamine N(CH3)3] were found for the same PC (e.g.: PCs with m/z=784.5865 and 758.5715). Neutral lost of M+H-183 and/or M+H-59 also confirmed the PC identification. Fragmentation ions of 104 and 86 further confirm LysoPC (Lee et al., 2009).
3. RESULTS
3.1. Exposure Conditions and Outcomes
The inhalation exposure chamber conditions and outcomes of the SHAM and CSE groups are reported in Table 1. Mean CO and TSP levels in the cigarette smoke exposure chamber (averaged across exposure period spanning GD1-PD21) were 138 ± 19.8 ppm and 25.4 ± 6.5 mg/m3, respectively (SHAM ≤ detection limit). Serum cotinine levels on PD21 (end of exposure) of dams from the CSE group were 89.7 ± 37.3 ng/ml and less than the limit of detection (4 ng/ml) in the SHAM group. CSE offspring cotinine levels (PD21) were 244.3 ± 123.4 ng/ml while cotinine was not detected in the Sham offspring. Dam weights, number of pups, viability, and sex ratio were not impacted by CSE. At parturition, litters were maintained without culling or fostering.
Table 1. Exposure Conditions and Outcomes.
Mean Carbon Monoxide and Total Suspended Particulates were calculated from measures taken twice daily from GD1-PD21. Cotinine levels were determined by tail vein sampling of the dam and offspring within 1 hour of cessation of exposure on PD21.
| Outcome/Condition | SHAM | CSE |
|---|---|---|
| Carbon Monoxide (ppm) | 0 | 138 ± 19.8* |
| TSP (mg/m3) | 0 | 25.4 ± 6.5* |
| Dam Cotinine (ng/mL) | <4 | 89.7 ± 37.3* |
| Pup Cotinine (ng/mL) | <4 | 244.3 ± 132.4* |
p < 0.05.
At birth, CSE offspring were significantly smaller as in our prior study (Esposito et al., 2008), with the persistence of reduced weights throughout the postnatal exposure period (p-value <0.05; Figure 1) though dam body weight was not impacted. For each litter, average pup weight was calculated (25 Sham and 20 CSE litters). The slope of the growth plot was similar between the offspring of the SHAM and CSE groups with a weight deficit of 13.2% evident on PD21. A single liver sample per litter from representative litters (10 Sham and 8 CSE) was utilized for proteome profiling.
Figure 1. Developmental CSE Decreased Offspring Weight.
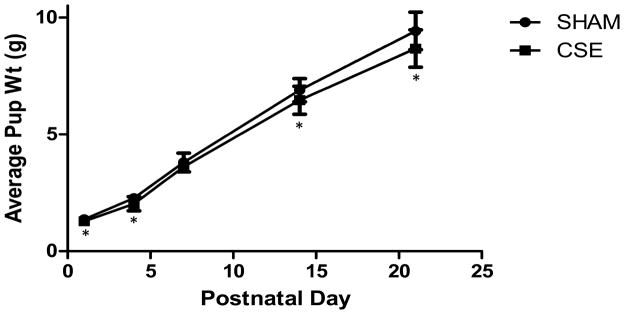
CSE offspring weights were lower than SHAM offspring weights on PD1; reduced CSE offspring weights persisted throughout exposure (weaning on PD21). For each litter, average pup weight was calculated (n= 25 Sham and 20 CSE litters).
*p-value ≤ 0.05 for individual postnatal days.
3.2. Liver Proteome Profiles
As shown in Figure 2, the liver protein spot patterns from 2D-SDS-PAGE gels were similar between groups. The protein spots spanned an isoelectric focusing range of 3 to 11, with the acidic proteins on the left side of the gel image, the basic proteins on the right, and molecular weights descending from ~140 kDa to ~10 kDa. Several proteins spots were identified to validate the molecular weight ranges. The liver protein spot patterns of gels from the SHAM and CSE groups were similar without the presence/absence of spots between groups. Varying pixel depths (spot abundances) were found as the dominant difference between groups.
Figure 2. Representative 2D-SDS-PAGE Gels of Liver Proteins from SHAM and CSE Offspring.
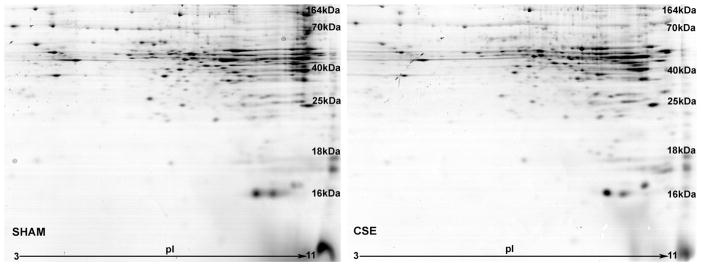
A side-by-side comparison of liver protein spot separation based on isoelectric focusing point (horizontal) and molecular weight (vertical) in the two experimental groups (SHAM-left; CSE-right). The gels are similar in number of spots without the appearance or loss of spots between groups.
3.3. Partial Least Squares-Discriminant Analysis
A ranked order of importance (Variable Import in Projection: VIP) of protein spot densities was utilized in defining the differences between groups after building a multivariate inverse least squares discriminant model to classify sample groupings. Noise, identified by a sharp increase in slope of 3-D plot of spot pixel density or an aggregate normalized pixel depth of less than 1000, was removed from the dataset prior to PLS-DA modeling. Iterative PLS-DA models were generated encompassing normalized spot abundances of all proteins not determined to be noise with recursive feature elimination used to identify protein spots contributing to the separation of groups. When abundances of all protein spots were included, the first latent factor described approximately 88% of variance between groups with the second latent factor describing an additional 9% of variance. The 50 highest VIP scored protein spots (340 protein spots contributed to the separation of groups) were identified.
3.4. Gluconeogenic Enzyme Abundance and Activity
In Figure 3, a 2D-SDS-PAGE protein spot map is shown with color coded numbers labeling the top 50 ranked proteins with altered normalized abundances that contribute to the separation of groups as determined by PLS-DA (decreased in blue; increased in red; unchanged in black). The proteins identified as present in these spots are listed in Table 2 (decreased and increased abundance). Of particular interest to the current study, decreased abundance of enzymes of the gluconeogenesis pathway was found (Fructose 1, 6-Bisphosphatase and Pyruvate Carboxylase). Fructose 1,6-bisphosphatase is responsible for the reversal of the rate limiting step of glycolysis and is a control point in gluconeogenesis (Eschrich and Herzog, 2002). Pyruvate Carboxylase mediates the conversion of pyruvate to oxaloacetate, the first step of gluconeogenesis. As shown in Figure 4, there is a trend towards decreased Fructose 1,6-Bisphophatase (p=0.06) and Pyruvate Carboxylase (p=0.08) enzymatic activity in liver of CSE offspring.
Figure 3. Liver proteome profiles were altered by developmental CSE.

The proteins with altered abundance following CSE that contributed to the separation of the groups in the PLS-DA model are circled and numbered (increased/decreased/unaltered). Refer to Table 2 for protein identifications.
Table 2. Protein Indetifications of Spots With Altered Abundance Between Groups as Determined by PLS-DA modeling.
Numbers in blue indicate proteins that had decreased abundance, numbers in red indicate proteins that had increased abundance, and black numbers indicate proteins that were unaltered. Corresponds to Figure 4. The 2-tailed ANOVA p-value is given but not utilized for ranking of proteins of interest.
| Spot | ANOVA | VIP | Protein Identification | Score |
|---|---|---|---|---|
| Increased Abundance | ||||
| 1 | 0.003 | 3.07 | Galactose mutarotase [Mus musculus] gi|28892785 | 186 |
| Transaldolase [Mus musculus] gi|1553119 | 140 | |||
| Timm50 protein [Mus musculus] gi|16307513 | 122 | |||
| 2 | 0.004 | 3.12 | Fructose-1,6-bisphosphatase [Mus musculus] gi|6688750 | 134 |
| 3 | 0.008 | 2.84 | Peroxiredoxin 1 [Mus musculus] gi|6754976 | 113 |
| 4 | 0.011 | 2.37 | Carbamoyl-phosphate synthetase 1 [Mus musculus] gi|124248512 | 990 |
| Eukaryotic translation elongation factor 2 [Mus musculus] gi|600159 | 563 | |||
| 7 | 0.033 | 2.32 | Aldh1l1 protein [Mus musculus] gi|23271467 | 1267 |
| 12 | 0.073 | 2.09 | 3-hydroxyisobutyrate dehydrogenase precursor [Mus musculus] gi|21704140 | 400 |
| 13 | 0.076 | 1.86 | Indolethylamine N-methyltransferase [Mus musculus] gi|6678281 | 328 |
| 45 | 0.007 | 2.49 | Pyruvate carboxylase [Mus musculus] gi|6679237 | 438 |
| Carbamoyl-phosphate synthetase 1 [Mus musculus] gi|124248512 | 361 | |||
| 47 | 0.035 | 2.4 | Aldh1l1 protein [Mus musculus] gi|23271467 | 517 |
| Carbamoyl-phosphate synthetase 1 [Mus musculus] gi|124248512 | 482 | |||
| Sarcosine dehydrogenase [Mus musculus] gi|20149748 | 467 | |||
| 48 | 0.103 | 2.33 | Carbamoyl-phosphate synthetase 1 [Mus musculus] gi|124248512 | 255 |
| Serine--pyruvate aminotransferase, mitochondrial [Mus musculus] gi|10720292 | 181 | |||
| 49 | 0.043 | 2.29 | Alcohol dehydrogenase 1 (class I) [Mus musculus] gi|6724311 | 425 |
| 50 | 0.06 | 2.28 | Aldolase B, fructose-bisphosphate [Mus musculus] gi|21450291 | 435 |
| Acetyl-Coenzyme A acetyltransferase 3 [Mus musculus] gi|110625948 | 284 | |||
| Alpha-methylacyl-CoA racemase [Mus musculus] gi|2145186 | 152 | |||
| Gamma-actin [Mus musculus] gi|809561 | 170 | |||
| 52 | 0.042 | 2.14 | Glutamate oxaloacetate transaminase 1, soluble [Mus musculus] gi|160298209 | 488 |
| Heat shock protein 9 [Mus musculus] gi|162461907 | 195 | |||
| 53 | 0.113 | 2.13 | S-adenosyl-L-homocysteine hydrolase gi|21431841 | 487 |
| 4-hydroxyphenylpyruvate dioxygenase [Mus musculus] gi|849053 | 400 | |||
| Cystathionase [Mus musculus] gi|22122387 | 325 | |||
| Medium-chain acyl-CoA dehydrogenase [Mus musculus] gi|6680618 | 299 | |||
| Acetyl-Coenzyme A acetyltransferase 1 precursor [Mus musculus] gi|21450129 | 273 | |||
| Isocitrate dehydrogenase [NADP] cytoplasmic [Mus musculus] gi|6647554 | 265 | |||
| Acetyl-Coenzyme A acyltransferase 2 (mitochondrial 3-oxoacyl-Coenzyme A thiolase) [Mus musculus] gi|29126205 | 239 | |||
| 55 | 0.007 | 1.99 | Carbamoyl-phosphate synthetase 1 [Mus musculus] gi|124248512 | 285 |
| 56 | 0.122 | 1.95 | Acetyl-Coenzyme A acetyltransferase 1 precursor [Mus musculus] gi|21450129 | 346 |
| 58 | 0.119 | 1.87 | Aldehyde dehydrogenase 7 family, member A1 isoform b [Mus musculus] gi|188035915 | 394 |
| 59 | 0.145 | 1.87 | Nicotinate phosphoribosyltransferase domain containing 1 [Mus musculus] gi|31982089 | 328 |
| Mitochondrial aldehyde dehydrogenase 2 [Mus musculus] gi|6753036 | 263 | |||
| Aldehyde dehydrogenase 1B1 [Mus musculus] gi|21312260 | 186 | |||
| Electron-transferring-flavoprotein dehydrogenase [Mus musculus] gi|21313290 | 225 | |||
| 60 | 0.163 | 1.84 | Carbamoyl-phosphate synthetase 1 [Mus musculus] gi|124248512 | 900 |
| Sdha protein [Mus musculus] gi|15030102 | 195 | |||
| 63 | 0.08 | 1.8 | Pyruvate carboxylase [Mus musculus]gi|6679237 | 497 |
| Echs1 protein [Mus musculus] gi|12805413 | 399 | |||
| 65 | 0.125 | 1.78 | Serine hydroxymethyltransferase 1 (soluble) [Mus musculus] gi|12845885 | 370 |
| Alanine-glyoxylate aminotransferase 2 [Mus musculus]gi|73661178 | 335 | |||
| Homogentisate 1, 2-dioxygenase [Mus musculus] | 317 | |||
| Branched chain keto acid dehydrogenase E1 beta [Mus musculus ]gi|40353220 | 144 | |||
| 67 | 0.244 | 1.7 | NADPH-dependent retinol dehydrogenase/reductase [Mus musculus] gi|11559414 | 314 |
| C1-tetrahydrofolate synthase [Mus musculus] gi|19850913 | 143 | |||
| 68 | 0.301 | 1.69 | 4-nitrophenylphosphatase domain and non-neuronal SNAP25-like protein homolog 1 [Mus musculus] gi|6679066 | 238 |
| Glutathione S-transferase, alpha 3 [Mus musculus] gi|31981724 | 246 | |||
| 69 | 0.204 | 1.66 | Unidentified | - |
| 71 | 0.17 | 1.65 | Carbamoyl-phosphate synthetase 1 [Mus musculus] gi|124248512 | 1549 |
| Aldh1l1 protein [Mus musculus] gi|23271467 | 158 | |||
| 72 | 0.299 | 1.64 | 4-hydroxyphenylpyruvate dioxygenase [Mus musculus] gi|849053 | 320 |
| 73 | 0.313 | 1.63 | Aldh1l1 protein [Mus musculus] gi|23271467 | 623 |
| 74 | 0.107 | 1.63 | Unnamed protein product [Mus musculus] gi|26337367 | 204 |
| Decreased Abundance | ||||
| 5 | 0.011 | 3.06 | RBL-DNP kinase 18kDa subunit (p18) [Mus musculus] gi|206580 | 334 |
| 6 | 0.013 | 2.82 | Chain A, Crystal Structure Of Glutathione Transferase Zeta 1-1 (Maleylacetoacetate Isomerase) [Mus Musculus] gi|88192700 | 197 |
| 8 | 0.036 | 2.32 | Peroxiredoxin 6 [Mus musculus] gi|3219774 | 362 |
| 9 | 0.044 | 2.07 | Tropomyosin 3, gamma [Mus musculus] gi|40254525 | 359 |
| 11 | 0.07 | 2.16 | Mercaptopyruvate sulfurtransferase [Mus musculus] gi|63100260 | 232 |
| Electron transferring flavoprotein, alpha polypeptide [Mus musculus] gi|13097375 | 217 | |||
| 14 | 0.079 | 2.04 | Sorbitol dehydrogenase precursor [Mus musculus domesticus] gi|1009706 | 234 |
| Sorbitol dehydrogenase [Mus musculus domesticus] gi|22128627 | 106 | |||
| 16 | 0.101 | 1.97 | Glutathione S-transferase mu 1 [Mus musculus] gi|6754084 | 261 |
| 43 | 0.006 | 3.13 | mCG17595, isoform CRA_a [Mus musculus] gi|148672065 | 210 |
| 44 | 0.029 | 2.62 | Unidentified | - |
| 46 | 0.075 | 2.48 | Peptidylprolyl isomerase A [Mus musculus] gi|6679439 | 252 |
| 51 | 0.066 | 2.14 | Long-chain-fatty-acid--CoA ligase 1 [Mus musculus] gi|729927 | 567 |
| 54 | 0.051 | 2.13 | Not Identified | |
| 57 | 0.168 | 1.9 | Calreticulin [Mus musculus] gi|6680836 | 213 |
| 61 | 0.126 | 1.83 | Aldh1l1 protein [Mus musculus] gi|23271467 | 309 |
| Electron transferring flavoprotein, beta polypeptide [Mus musculus] gi|12832367 | 225 | |||
| 62 | 0.188 | 1.83 | Carbamoyl-phosphate synthetase 1 [Mus musculus] gi|124248512 | 548 |
| 64 | 0.149 | 1.78 | HMG CoA synthase [Mus musculus] gi|555835 | 608 |
| 66 | 0.003 | 1.72 | Aldh1l1 protein [Mus musculus] gi|23271467 | 282 |
| 70 | 0.079 | 1.66 | Regucalcin [Mus musculus] gi|6677739 | 282 |
| Unaltered | ||||
| 17 | - | - | Calreticulin [Mus musculus] gi|6680836 | 178 |
| 18 | - | - | Tumor rejection antigen gp96 [Mus musculus] gi|6755863 | 484 |
| 19 | - | - | Prolyl 4-hydroxylase, beta polypeptide [Mus musculus] gi|129729 | 276 |
| 20 | - | - | Regucalcin [Mus musculus] gi|6677739 | 349 |
| 21 | - | - | Unidentified | - |
| 22 | - | - | Heat shock protein 70 cognate [Mus musculus] gi|309319 | 312 |
| - | - | Albumin [Mus musculus] gi|163310765 | 272 | |
| 23 | - | - | Sarcosine dehydrogenase [Mus musculus] gi|20149748 | 343 |
| 24 | - | - | Mitochondrial aldehyde dehydrogenase 2 [Mus musculus] gi|6753036 | 363 |
| 25 | - | - | Hemoglobin, beta adult major chain [Mus musculus] gi|31982300 | 317 |
| - | - | Hemoglobin beta [Mus musculus] gi|229301 | 291 | |
| 26 | - | - | Glutamate dehydrogenase 1 [Mus musculus] gi|6680027 | 316 |
| 27 | - | - | Unidentified | - |
| 28 | - | - | Cytosolic malate dehydrogenase [Mus musculus] gi|387129 | 122 |
| 29 | - | - | Unidentified | - |
| 30 | - | - | Unidentified | - |
| 31 | - | - | Unidentified | - |
| 32 | - | - | Unidentified | - |
| 33 | - | - | Hemoglobin subunit alpha [Mus musculus] gi|122441 | 164 |
| 34 | - | - | 78 kDa glucose-regulated protein [Mus musculus] gi|2506545 | 687 |
| 35 | - | - | Tubulin, alpha 1B [Mus musculus] gi|34740335 | 270 |
| 36 | - | - | Phenylalanine-4-hydroxylase [Mus musculus] gi|129974 | 206 |
| 37 | - | - | Methionine adenosyltransferase I, alpha [Mus musculus] gi|19526790 | 472 |
| 38 | - | - | Chain A, Rat Liver S-Adenosylhomocystein Hydrolase gi|4139571 | 481 |
| 39 | - | - | HMG CoA synthase[Mus musculus] gi|555835 | 276 |
| 40 | - | - | Glutamate dehydrogenase 1 [Mus musculus] gi|6680027 | 492 |
| 41 | - | - | Argininosuccinate synthetase 1 [Mus musculus] gi|6996911 | 232 |
| 42 | - | - | Glutathione S-transferase, alpha 3 [Mus musculus] gi|193703 | 156 |
Figure 4. Enzyme Activity Assays.

Developmental CSE resulted in altered liver protein abundances for several GST isoforms in liver without a concurrent impact on GST activity. Decreased liver Fructose 1,6-Bisphosphatase (F1,6-BPase) and Pyruvate Carboxylase protein abundances following developmental CSE were matched with a trend towards decreased F1,6-BPase and Pyruvate Carboxylase activity.
ap=0.06
bp=0.08
3.5. Antioxidant Enzyme Abundance and Activity
Liver antioxidant protein isoform abundances were altered by CSE. GST α3 (Spot 68; Figure 5) was decreased in abundance with an additional GST α3 spot (Spot 42) unchanged in liver of CSE offspring. Spots identified as GST ζ and GST μ1 were increased in abundance. Similarly, Peroxiredoxin 1 was decreased in abundance and Peroxiredoxin 6 was increased in abundance in the CSE group. GST activity was unaltered by CSE (Figure 4).
Figure 5. Developmental CSE alters GST isoform protein abundance in liver.

Developmental CSE resulted in increased abundance in GST ζ (Spot 6) and GST μ1 (Spot 16), decreased abundance of GST α3 (Spot 68), and unaltered abundance of GST α3 spot (Spot 42).
3.6. Ingenuity Pathway Analysis
Ingenuity Pathway Analysis (IPA) software was used to identify interaction networks between groups of liver proteins altered by CSE (Figures 6 & 7). The shaded proteins within the networks are those identified as contributing to the difference between the SHAM and CSE groups with arrows denoting directionality of interaction. Solid lines indicate a direct interaction while dotted lines indicate an indirect interaction. Geometric shapes identify classes of proteins: cytokines (square), growth factors (dotted square), phosphatases (triangle), kinases (inverted triangle), ligand-dependent nuclear receptors (rectangle), G-protein coupled receptors (vertical rectangle), ion channels (dotted vertical rectangle), peptidases (horizontal diamond), enzymes (vertical diamond), transcription regulators (horizontal ellipse), transmembrane receptors (vertical ellipse), transporters (trapezoid), and other important molecules (circle).
Figure 6. The Amino Acid Metabolism, Small Molecule Biochemistry, and Cellular Morphology Pathway is impacted by developmental CSE.

Proteins identified as contributing to the separation of groups (CSE and Sham) are shadowed and connected to the network by arrows denoting directionality of impact. In the associated figure, solid lines indicated a direct interaction while dotted lines indicate an indirect interaction. Geometric shapes identify classes of proteins: phosphatases (triangle), kinases (inverted triangle), enzymes (vertical diamond), transcription regulators (horizontal ellipse), transporters (trapezoid), and other important molecules (circles).
Figure 7. The liver Lipid Metabolism, Small Molecule Biochemistry, and Amino Acid Metabolism Pathway is impacted by developmental CSE.

Proteins identified as contributing to the separation of groups (CSE and Sham) are shadowed and connected to the network by arrows denoting directionality of impact. All shadowed proteins were decreased in abundance.
Figure 6 depicts the impact of liver proteins altered by CSE on the amino acid metabolism, small molecule biochemistry and cellular morphology network with Hepatocyte Nuclear Factor 4α (HNF4α) and retinoic acid as central nodes of the network. The following protein spots were identified as feeding into/out-of the HNF4α node: Spot 1 (Galactose Mutarotase), Spot 2 (Fructose 1,6 Bisphosphatase), Spot 65 (Alanine-Glyoxylate Aminotransferase 2), Spot 67 (Methylene Tetrahydrofolate Dehydrogenase), Spot 50 (Gamma Actin, Alpha Methylacyl-CoA, Acetyl-CoA Transferase, Aldolase, Fructose Bisphosphate, and Acyl-CoA Dehydrogenase), Spot 72 (Hydroxyphenylpyruvate Dioxygenase), and Spot 73 (Aldehyde Dehydrogenase). The following protein spots were identified as feeding into/out-of the retinoic acid node: Spot 13 (Indolethylamine N-Methyltransferase), Spot 16 (Glutathione S-Transferase Mu), and Spot 65 (Alanine-Glyoxylate Aminotransferase 2) which is the protein connecting the HNF4α and retinoic acid nodes.
Figure 7 depicts the impact of liver proteins from CSE offspring with decreased abundance on the lipid metabolism, small molecule biochemistry, and amino acid metabolism network that contains Solute Carrier Family 2 (Facilitated Glucose Transporter Member 4) as the central node of the network. The following protein spots were identified as feeding into/out-of the central node: Spot 3 (Peroxiredoxin 1), Spot 13 (Indolethylamine N-Methyltransferase), Spot 50 (Gamma Actin, Alpha Methylacyl-CoA, Acetyl-CoA Transferase, Aldolase, Fructose Bisphosphate, and Acyl-CoA Dehydrogenase), Spot 52 (Heat Shock Protein), Spot 53 (Isocitrate Dehydrogenase), Spot 60 (Succinate Dehydrogenase Complex), Spot 67 (Methylene Tetrahydrofolate Dehydrogenase), and Spot 68 (4-Nitrophenylphosphatase Domain and Non-neuronal Snap 25 Like Protein). Though Spots 50 and 58 had multiple proteins identified as contributing to identification of impact of CSE on this pathway, six additional proteins from six separate spots were linked to this pathway in support of the finding that the lipid metabolism network and perhaps the facilitated Glucose Transporter Member 4 protein are impacted by developmental exposure to cigarette smoke. Figures 6 & 7 are connected by a retinoic acid node.
3.8 Serum Lysophosphatidylcholine (LysoPC) Analyses
Utilizing a global metabolomics workflow, 4 LysoPCs were found to be significantly decreased in serum from CSE offspring (Figure 8); LysoPC (18:2); LysoPC (18:1); LysoPC (20:5); and LysoPC (20:4). Five additional LysoPCs identified in the spectra were not altered by developmental CSE: LysoPC (16:0), LysoPC (18:3); LysoPC (18:0); LysoPC (20:3), and LysoPC 22:6) (data not shown). Though not directly indicative of Peroxiredoxin 6 activity inhibition, the decreased LysoPC availability supports the Ingenuity Pathway Analysis finding that liver lipid metabolism is impaired by developmental CSE.
Figure 8. Plot of the Intensities for the Serum Lysophosphatidylcholines Altered by Developmental CSE.

The observed m/z value corresponding to the identified LysoPC is given.
aLysoPC confirmed but might also include PE and/or other PCs
*p < 0.05
4. DISCUSSION
Maternal cigarette smoke exposure during pregnancy is detrimental to offspring health. Comparable to the current study, serum cotinine levels in excess of 50 ng/ml are typically classified as an ‘active’ smoking exposure paradigm (Koren et al.,1992). The mouse model of developmental CSE (GD1-PD21) employed in the present study exhibited low birth weight and sustained suppression of weight through weaning. The observed CSE-induced IUGR was previously linked to in utero exposure to cigarette smoke during the pre-implantation and peri-implantation periods of murine gestation (Esposito et al., 2008). We report that CSE throughout the pre- and post-natal development period that continues until weaning results in sustained decreases in offspring weights.
In a similar study of the impact of developmental passive cigarette smoke exposure (89% sidestream/11% mainstream; TSP 83 mg/m3; 2R1 reference cigarettes) on mouse fetal liver genotoxic damage, including DNA adduct formation and oxidative nucleotide damage, was observed with attendant alterations in gene transcription and expression (Izzotti et al., 2003). Specifically, 18 out of 50 genes differentially expressed in the fetal liver belonged to the xenobiotic metabolism pathway. Other genes impacted by CSE in the prior study included the following pathways/functional categories: stress response; protein repair, removal, and folding genes; cell cycle regulation; growth factors; and cytoskeletal proteins. Though the study was a passive cigarette smoke exposure model and had different exposure parameters (our study resulted in TSP of 25 mg/m3 derived from Marlboro Reds for 6 hours), similarities between the prior gene expression study and the current proteome study exist.
Genes encoding for isoforms of glutathione S-transferase, sulfur transferases, and heat shock proteins were found to be upregulated in passive cigarette smoke groups. Similarly, our study found altered protein abundance glutathione S-transferase isoforms (increased and decreased abundance), heat shock proteins (decreased abundance) and sulfur transferases (increased abundance). This is far from surprising as CSE has high levels of reactive oxygen species and free radicals (Valvanidis et al., 2009) that contribute to a state of oxidative stress leading to damage to proteins, lipids, and DNA (Comhair and Erzurum, 2002). Although the gene expression study of passive cigarette smoke exposure (Izzotti et al., 2003) does not detail effects on fetal phenotype, a similar study of developmental sidestream smoke exposure in mice by Esposito et al. (2008) resulted in intrauterine growth retardation.
Glucose homeostasis, maintained by the balance between liver gluconeogenesis and glycolysis (Benkovic and de Maine, 1982), is essential for cellular metabolic function and the production of ATP (Newsholme and Leech, 1985). Pyruvate Carboxylase converts pyruvate to oxaloacetate at the initiation of gluconeogenesis (Attwood et al., 1985) while the conversion of fructose-1,6-bisphosphate to fructose-6-phosphate by Fructose 1,6-Bisphosphatase is a rate limiting step in gluconeogenesis (Benkovic and de Maine, 1982). Developmental CSE decreased protein spot abundances of F1,6-BPase and Pyruvate Carboxylase in the liver. Similarly, a trend toward decreased gluconeogenic enzymatic activity in the liver of CSE offspring was found. Together, this indicates impaired gluconeogenesis in CSE offspring liver that may result in impaired growth and development of CSE offspring.
Ingenuity Pathway Analysis extends the probable impact of developmental CSE on liver function to include the amino acid metabolism, small molecule biochemistry, and cellular morphology network (numerous proteins with increased and decreased abundance in liver of the CSE group). HNF4α, a central node in this network, regulates genes that control lipid homeostasis (Hayhurst et al., 2001). The binding and activation of HNF4α is controlled by fatty acyl-CoA thio-esters with the binding process highly dependent on the degree of saturation and length of fatty acids (Hertz et al., 1998). The current study does not address whether actual HNF4α expression or activity is affected by developmental CSE--but the finding of altered serum lipid availability substantiates the impact of developmental CSE on liver lipid metabolism that would also impact HNF4α function.
The liver lipid metabolism, small molecule biochemistry, and amino acid metabolism pathway, which is an extension of the above pathway, was also identified by Ingenuity Pathway Analysis as impacted by developmental CSE. Peroxiredoxin 6, Acetyl Co-A acetyltransferase 1, and Aldehyde dehydrogenase 1 were protein spots (associated with the lipid metabolism pathway) identified to have decreased abundance in CSE offspring liver. Acetyl Co-A acetyltransferase 1 converts free cholesterol in cells into lipids by esterification and plays a prominent role in lipid synthesis and turnover (Rudel et al., 2005). Lack of Aldehyde dehydogrenase 1 results in reduction of retinol production (Deltour et al., 1999), which is essential for proper growth and development (Mendelsohn et al., 2004). Peroxiredoxin 6 has been shown to function as both an antioxidant and a phospholipase A2 with phosphatidylcholines as the primary target (Manevich et al., 2005; Chen et al., 2000). Inhibition of Peroxiredoxin phospholipase A2 activity results in degradation dipalmitoylphosphatidylcholine (DPPC), the primary component of lung surfactant (Manevich et al., 2005). Serum metabolomic analysis found a significant decrease in availability of 4 lysophosphatidylcholines in the CSE offspring thus supporting the supposition that liver lipid metabolism was altered by developmental CSE.
Facilitated Glucose Transporter Member 4 (GLUT4; also known as SLC2A4) is a central node in the above pathway. Facilitated Glucose Transporter Member 4 mediates the homeostatic transport of glucose from the blood into cell cytoplasm (Mueckler, 1994). Glucose is essential for metabolic function and the production of ATP (Newsholme and Leech, 1985). Coupled with the finding of decreased liver gluconeogenic activity, the availability of glucose appears to be compromised in the CSE offspring liver.
In summary, ‘active’ CSE from GD1-PD21 results in growth retardation throughout the exposure period. The observed decrease in newborn weight was sustained throughout postnatal exposure as the rate of weight gain was similar between the SHAM and CSE groups (slope of growth plots did not vary). Several liver metabolic networks are impacted in offspring exposed to cigarette smoke. These networks include lipid metabolism, glucose metabolism and cell death and inflammatory response networks. Serum metabolomic analysis confirmed alterations in lipid metabolism in CSE offspring. We interpret the findings of this study as an indication that continuing CSE on the background of low birth weight (LBW) leads to systemic metabolic dysregulation characterized by impaired chaperoning/antioxidant scavenging and lipid dysregulation as well as impaired glucose metabolism. The impact of CSE cannot be separated from LBW in the current model though the observed alterations may result in low birth weight by disrupting systemic glucose availability of exposed offspring. Future studies examining the continuity of impact on metabolic pathways post-cessation of exposure are of great interest in understanding the impact developmental CSE on long term offspring health.
Acknowledgments
Research described in this article was supported in part by PHS NIH P20 RR/DE-17702, PHS NIH P30 ES014443, PHS NIH R21 DA027466, and the University of Louisville School of Interdisciplinary Graduate Studies-Ethnic Minority Scholarship program. We thank the University of Louisville Center for Regulatory and Environmental Analytical Metabolomics, specifically Dr. Bogdan Bogdanov, for assistance with FT-ICR-MS. We thank Mr. Todd Birtles for the maintenance of the inhalation exposure system and for conducting daily animal exposures.
Footnotes
Publisher's Disclaimer: This is a PDF file of an unedited manuscript that has been accepted for publication. As a service to our customers we are providing this early version of the manuscript. The manuscript will undergo copyediting, typesetting, and review of the resulting proof before it is published in its final citable form. Please note that during the production process errors may be discovered which could affect the content, and all legal disclaimers that apply to the journal pertain.
References
- American Lung Association. [Accessed on May 13, 2010];Secondhand Smoke Fact Sheet. 2010 www.lungusa.org.
- Attwood PV, Keech DB. Pyruvate carboxylase. Curr Top Cell Regul. 1984;23:1–55. doi: 10.1016/b978-0-12-152823-2.50005-2. [DOI] [PubMed] [Google Scholar]
- Benkovic SJ, de Maine MM. Mechanism of action of fructose 1,6-bisphosphatase. Adv Enzymol Related Areas Mol Biol. 1982;53:45–82. doi: 10.1002/9780470122983.ch2. [DOI] [PubMed] [Google Scholar]
- Boyland E, Chasseaud LF. The role of glutathione and glutathione S-transferases in mercapturic acid biosynthesus. Adv Enzymol. 1969;32:173–219. doi: 10.1002/9780470122778.ch5. [DOI] [PubMed] [Google Scholar]
- Bradford M. Analytical Biochemistry. 1976;72:248. doi: 10.1016/0003-2697(76)90527-3. [DOI] [PubMed] [Google Scholar]
- Centers for Disease Control and Prevention. Surgeon General’s Report. U.S. Department of Health and Human Services Coordinating Center for Health Promotion National Center for Chronic Disease Prevention and Health Promotion Office of Smoking and Health; 2001. Women and smoking. [Google Scholar]
- Centers for Disease Control and Prevention. Reproduction and Birth Outcomes. Low Birth Weight and Growth Retardation in the Environment. 2010 Retrieved on May 12, 2010. [Google Scholar]
- Chen JW, Dodia C, Feinstein SI, Jain MK, Fisher AB. 1-Cys peroxiredoxin, a bifunctional enzyme with glutathione peroxidase and phospholipase A2 activities. J Biol Chem. 2000;275(37):28421–7. doi: 10.1074/jbc.M005073200. [DOI] [PubMed] [Google Scholar]
- Comhair SA, Erzurum SC. Antioxidant responses to oxidant-mediated lung disease. Am J Physiol Lung Cell Mol Physiol. 2002;283(2):L246–55. doi: 10.1152/ajplung.00491.2001. [DOI] [PubMed] [Google Scholar]
- Deltour L, Foglio MH, Duester G. Impaired retinol utilization in Adh4 alcohol dehydrogenase mutant mice. Dev Genet. 1999;25(1):1–10. doi: 10.1002/(SICI)1520-6408(1999)25:1<1::AID-DVG1>3.0.CO;2-W. [DOI] [PubMed] [Google Scholar]
- Eschrich K, Herzog B. Fructose-1,6-Bisphosphatase. Encyclopedia Of Molecular Medicine 2002 [Google Scholar]
- Esposito ER, Horn KH, Greene RM, Pisano MM. An animal model of cigarette smoke-induced in utero growth retardation. Toxicology. 2008;246:193–202. doi: 10.1016/j.tox.2008.01.014. [DOI] [PMC free article] [PubMed] [Google Scholar]
- Gancedo JM, Gancedo C. Fructose-1,6-Diphosphatase, Phosphofructokinase and Glucose-6-Phosphate Dehydrogenase from Fermenting and Non-Fermenting Yeasts. Arch Mikrobiol. 1971;76:132–138. doi: 10.1007/BF00411787. [DOI] [PubMed] [Google Scholar]
- Han X, Gubitosi-Klug RA, Collins BJ, Gross RW. Alterations in individual molecular species of human platelet phospholipids during thrombin stimulation: electrospray ionization mass spectrometry-facilitated identification of the boundary conditions for the magnitude and selectivity of thrombin-induced platelet phospholipid hydrolysis. Biochemistry. 1996;35(18):5822–32. doi: 10.1021/bi952927v. [DOI] [PubMed] [Google Scholar]
- Hayhurst GP, Lee Y, Lambert G, Ward JM, Gonzales FJ. Hepatocyte Nuclear Factor 4 α (Nuclear Receptor 2A1) Is Essential for Maintenance of Hepatic Gene Expression and Lipid Homeostasis. Molecular and Cellular Biology. 2001;21(4):1393–1403. doi: 10.1128/MCB.21.4.1393-1403.2001. [DOI] [PMC free article] [PubMed] [Google Scholar]
- Hertz R, Magenheim J, Berman I, Bar-Tana J. Fatty acyl-CoA thioesters are ligands of hepatic nuclear factor-4alpha. Nature. 1998;392:512–516. doi: 10.1038/33185. [DOI] [PubMed] [Google Scholar]
- Ingenuity Systems. [Accessed on October 27, 2010];Ingenuity Pathway Analysis: Overview. 2010 http://www.ingenuity.com/products/pathways_analysis.html.
- Izzotti A, Balansky RM, Cartiglia C, Camoirano A, Longobardi M, De Flora S. Genomic and transcriptional alterations in mouse fetus liver after transplacental exposure to cigarette smoke. The FASEB Journal. 2003;17(9):1127–9. doi: 10.1096/fj.02-0967fje. [DOI] [PubMed] [Google Scholar]
- Jakoby WB. The glutathione S-transferases: A group of multifunctional detoxification proteins. Adv Enzymol Relat Areas Mol Biol. 1978;46:383–414. doi: 10.1002/9780470122914.ch6. [DOI] [PubMed] [Google Scholar]
- Jimenez-Marin A, Collado-Romero M, Ramirez-Boo C, Garrido JJ. Biological pathway analysis by ArrayUnlock and Ingenuity Pathway Analysis. BMC Proceedings. 2009:1–6. doi: 10.1186/1753-6561-3-S4-S6. [DOI] [PMC free article] [PubMed] [Google Scholar]
- Karp NA, Griffin JL, Lilley KS. Application of partial least squares discriminant analysis to two-dimensional difference gel studies in expression proteomics. Proteomics. 2005;5:81–90. doi: 10.1002/pmic.200400881. [DOI] [PubMed] [Google Scholar]
- Koren G, Klein J, Forman R, Graham K, Phan MK. Biological markers of intrauterine exposure to cocaine and cigarette smoking. Dev Pharmacol Ther. 1992;18:228–236. [PubMed] [Google Scholar]
- Lee LH, Shui G, Farooqui AA, Wenk MR, Tan CH, Ong WY. Lipidomic analyses of the mouse brain after antidepressant treatment: evidence for endogenous release of long-chain fatty acids? Int J Neuropsychopharmacol. 2009;12(7):953–64. doi: 10.1017/S146114570900995X. [DOI] [PubMed] [Google Scholar]
- Manevich Y, Fisher A. Peroxiredoxin 6, a 1-Cys peroxiredoxin, functions in antioxidant defense and lung phospholipid metabolism. Free Radical biology & Medicine Vol. 2005;38:1422–1432. doi: 10.1016/j.freeradbiomed.2005.02.011. [DOI] [PubMed] [Google Scholar]
- Maton A, Hopkins J, McLaughlin CW, Johnson S, Warner MC, LaHart D, Wright JD. Human Biology and Health. Englewood Cliffs, New Jersey, USA: Prentice Hall; 1993. [Google Scholar]
- Mendelsohn C, Lohnes D, Decimo D, Lufkin T, LeMeur M, Chambon P, Mark M. Function of the retinoic acid receptors (RARs) during development (II). Multiple abnormalities at various stages of organogenesis in RAR double mutants. Development. 1994;120:2749–2771. doi: 10.1242/dev.120.10.2749. [DOI] [PubMed] [Google Scholar]
- Mueckler M. Facilitated Glucose Transporters. Eur J Biochem. 1994;219:713–725. doi: 10.1111/j.1432-1033.1994.tb18550.x. [DOI] [PubMed] [Google Scholar]
- National Toxicology Program. Report on Carcinogens. 11. U.S. Department of Health and Human Services, Public Health Service; 2005. [Google Scholar]
- Neuhoff V, Stamm R, Eibl H. Clear background and highly sensitive protein staining with Coomassie Blue dyes in polyacrylamide gels: a systematic analysis. Electrophoresis. 1985;6:427–448. [Google Scholar]
- Newsholme EA, Leech AR. Biochemistry for the Medical Sciences. John Wiley and Sons; Chichester: 1985. [Google Scholar]
- Pappin DJ, Hojrup P, Bleasby AJ. Rapid identification of proteins by peptide-mass fingerprinting. Curr Biol. 1993;3:327–32. doi: 10.1016/0960-9822(93)90195-t. [DOI] [PubMed] [Google Scholar]
- Payne J, Morris JG. Pyruvate carboxylase in Rhodopseudomonas spheroides. J Gen Microbiol. 1969;59:97–101. doi: 10.1099/00221287-59-1-97. [DOI] [PubMed] [Google Scholar]
- Rudel L, Lee RG, Parini P. ACAT2 is a Target for Treatment of Coronary Heart Disease Associated with Hypercholerolemia. Arteriosclerosis, Thrombosis, and Vascular Biology Vol. 2005;25:1112–1118. doi: 10.1161/01.ATV.0000166548.65753.1e. [DOI] [PubMed] [Google Scholar]
- Substance Abuse and Mental Health Services Administration. Office of Applied Studies. National Household Survey on Drug Abuse; 1999. [Google Scholar]
- Teague SV, Pinkerton KE, Goldsmith M, Gebremichael A, Chang S. Inhalation Toxicology. Taylor & Francis; 1994. Sidestream cigarette smoke generation and exposure system for environmental tobacco smoke studies. [Google Scholar]
- Tomatis L. Overview of perinatal and multigeneration carcinogenesis. In: Napapkov NP, Rice JM, Tomatis L, Yamasaki H, editors. Prenatal and Multigeneration Carcinogenesis. 96. International Agency for Research on Cancer Sci. Publ; Lyon France: 1989. pp. 1–15. [PubMed] [Google Scholar]
- U.S. Department of Health and Human Services. Office of the Surgeon General The Health Consequences of Involuntary Exposure to Tobacco Smoke: A Report of the Surgeon General. 2006. Retrieved on May 12, 2010. [Google Scholar]
- U.S. Department of Health Human Services. [Accessed on October 27, 2010];Tobacco Use in America: Ch 7: Tobacco Product Brand Preferences Office of Applied Studies. 2010 http://www.oas.samhsa.gov/nhsda/tobacco/chapter7.htm.
- Valvanidis A, Vlachogianni T, Fiotakis K. Tobacco Smoke: Involvement of Reactive Oxygen Species and Stable Free Radicals in Mechanisms of Oxidative Damage, Carcinogenesis and Synergistic Effects with Other Respirable Particles. Int J Environ Res Public Health. 2009;6:445–462. doi: 10.3390/ijerph6020445. [DOI] [PMC free article] [PubMed] [Google Scholar]
- Zdravkovic T, Genbacev O, McMaster MT, Fisher SJ. The adverse effects of maternal smoking on the human placenta: a review. Placenta. 2005;26:S81–S86. doi: 10.1016/j.placenta.2005.02.003. [DOI] [PubMed] [Google Scholar]