

Abstract
Considerable interest has been generated for the development of suitable corneal endothelial graft alternatives through cell-tissue engineering, which can potentially alleviate the shortage of corneal transplant material. The advent of less invasive suture-less key-hole surgery options such as Descemet’s Stripping Endothelial Keratoplasty (DSEK) and Descemet’s Membrane Endothelial Keratoplasty (DMEK), which involve transplantation of solely the endothelial layer instead of full thickness cornea, provide further impetus for the development of alternative endothelial grafts for clinical applications. A major challenge for this endeavor is the lack of specific markers for this cell type. To identify genes that reliably mark corneal endothelial cells (CECs) in vivo and in vitro, we performed RNA-sequencing on freshly isolated human CECs (from both young and old donors), CEC cultures, and corneal stroma. Gene expression of these corneal cell types was also compared to that of other human tissue types. Based on high throughput comparative gene expression analysis, we identified a panel of markers that are: i) highly expressed in CECs from both young donors and old donors; ii) expressed in CECs in vivo and in vitro; and iii) not expressed in corneal stroma keratocytes and the activated corneal stroma fibroblasts. These were SLC4A11, COL8A2 and CYYR1. The use of this panel of genes in combination reliably ascertains the identity of the CEC cell type.
Introduction
The human corneal endothelium (CE), comprised of a monolayer of hexagonal corneal endothelial cells (CECs) attached to a basement Descemet’s membrane (DM) composed of collagen, forms a selective barrier between the anterior chamber of the eye and the corneal stroma. CECs are the most metabolically active cells in the cornea expressing fluid pumps that actively move fluid from the stroma back into the anterior chamber of the eye. The dynamic balance between the “leaky” barrier and constant pump activity maintains corneal deturgescence, thereby keeping the cornea transparent. Corneal blindness is often due to endothelial dysfunction and is the second leading cause of visual impairment [1].
Human CECs have limited proliferative capacity within the eye [2], [3]. Hence, in order to replace dead or damaged CECs, existing cells spread out to maintain the functional integrity of the CE [4], [5]. In cases of severe cell loss due to genetic corneal endothelial dystrophy or trauma, decompensation of the CE may occur, reducing its capacity to pump fluid out of the stroma, resulting in stromal and epithelial edema, loss of corneal clarity and visual acuity, and eventually bullous keratopathy [1]. The conventional solution to restore vision is through cornea transplantation. However, there is a global shortage of transplant-grade donor cornea. This shortage is expected to worsen as the demand for corneal transplantation increases with an aging global population. Therefore, considerable interest has been generated for the development of suitable endothelial grafts through tissue engineering, which can potentially alleviate the shortage of corneal transplant material.
With the introduction of surgical procedures such as Descemet’s Stripping Endothelial Keratoplasty (DSEK) and Descemet’s Membrane Endothelial Keratoplasty (DMEK), less invasive, key-hole surgery options for the selective replacement of the CE layer are now possible [6], [7], [8]. The advent of such surgical procedures provides further impetus for the development of alternative endothelial grafts – either by means of ex vivo expansion of human CECs, or by de novo generation of CECs from pluripotent human embryonic stem cells, induced pluripotent stem cells or multipotent adult stem cells, which are unlimited sources of cells. However, a major obstacle to such endeavors is the lack of specific markers for CECs, resulting in an inability to definitively identify such putative stem cell-derived CECs.
Currently, the most commonly used markers in the characterization of cultivated CECs include ZO-1 [9], [10], a tight junction protein involved in signal transduction at cell-cell junctions, and Na+/K+-ATPase [11], an essential enzyme involved in the active transport of ions across the CE. Although the co-expression of both proteins indicates the presence of key components of CE fluid transport function, it is not a definite indication of the identity of CECs because both ZO-1 and Na+/K+-ATPase are ubiquitously expressed in many other cell types [12], [13], [14], [15].
This paper presents a thorough gene expression analysis of CECs and proposes a panel of markers that reliably identifies CECs in vivo and in vitro. We used RNA-sequencing (RNA-seq) [16] and High Throughput Quantitative Polymerase Chain Reaction (HT-PCR), together with various Bioinformatics platforms such as BioGPS (http://biogps.org), DAVID Functional Annotation Clustering Tool [17] and PANTHER Classification System [18], to select a panel of markers based on the following criteria:
Highly expressed in CECs from young and old donors:
Expressed in CECs in vivo, as well as in ex vivo CEC cultures;
Ideally not expressed in other cell types;
Not expressed in corneal stroma keratocytes or activated corneal stroma fibroblasts.
Results
To identify markers for CECs, global gene expression analysis of CECs stripped from donor cornea along with the Descemet’s membrane (CEC-DM) was carried out using RNA-seq [19]. Gene lists generated were analyzed using DAVID Functional Annotation Clustering Tool [17] and PANTHER Classification System [18] to identify over-represented ontology groups and molecular pathways.
Identification of Genes most Highly Expressed in CECs
Gene expressions of the following samples were analyzed using RNA-sequencing: 1) CEC-DM pooled from 5 young donors; 2) CEC-DM pooled from 5 old donors; 3) CEC cultures and 4) corneal stroma pooled from 5 young donors (Figure 1). Description of the isolation process can be found in Materials and Methods. Full dataset for the RNA-sequencing performed is found in Table S1.
Figure 1. The human corneal tissue, the isolated endothelium and the cultured corneal endothelial cells.

A. Corneal stroma with an intact Descemet’s membrane (DM), arrowed (left) and a corneal stromal without the DM layer (right). B. Peeled CEC-DM complex in a typical DM-roll, with the endothelium on the outside. C. Confluent culture of human CECs at the second passage. Scale bars: 100 µm.
The sequence depth ranged from 1.8 million to 4.6 million reads (Figure 2A). Hierarchical clustering showed that the young and old CEC-DMs cluster closest to each other, followed by CEC culture, and lastly the corneal stroma (Figure 2B). This indicates that the two CEC-DM samples are closer in gene expression than they are to the CEC culture, and that the corneal stroma sample has the greatest gene expression difference compared to the other 3 samples.
Figure 2. RNA-seq comparing gene expression of young and old CEC-DM, CEC culture and corneal stroma.
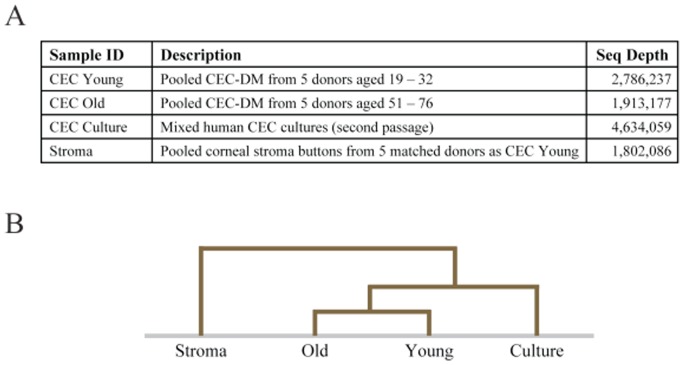
A. Sequencing depth (total uniquely mapping reads) of each sample. B. Hierarchical clustering shows that the young and old CECs cluster closer to each other, followed by CEC culture, and lastly the corneal stroma.
We first sought to identify the genes most highly expressed in the young CECs. The top 20 genes expressed in CECs include those that play a role in cellular metabolism (ENO1, GAPDH, CA3, LDHA, ALDOA, ATP5B, ATP5A1), and genes important for trans-membrane transport (SLC2A1, ATP5B, ATP1A1, ATP5A1) (Table 1). Some of these genes have also been previously identified to be highly expressed in CECs. CA3, PTGDS, LDHA, MGP, and C4orf49 have been identified by Sakai et al. [20], while ENO1, GAPDH, and PTGDS have been noted by Gottsh et al. [21] to be among the top 50 most highly expressed genes in CECs.
Table 1. List of top 20 most highly expressed genes in human corneal endothelium.
| Gene | Description | PreviouslyIdentified |
| ENO1 | Enzyme important for glycolysis; also functions as a structural lens protein. | Gottsch 2003 |
| GAPDH | Enzyme important for glycolysis. | Gottsch 2003 |
| CA3 | Enzyme important for cellular metabolism and carbon dioxide transport; reversible hydration of carbon dioxide. | Sakai 2002 |
| MYOC | Secreted glycoprotein expressed in trabecular meshwork and ciliary body; participates in regulating intraocular pressure. | |
| SLC2A1 | Facilitative glucose transporter. | |
| PTGDS | Synthesizes prostaglandin PGD2; PGD2 lowers intraocular pressure and triggers inflammatory effects on conjunctiva. | Sakai 2002Gottsch 2003 |
| IER3 | Protects cells from Fas- or tumor necrosis factor type alpha-induced apoptosis. | |
| VIM | Organizer proteins involved in attachment, migration, signaling; mutations in this gene causes a dominant, pulverulent cataract. | |
| TPT1 | Calcium binding and microtubule stabilization. | |
| ATP5B | Mitochondrial membrane ATP synthase. | |
| LDHA | Enzyme important for glycolysis. | Sakai 2002 |
| TSPAN6 | Mediates signal transduction events; regulates cell development, activation, growth and motility. | |
| MGP | Associates with the organic matrix of bone and cartilage. Inhibitor of bone formation. Prevents calcification of the cornea. | Sakai 2002 |
| ALDOA | Enzyme important for glycolysis and gluconeogenesis. | |
| HERPUD1 | Component of the endoplasmic reticulum quality control (ERQC) system. | |
| C4orf49 | Corneal Endothelial Specific Protein 1. Expressed in corneal endothelium, corneal epithelium, cultured CECs, brain, testis, and ovary. | Sakai 2002 |
| RPL3 | Component of the large subunit of cytoplasmic ribosomes. | |
| UBC | Ubiquitin C. | |
| ATP1A1 | Na+/K+-ATPase responsible for establishing Na+ and K+ gradients essential for osmoregulation | |
| ATP5A1 | Mitochondrial membrane ATP synthase; produces ATP from ADP in the presence of a proton gradient across the membrane |
Information from description was taken from Genecards.org, unless otherwise specified.
Furthermore, analysis using the DAVID Functional Annotation Clustering Tool showed that the most over-represented ontological groups for the top 200 genes in young CECs are cellular metabolism, regulation of cell death, and membrane transport (Table 2). Taken together, these results describe a cell type that is metabolically active, and have a function in ion and water transport, corroborating with previous descriptions of CECs [1], [22].
Table 2. GO analysis using DAVID Functional Annotation (Subset: GOTERM_BP_FAT).
| Gene ontology term | % | Genes |
| Generation of precursor metabolites and energy | 28.6 | ALDOA, LDHA, ATP5B, ALDOC, PFKP, COX4I1, ATP5G3, TPI1, SLC25A3, GNAS, ATP5A1, PGK1, GAPDH, ENO1 |
| Response to organic substance | 18.4 | HSP90AB1,FOS,HERPUD1,GLUL,ALDOC, MGP,GNAS,ATP5G3,HSPA8 |
| Glycolysis, catabolic processes | 16.3 | ALDOA, TPI1, LDHA. ALDOC, PFKP, PGK1, GAPDH, ENO1 |
| Translation | 16.3 | NACA, RPL8, RPL3, UBC, EIF1, RPL11, RPS6, RPS8 |
| Translational elongation | 12.2 | RPL8, RPL3, UBC, RPL11, RPS6, RPS8 |
| Nitrogen compound biosynthetic process | 12.2 | ALDOA, GLUL, ATP5B, ATP1A1, ATP5A1, ATP5G3 |
| Cation transport | 12.2 | SLC4A11, ATP5B, TPT1, ATP1A1, ATP5A1, ATP5G3 |
| Homeostatic process | 12.2 | ALDOA, HERPUD1, SLC4A11, ATP5B, TPT1, RPS6 |
| ATP/nucleotide biosynthetic process | 10.2 | ALDOA, ATP5B, ATP1A1, ATP5A1, ATP5G3 |
| Monovalent inorganic cation transport | 10.2 | SLC4A11, ATP5B, ATP1A1, ATP5A1, ATP5G3 |
| Proton Transport | 8.2 | SLC4A11, ATP5B, ATP5A1, ATP5G3 |
| Response to protein stimulus | 8.2 | HSP90AB1, FOS, HERPUD1, HSPA8 |
| Organic aid biosynthetic process | 8.2 | TPI1, GLUL, PTGDS, SCD |
| Response to extracellular stimulus | 8.2 | FOS, LDHA, COZ4I1, MGP |
| Cation homeostasis | 8.2 | HERPUD1, SLC4A11, ATP5B, TPT1 |
| Fructose metabolic process | 6.1 | ALDOA, ALDOC, PFKP |
| ATP synthesis coupled proton transport, ion transmembrane transport | 6.1 | ATP5B, ATP5A1, ATP5G3 |
| Response to unfolded protein | 6.1 | HSP90AB1, HERPUD1, HSPA8 |
| Fatty acid biosynthetic process | 6.1 | TPI1, PTGDS, SCD |
| Oxidative phosphorylation | 6.1 | ATP5B, ATP5A1, ATP5G3 |
| Aging | 6.1 | FOS, ALDOC, ATP5G3 |
| One-carbon metabolic process | 6.1 | FOS, CA12, CA3 |
| Biosynthetic/metabolic processes | 4.1 | ATP5B, ATP5A1 |
| Protein homotetramerization | 4.1 | ALDOC, PFKP |
Top 200 genes with highest RPM value in young CEC-DM was analyzed in DAVID. GO terms that are over represented are ranked in descending order of percentage of genes representing this category. Related GO terms represented by the same set of genes were combined.
Analysis of Genes that have been Previously used as CEC Markers
We next examined the expression levels of commonly used CEC markers in our samples. Table 3 shows that most of the markers previously used by other groups are either not expressed in culture (reads per million (RPM) <10), do not differentiate between CECs and stroma (fold change of young/stroma <5), or lack specificity as catalogued in BioGPS. Of the genes listed, COL8A2 and SLC4A11 emerged from our study as the best candidates as markers for CECs, but these too are not ideal. Expression of COL8A2 is high in CECs and low in stroma, but is also present in the retina. SLC4A11 is highly expressed in CECs, not ubiquitously expressed in many cell types (data not shown), but is 6 times lower in expression in CEC cultures than in CEC-DM (Table 3). Therefore, we sought to probe for other candidates that could be used to identify CECs.
Table 3. Analysis of CEC markers used in other publications.
| RPM values | Fold change | Flaw | |||||||||
| Gene Symbol | CEC Young | CEC Old | CEC Culture | Corneal Stroma | Young/Old | Young/Culture | Young/Stroma | 1 | 2 | 3 | 4 |
| AQP1 | 233 | 172 | 4 | 506 | 1.35 | 54.0 | 0.5 | Y | Y | Y | |
| ATP1A1 | 2,616 | 1,627 | 858 | 368 | 1.61 | 3.1 | 7.1 | Y | |||
| CLCN2 | 13 | 0 | 1 | 4 | n/a | 11.6 | 2.8 | Y | Y | Y | |
| CLCN3 | 15 | 5 | 79 | 5 | 2.82 | 0.2 | 3.0 | Y | Y | Y | |
| COL8A2 | 1,821 | 1,743 | 859 | 107 | 1.04 | 2.1 | 17.0 | R | |||
| ENO2 | 495 | 247 | 57 | 104 | 2.0 | 8.7 | 4.8 | Y | Y | ||
| JAM1 | 0.80 | 0.50 | 3.70 | 86 | 1.60 | 0.22 | 0.01 | Y | Y | Y | Y |
| NCAD | 129 | 67 | 94 | 4 | 1.92 | 1.4 | 33.3 | Y | |||
| PTGDS | 5,547 | 6,415 | 183 | 2,522 | 0.86 | 30.2 | 2.2 | ? | Y | Y | |
| SLC4A11 | 2,313 | 2,940 | 366 | 90 | 0.79 | 6.3 | 25.7 | ? | |||
| SLC4A4 | 113 | 221 | 41 | 29 | 0.51 | 2.8 | 3.9 | Y | Y | ||
| VDAC2 | 248 | 135 | 134 | 172 | 1.83 | 1.9 | 1.4 | Y | Y | ||
| VDAC3 | 582 | 393 | 299 | 250 | 1.48 | 2.0 | 2.3 | Y | |||
| ZO-1 | 49 | 42 | 8 | 72 | 1.17 | 6.3 | 0.7 | Y | Y | Y | Y |
1: Not high in young CECs (RPM<100);
2: Not expressed in culture (RPM<10);
3: Does not differentiate between CEC and stroma (Young/stroma < 5);
4: Lack of specificity as assessed in BioGPS;
Y: Yes;
?: Not conclusive;
R: retina.
Identification of Genes Important for CEC Function and Physiology
To identify genes important for CEC physiology, genes that are highly expressed in CEC-DM and CEC cultures were selected and analyzed. The list was filtered for genes with RPM>10 in young CEC-DM, old CEC-DM and CEC culture, at least two times higher in young CECs than in corneal stroma, and less than 2-fold difference in expression between young and old CEC. The top 50 genes ranked in descending order of expression in young CEC-DM are shown in Table 4. Each gene was analyzed in BioGPS to obtain information on the expression of each gene across different tissues (data not shown). Genes that are not ubiquitously expressed were further analyzed using high-throughput QPCR to compare the expression of these selected genes in various human tissue types.
Table 4. List of top 50 highly expressed genes found in human corneal endothelium that are 2-fold higher in CECs than in stroma, and less than 2-fold difference between young and old corneal endothelium.
| RPM Values | Fold Changes | |||||
| Gene symbol | Young | Old | Culture | Stroma | Young/Stroma | Young/Old |
| ENO1 | 35,947 | 25,205 | 19,318 | 14,237 | 2.5 | 1.4 |
| GAPDH | 8,083 | 6,6498 | 6,598 | 2,401 | 3.4 | 1.2 |
| CA3 | 7,804 | 6,267 | 166 | 207 | 37.7 | 1.2 |
| MYOC | 6,780 | 10,193 | 8,272 | 915 | 7.4 | 0.7 |
| SLC2A1 | 5,598 | 4,593 | 3,491 | 1,921 | 2.9 | 1.2 |
| PTGDS | 5,547 | 6,416 | 184 | 2,522 | 2.2 | 0.9 |
| IER3 | 5,311 | 5,829 | 1,353 | 1,779 | 3.0 | 0.9 |
| ATP5B | 4,762 | 4,413 | 3,095 | 1,330 | 3.6 | 1.1 |
| TSPAN6 | 3,860 | 3,668 | 1,617 | 137 | 28.2 | 1.1 |
| MGP | 3,598 | 3,419 | 3,813 | 345 | 10.4 | 1.1 |
| ALDOA | 3,421 | 2,425 | 2,812 | 1,557 | 2.2 | 1.4 |
| HERPUD1 | 3,138 | 2,367 | 649 | 862 | 3.6 | 1.3 |
| ATP1A1 | 2,616 | 1,627 | 858 | 368 | 7.1 | 1.6 |
| ATP5A1 | 2,586 | 1,737 | 1,640 | 979 | 2.6 | 1.5 |
| GNAS | 2,574 | 2,550 | 2,112 | 1,165 | 2.2 | 1.0 |
| PGK1 | 2,469 | 2,878 | 2,239 | 906 | 2.7 | 0.9 |
| CA12 | 2,322 | 1,756 | 1,721 | 123 | 18.8 | 1.3 |
| SLC4A11 | 2,312 | 2,940 | 366 | 90 | 25.7 | 0.8 |
| COX4I1 | 2,265 | 2,232 | 1,011 | 815 | 2.8 | 1.0 |
| TSC22D1 | 2,070 | 2,038 | 2,978 | 865 | 2.4 | 1.0 |
| SCD | 1,928 | 1,108 | 252 | 54 | 35.8 | 1.7 |
| COL8A2 | 1,821 | 1,743 | 859 | 107 | 17.0 | 1.0 |
| PFKP | 1,577 | 1,220 | 433 | 158 | 10.0 | 1.3 |
| ADM | 1,287 | 1,712 | 314 | 491 | 2.6 | 0.8 |
| NDUFB8 | 1,167 | 997 | 664 | 553 | 2.1 | 1.2 |
| SFRP1 | 1,134 | 1,592 | 38 | 125 | 9.0 | 0.7 |
| EIF3K | 1,070 | 1,292 | 648 | 385 | 2.8 | 0.8 |
| RPL15 | 1,063 | 1,033 | 674 | 451 | 2.4 | 1.0 |
| GHITM | 1,042 | 1,081 | 747 | 224 | 4.6 | 1.0 |
| C5orf62 | 970 | 971 | 472 | 57 | 17.1 | 1.0 |
| AKR1C1 | 953 | 729 | 678 | 180 | 5.3 | 1.3 |
| AKR1B1 | 892 | 777 | 988 | 229 | 3.9 | 1.1 |
| LAMB1 | 890 | 825 | 753 | 73 | 12.2 | 1.1 |
| ID3 | 834 | 1,744 | 1,337 | 133 | 6.3 | 0.5 |
| TUBA4A | 831 | 934 | 191 | 390 | 2.1 | 0.9 |
| TUFM | 767 | 561 | 496 | 302 | 2.5 | 1.4 |
| CD83 | 750 | 678 | 72 | 81 | 9.3 | 1.1 |
| SULF2 | 749 | 470 | 791 | 29 | 25.5 | 1.6 |
| NPC2 | 744 | 488 | 1,963 | 366 | 2.0 | 1.5 |
| TMEM66 | 632 | 517 | 844 | 321 | 2.0 | 1.2 |
| MIF | 628 | 773 | 450 | 314 | 2.0 | 0.8 |
| RGS5 | 608 | 930 | 139 | 22 | 27.4 | 0.7 |
| C6orf48 | 603 | 589 | 652 | 290 | 2.1 | 1.0 |
| NDUFB9 | 589 | 869 | 405 | 234 | 2.5 | 0.7 |
| NDUFB10 | 583 | 323 | 235 | 98 | 6.0 | 1.8 |
| VDAC3 | 582 | 393 | 299 | 250 | 2.3 | 1.5 |
| P4HA2 | 572 | 231 | 603 | 104 | 5.5 | 2.0 |
| ITGB5 | 571 | 613 | 1,333 | 137 | 4.2 | 0.9 |
| NDUFV1 | 570 | 554 | 104 | 77 | 7.4 | 1.0 |
| GRHPR | 569 | 667 | 768 | 123 | 4.6 | 0.9 |
| ANKH | 569 | 444 | 687 | 123 | 4.6 | 1.3 |
Genes are ranked in descending order of RPM values of young CEC-DM. RPM values are rounded off to the nearest integer, and fold change values are rounded off to the nearest decimal place.
QPCR results show that ATP5B is expressed in all the tissue types tested. SLC2A1, ENO1, and COL8A2 are highly expressed in CEC cultures and CEC-DM but are also expressed in many other tissue types, albeit at lower levels. MYOC and SLC4A11 on the other hand are highly expressed in CEC cultures and CEC-DM but not in other tissue types (Figure 3).
Figure 3. High-throughput QPCR analysis of genes expressed in both CEC-DM and CEC cultures.

BM: bone marrow; IVS: interventricular septum; SG: salivary gland; SM: skeletal muscle; SI: small intestine; SC: spinal cord; U/C: uterus/cervix; FB: fetal brain; FL: fetal liver; SF: stromal fibroblast; CC: CEC culture; CEC-DM-y: CEC-DM young; CEC-DM-o: CEC-DM-old.
Interestingly, the expression of CA3, PTGDS, IER3 and SFRP1 were high in both young and old CEC-DM, but were lost in CEC cultures, indicating that the expression of these genes are not necessary for CEC survival in vitro. While they could be useful for identifying CECs in vivo, they should not be used as CEC markers in experiments involving CEC cultures. On the other hand, MGP is expressed much higher in CEC cultures than in CEC-DM and other tissue types (Figure 4).
Figure 4. High-throughput QPCR analysis of genes differentially expressed in CEC-DM and CEC cultures.

BM:bone marrow; IVS:interventricular septum; SG: salivary gland; SM: skeletal muscle; SI: small intestine; SC: spinal cord; U/C:uterus/cervix; FB:fetal brain; FL:fetal liver; SF:stromal fibroblast; CC:CEC culture; CEC-DM-y:CEC-DM young; CEC-DM-o:CEC-DM-old.
Taken together, the results above suggest that SLC4A11 and COL8A2 are suitable markers for CECs based on their high expression in CEC-DM and CEC-cultures compared to other cell types. MYOC is not an ideal choice because it is expressed in the trabecular meshwork where it participates in the obstruction of fluid outflow.
Identifying Genes that are Expressed in CECs but not in Corneal Stroma
There was a trace amount of SLC4A11 and COL8A2 in corneal stroma keratocytes and/or its activated stromal fibroblasts (Figure 3). Therefore, we sought to identify other genes that were not expressed or lowly expressed in corneal stroma. We selected genes that have RPM value of less than 1 in corneal stroma but more than 10 in the other 3 samples (Table 5). Each gene was analyzed in BioGPS (data not shown). Genes that are not ubiquitously expressed were chosen for further analyses.
Table 5. Genes not expressed in the corneal stroma.
| RPM Values | ||||
| Gene Symbol | CEC Young | CEC Old | CEC Culture | Corneal Stroma |
| OLFML1 | 96.55 | 69.52 | 19.64 | 0.55 |
| CYYR1 | 94.39 | 15.68 | 10.14 | 0.00 |
| HEMK1 | 91.52 | 71.61 | 41.86 | 0.55 |
| ACAD8 | 90.09 | 26.66 | 25.90 | 0.55 |
| ATRN | 75.01 | 58.54 | 48.34 | 0.55 |
| GNAZ | 70.70 | 70.56 | 27.84 | 0.55 |
| HIPK1 | 70.70 | 12.02 | 17.05 | 0.00 |
| FBP1 | 60.66 | 65.34 | 31.07 | 0.55 |
| LARS | 59.58 | 26.66 | 18.99 | 0.55 |
| GSTZ1 | 53.84 | 47.56 | 71.64 | 0.00 |
| NUP54 | 51.32 | 10.98 | 10.57 | 0.55 |
| UBA5 | 50.96 | 35.54 | 13.38 | 0.55 |
| UBR7 | 50.25 | 35.02 | 58.70 | 0.55 |
| KIAA1549 | 47.02 | 36.59 | 12.08 | 0.55 |
| SRGAP2 | 46.30 | 17.25 | 29.13 | 0.00 |
| NUAK1 | 45.22 | 15.16 | 26.76 | 0.55 |
| ZFPL1 | 43.79 | 49.13 | 90.85 | 0.55 |
| UPRT | 43.07 | 28.23 | 15.11 | 0.55 |
| KIF3C | 42.71 | 12.54 | 11.01 | 0.55 |
| UPRT | 42.35 | 28.23 | 15.11 | 0.55 |
Gene list is filtered for RPM>10 for CEC Young, CEC Old and CEC Culture, and RPM<1 for corneal stroma. Genes are ranked in descending order of RPM values of CEC Young. All values are rounded off to 2 decimal places.
High throughput QPCR was first performed using Fluidigm Biomark system to compare expression of these genes across different human tissue types. Results show that of all the genes analyzed, CYYR1 was the only gene that was expressed in CEC-DM and CEC cultures, but not expressed in corneal stroma and stroma fibroblast cultures (Figure 5).
Figure 5. High-throughput QPCR analysis of genes lowly or not expressed in corneal stroma.

BM: bone marrow; IVS: interventricular septum; SG: salivary gland; SM: skeletal muscle; SI: small intestine; SC: spinal cord; U/C: uterus/cervix; FB: fetal brain; FL: fetal liver; SF: stromal fibroblast; CC: CEC culture; CEC-DM-y: CEC-DM young; CEC-DM-o: CEC-DM-old.
Confirming the Stability of Expression of SLC4A11, COL8A2 and CYYR1 across Multiple Biological Samples
QPCR analysis was performed using a 7500 Fast Real Time PCR machine to compare the expression of SLC4A11, COL8A2, and CYYR1 in CECs and corneal stroma from 3 individual donors. Expression of CYYR1 was similar in all three donors (average ± standard deviation: 495±54), while that of SLC4A11 and COL8A2 varied slightly (average ± standard deviation: 318±181 and 126±57 respectively). On average, expression of SLC4A11 was 84-fold higher in CECs than in stroma (p<0.05), while expression of COL8A2 and CYYR1 was 16-fold higher in CECs than in corneal stroma (p<0.05 and p<0.01 respectively). Expression of all three genes was negligible in stromal fibroblast cultures obtained from 2 individual donors (Figure 6). Taken together, the combination of SLC4A11, COL8A2 and CYYR1 present a useful panel of genes to differentiate between CECs and corneal stroma/stroma fibroblast.
Figure 6. QPCR validation of gene expression in CEC-DM andcorneal stroma (keratocytes) from 3 individual donors, corneal stromal fibroblast cultures from 2 individual donors and CEC culture.

CEC: CEC-DM; stroma: corneal stroma (keratocytes); SF: stromal fibroblast. Student’s t-tests (two-tailed assuming non-equal variance): One asterisk indicates p<0.05; two asterisks indicate p<0.01.
Gaining Insight into CEC Physiology from Gene Expression
The transparency of the cornea is predominantly attributed to the ion and fluid transport capacity of CECs. We were therefore interested to examine the expression of transporters in CECs (Table S2). Genes that are classified as transporters under the PANTHER classification system were extracted. The gene list was filtered for RPM>10 in young CEC-DM, old CEC-DM and CEC culture, at least two times higher in young CECs than in corneal stroma, and less than 2-fold difference in expression between young and old CEC. Table 6 shows the list of transporters that fit these criteria, ranked in descending order of expression in young CECs.
Table 6. Expression of transporter-associated genes found in corneal endothelium, cultured corneal endothelial cells and corneal stroma.
| RPM Values | Fold Changes | |||||
| Gene symbol | Young | Old | Culture | Stroma | Young/Stroma | Young/Old |
| SLC2A1 | 5598 | 4593 | 3491 | 1921 | 2.9 | 1.2 |
| ATP5B | 4762 | 4413 | 3095 | 1330 | 3.6 | 1.1 |
| ATP1A1 | 2616 | 1627 | 858 | 368 | 7.1 | 1.6 |
| ATP5A1 | 2586 | 1737 | 1640 | 979 | 2.6 | 1.5 |
| SLC4A11 | 2313 | 2940 | 366 | 90 | 25.7 | 0.8 |
| SLC25A4 | 540 | 536 | 396 | 116 | 4.7 | 1.0 |
| ATP6V1E1 | 402 | 403 | 479 | 188 | 2.1 | 1.0 |
| PCOLCE | 397 | 601 | 317 | 42 | 9.4 | 0.7 |
| ATP5G1 | 236 | 279 | 189 | 113 | 2.1 | 0.8 |
| SLC22A4 | 231 | 143 | 35 | 5 | 46.3 | 1.6 |
| SORT1 | 216 | 237 | 214 | 8 | 27.8 | 0.9 |
| SLC15A4 | 195 | 358 | 104 | 43 | 4.6 | 0.5 |
| SVEP1 | 182 | 257 | 390 | 11 | 16.4 | 0.7 |
| ATP5J | 162 | 141 | 129 | 23 | 6.9 | 1.2 |
| SLC25A11 | 132 | 85 | 152 | 23 | 5.8 | 1.6 |
| TAP1 | 128 | 192 | 126 | 6 | 20.9 | 0.7 |
| ATP6V0D1 | 126 | 113 | 245 | 62 | 2.0 | 1.1 |
| SLC4A4 | 113 | 221 | 41 | 29 | 3.9 | 0.5 |
| ATP6V1D | 109 | 161 | 374 | 43 | 2.5 | 0.7 |
| SLC35E1 | 107 | 71 | 63 | 11 | 9.6 | 1.5 |
| PAPPA | 79 | 97 | 89 | 4 | 20.2 | 0.8 |
| SLC2A3 | 73 | 77 | 18 | 32 | 2.3 | 0.9 |
| LRPPRC | 64 | 54 | 37 | 5 | 12.9 | 1.2 |
| SLC 25A13 | 59 | 103 | 16 | 12 | 5.1 | 0.6 |
| SLC39A6 | 59 | 83 | 27 | 14 | 4.1 | 0.7 |
| TM9SF2 | 55 | 30 | 28 | 19 | 2.8 | 1.8 |
| COX11 | 55 | 94 | 44 | 24 | 2.2 | 0.6 |
| VPS33B | 52 | 63 | 33 | 4 | 13.4 | 0.8 |
| TM9SF1 | 51 | 29 | 191 | 4 | 13.1 | 1.7 |
| SEC61A2 | 45 | 87 | 15 | 2 | 20.1 | 0.5 |
| SLC5A3 | 43 | 40 | 22 | 13 | 3.3 | 1.1 |
| SLC16A2 | 38 | 58 | 304 | 11 | 3.6 | 0.6 |
| PITPNM1 | 36 | 46 | 33 | 1 | 32.7 | 0.8 |
| ABCF3 | 36 | 36 | 60 | 14 | 2.6 | 1.0 |
| TOM1L2 | 34 | 24 | 26 | 4 | 7.7 | 1.4 |
| SLC26A11 | 33 | 28 | 12 | 1 | 30.1 | 1.2 |
| SLC35B3 | 29 | 36 | 113 | 2 | 17.2 | 0.8 |
| SLC16A3 | 28 | 38 | 86 | 4 | 6.3 | 0.7 |
| SLC4A2 | 27 | 51 | 85 | 6 | 4.8 | 0.5 |
| CACNB3 | 27 | 40 | 41 | 1 | 47.9 | 0.7 |
| AP3D1 | 24 | 32 | 114 | 3 | 7.2 | 0.7 |
| IPO9 | 22 | 11 | 77 | 6 | 3.5 | 1.9 |
| SLC45A1 | 18 | 16 | 13 | 1 | 16.5 | 1.1 |
Transporters expressed in CECs that are at least 2 times higher in young CEC-DM than in stroma, and less than 2 fold difference in expression between young and old CEC-DM. Genes are ranked in descending order of RPM values of young CEC-DM. RPM values are rounded off to the nearest integer, and fold change values are rounded off to the nearest decimal place.
The high throughput gene expression analyses performed can also be used to further understand the signaling pathways that govern CEC physiology. To achieve this aim, we looked at the expression of cytokine receptors (Table S3) and transcription factors (Table S4) in CECs. Genes that are classified as cytokine receptors or transcription factors under the PANTHER classification system were extracted. The gene lists were filtered for RPM>10 in young CEC-DM, old CEC-DM and CEC culture, at least two times higher in young CECs than in corneal stroma, and less than 2-fold difference in expression between young and old CEC. Only 3 cytokine receptors pass the selection criteria (Table 7). Table 8 shows a similar list of transcription factors expressed in CECs.
Table 7. Gene expression of cytokine receptors found in corneal endothelium, cultured corneal endothelial cells and corneal stroma.
| RPM Values | Fold Changes | |||||
| Gene symbol | Young | Old | Culture | Stroma | Young/Stroma | Young/Old |
| TGFBR3 | 135 | 130 | 11 | 44 | 3.1 | 1.0 |
| IL13RA1 | 78 | 95 | 50 | 16 | 4.8 | 0.8 |
| IL6ST | 43 | 76 | 25 | 9 | 4.5 | 0.6 |
Cytokine receptors expressed in CECs that are at least 2 times higher in young CEC-DM than in stroma, and less than 2 fold difference in expression between young and old CECs. Genes are ranked in descending order of RPM values of young CEC-DM. RPM values are rounded off to the nearest integer, and fold change values are rounded off to the nearest decimal place.
Table 8. Gene expression of transcription factors found in corneal endothelium, cultured corneal endothelial cells and corneal stroma.
| RPM Values | Fold Changes | |||||
| Gene symbol | Young | Old | Culture | Stroma | Young/Stroma | Young/Old |
| KLF10 | 566 | 719 | 80 | 195 | 2.9 | 0.8 |
| SNURF | 539 | 272 | 547 | 235 | 2.3 | 2.0 |
| PER1 | 300 | 192 | 57 | 93 | 3.2 | 1.6 |
| ILF2 | 290 | 435 | 379 | 62 | 4.7 | 0.7 |
| MAFF | 289 | 297 | 36 | 119 | 2.4 | 1.0 |
| PITX2 | 288 | 567 | 377 | 11 | 27.3 | 0.5 |
| TFAP2B | 277 | 244 | 110 | 5 | 45.5 | 0.9 |
| SF1 | 184 | 244 | 115 | 32 | 5.8 | 0.5 |
| SMAD3 | 180 | 275 | 55 | 38 | 4.7 | 0.7 |
| ERG | 127 | 102 | 64 | 24 | 5.3 | 1.2 |
| STAT1 | 125 | 212 | 166 | 57 | 2.2 | 0.6 |
| SMYD3 | 122 | 109 | 78 | 2 | 55 | 1.1 |
| TCEB3 | 118 | 93 | 99 | 6 | 21.3 | 1.3 |
| EPAS1 | 118 | 156 | 90 | 49 | 2.4 | 0.8 |
| CAND1 | 118 | 183 | 85 | 49 | 2.4 | 0.6 |
| CAND1 | 118 | 183 | 85 | 49 | 2.4 | 0.6 |
| REPIN1 | 113 | 64 | 103 | 12 | 9.7 | 1.8 |
| NFKBIZ | 107 | 110 | 17 | 52 | 2.0 | 1.0 |
| KBTBD4 | 103 | 64 | 71 | 12 | 8.4 | 1.6 |
| L3MBTL2 | 102 | 71 | 23 | 37 | 2.7 | 1.4 |
| TCEB2 | 100 | 128 | 95 | 42 | 2.4 | 0.8 |
| POLR3H | 95 | 53 | 132 | 35 | 2.7 | 1.8 |
| KLF9 | 89 | 141 | 47 | 19 | 4.7 | 0.6 |
| GTF2IRD1 | 81 | 51 | 23 | 1 | 72.8 | 1.6 |
| COPS5 | 77 | 88 | 365 | 33 | 2.3 | 0.9 |
| RXRB | 75 | 93 | 50 | 8 | 9.1 | 0.8 |
| ZNF3 | 71 | 84 | 26 | 10 | 7.1 | 0.8 |
| ZNF143 | 67 | 72 | 49 | 31 | 2.2 | 0.9 |
| YAP1 | 66 | 67 | 35 | 6 | 10.8 | 1.0 |
| ING1 | 65 | 96 | 25 | 2 | 29.4 | 0.7 |
| ZBTB47 | 65 | 36 | 25 | 1 | 58.5 | 1.8 |
| ZKSCAN5 | 63 | 34 | 22 | 2 | 28.5 | 1.8 |
| FOXC1 | 60 | 113 | 24 | 9 | 6.7 | 0.5 |
| ZNF664 | 59 | 50 | 53 | 28 | 2.1 | 1.2 |
| ZMYM4 | 58 | 61 | 19 | 2 | 34.9 | 1.0 |
| SPRYD4 | 57 | 36 | 47 | 11 | 5.1 | 1.6 |
| TCEAL8 | 57 | 54 | 58 | 13 | 4.4 | 1.0 |
| ZFHX4 | 56 | 81 | 44 | 2 | 33.4 | 0.7 |
| E2F4 | 55 | 35 | 35 | 27 | 2.1 | 1.6 |
| RUVBL2 | 55 | 95 | 153 | 5 | 10.9 | 0.6 |
| LMX1B | 54 | 38 | 57 | 2 | 24.4 | 1.4 |
| TARDBP | 52 | 34 | 44 | 8 | 6.3 | 1.5 |
| TBPL1 | 51 | 54 | 18 | 2 | 30.6 | 0.9 |
| GZF1 | 48 | 75 | 60 | 3 | 14.3 | 0.6 |
| ZFPL1 | 44 | 49 | 91 | 1 | 78.9 | 0.9 |
| HCFC2 | 37 | 61 | 16 | 2 | 22 | 0.6 |
| ZMAT3 | 36 | 22 | 33 | 8 | 4.6 | 1.6 |
| PCGF3 | 35 | 41 | 13 | 4 | 9.0 | 0.8 |
| RBX1 | 34 | 18 | 49 | 14 | 2.4 | 1.9 |
| STAT2 | 33 | 57 | 102 | 8 | 4.2 | 0.6 |
| CTBP2 | 32 | 39 | 38 | 3 | 11.6 | 0.8 |
| ZNF862 | 31 | 22 | 11 | 2 | 13.7 | 1.4 |
| QRICH1 | 30 | 30 | 11 | 1 | 54.3 | 1.0 |
| CREM | 27 | 52 | 56 | 3 | 9.7 | 0.5 |
| EGFL6 | 23 | 32 | 29 | 1 | 21 | 0.7 |
| RNF14 | 23 | 25 | 19 | 4 | 6.0 | 0.9 |
| RBL2 | 23 | 38 | 19 | 4 | 6.0 | 0.6 |
| NFYC | 22 | 33 | 13 | 5 | 4.4 | 0.7 |
| CREB3L4 | 20 | 19 | 47 | 1 | 36.9 | 1.1 |
| CTBP1 | 20 | 10 | 17 | 3 | 6.0 | 1.9 |
| MAF | 20 | 21 | 12 | 6 | 3.2 | 0.9 |
| NFYA | 19 | 14 | 13 | 1 | 34.3 | 1.4 |
| ZNF740 | 16 | 25 | 24 | 2 | 7.1 | 0.6 |
Transcription factors expressed in CECs that are at least 2 times higher in young CEC-DM than in stroma, and less than 2 fold difference in expression between young and old CECs. Genes are ranked in descending order of RPM values of young CEC-DM. RPM values are rounded off to the nearest integer, and fold change values are rounded off to the nearest decimal place.
We next performed pathway analysis of the transcription factors using DAVID Functional Annotation. The signaling pathways represented by the expressed transcription factors include TGFβ and Wnt signaling pathways (Table 9). The expression of components of these signaling pathways were further examined (Tables S5 and S6). Interestingly, we found that CECs do not express all SMADs (intracellular mediators of TGFβ signaling). The most highly expressed SMADs (SMAD2, SMAD3 and SMAD4) in CECs are those involved in the Activin/Nodal branch of TGFβ signaling (Table 10). Such information provides further clues for future work to delineate the signaling pathways controlling CEC physiology and gene expression.
Table 9. Pathway analysis of transcription factors via DAVID Functional Annotation.
| Term | % | Genes |
| Pathways in cancer | 12.1 | CTBP1, CTBP2, EPAS1, RXRB, TCEB2, SMAD3, STAT1, RBX1 |
| TGF-beta signaling pathway | 7.6 | E2F4, RBL2,SMAD3,RBX1,PITX2 |
| Cell cycle | 6.1 | E2F4, RBL2,SMAD3,RBX1 |
| Wnt signaling pathway | 6.1 | CTBP1, CTBP2, SMAD3, RBX1 |
| Renal cell carcinoma | 4.6 | EPAS1, TCEB2, RBX1 |
| Chronic myeloid leukemia | 4.6 | CTBP1, CTBP2, SMAD3 |
Transcription factors expressed in young CEC-DM, old CEC-DM and CEC culture (RPM>10) that are more than two-fold higher in young CEC-DM versus stroma, were analyzed in DAVID. Pathways that are over represented are ranked in descending order of percentage of genes representing this category.
Table 10. Expression of SMADs in corneal endothelium, cultured corneal endothelial cells and corneal stroma.
| RPM Values | ||||
| GeneSymbol | Young | Old | Culture | Stroma |
| SMAD3 | 180 | 275 | 55 | 38 |
| SMAD2 | 106 | 45 | 82 | 131 |
| SMAD4 | 28 | 11 | 35 | 0 |
| SMAD5 | 23 | 0 | 3 | 2 |
| SMAD9 | 14 | 0 | 0 | 0 |
| SMAD7 | 5 | 46 | 1 | 3 |
| SMAD6 | 1 | 0 | 0 | 0 |
| SMAD1 | 0 | 5 | 0 | 0 |
Genes are ranked in descending order of RPM values of young CEC-DM. RPM values are rounded off to the nearest integer.
Discussion
Expression Markers for CECs
The challenges and important Clinical Quality Assurance (CQA) points that should be taken into consideration for CEC therapy include identity, potency, purity, and safety. To date, no one specific gene has been identified as a marker of CECs. While generic markers such as ZO-1 and Na+/K+-ATPase indicate the presence of functional fluid transport, they do not definitively identify CECs. Indeed, co-expression of ZO-1 and Na+/K+-ATPase has been observed in mammalian blastocyst [23], [24], and in various adult tissues including intestinal epithelium [25] and retinal pigmented epithelium [26]. The use of our proposed panel of genes (SLC4A11, COL8A2 and CYYR1) together ascertain the identity of the CEC cell type, thereby fulfilling the first CQA point that renders the cell suitable for clinical use.
Both SLC4A11 and COL8A2 are known to play important functions in the cornea. SLC4A11 is a multi-pass membrane protein important for sodium-mediated fluid transport. It prevents morphological abnormalities of the cornea caused by increased sodium chloride concentrations in the stroma. Mutations in SLC4A11 have been known to cause Harboyan Syndrome (congenital corneal endothelial dystrophy with progressive perceptive deafness) [27], Corneal Endothelial Dystrophy Type 2 (bilateral corneal dystrophy characterized by corneal opacification and nystagmus) [28], and Fuchs Endothelial Dystrophy (ocular disorder characterized by focal wart-like guttata that arise from DM and develop in the central cornea, epithelial blisters, reduced vision and pain) [29].
COL8A2 encodes the alpha 2 chain of type VIII collagen. Type VIII collagen is a major component of the DM [30]. Mutations in COL8A2 have been shown to cause Fuchs Endothelial Corneal Dystrophy and Posterior Polymorphous Corneal Dystrophy Type 2 [31], [32], [33], [34], [35], [36], [37].
Little is known about CYYR1, also called cysteine and tyrosine-rich protein 1. It is a recently identified gene located on human chromosome 21 whose product has no similarity to any known protein and is of unknown function [38]. Analysis of expressed sequence tags revealed high human CYYR1 expression in cells belonging to the diffuse neuroendocrine system, which may be the origin of neuroendocrine tumors [39].
Differentiating between Corneal Endothelial Cells and Corneal Stroma Cells
The inclusion of CYYR1 as part of our panel to identify CECs is crucial, because it helps differentiate CECs from corneal stroma keratocytes and the serum-activated keratocytes known as corneal stroma fibroblasts. This is especially important for researchers studying CEC explants and CEC cultures as slow-growing CECs can be contaminated with, and over-taken by the highly proliferative corneal stroma fibroblasts that may be co-isolated during the isolation of CEC for culture [40]. In addition, CECs are the closest to corneal stroma keratocytes in terms of embryonic origin. During development, both cell types are derived from cranial neural crest cells, which migrate and settle in the head mesenchyme. In chick and human, the first wave of migration of mesenchymal cells forms the endothelial layer on the inner surface of the cornea, adjacent to the lens. Shortly thereafter, a second wave of mesenchymal cells invades the primary stroma where the mesenchymal cells differentiate into keratocytes [41], [42]. Therefore, a reliable panel of genes to identify de novo CECs generated from pluripotent stem cells must have considerably lower expression in stromal keratocytes/fibroblasts compared to CECs.
Signaling Pathways Controlling CECs Physiology
The high throughput gene expression analysis performed is not only useful for identifying markers for CECs, but also provides insight into the signaling pathways controlling CEC physiology. Examination of the cytokine receptors and transcription factors expressed revealed that TGFβ (in particular the Activin/Nodal branch) and Wnt signaling pathways are active in CECs.
Indeed, exogenous TGFβ in the aqueous humor has been shown to suppress S-phase entry in CEC cultures, suggesting that TGFβ could play a role in the inhibition of proliferation of CECs [43]. In the developing eye, TGFβ from the lens has been shown to control the development of the neural crest–derived eye structures (corneal stroma, corneal endothelium, anterior iris and trabecular meshwork) [44]. The migration of periocular mesenchyme into the region of the prospective corneal stroma and endothelium is attributed to a response to TGFβ signals from the lens. Furthermore, TGFβ2 released from the lens is required for the expression of transcription factors PITX2 and FOXC1 [44], whose expressions in periocular mesenchyme are necessary for the proper formation of the anterior segment of the eye [45].
Wnt signalling has also been implicated in the development of CECs. Canonical Wnt signalling is required for maintenance of PITX2 expression in ocular neural crest cells during cornea development [46]. Interestingly, the Wnt antagonist DKK2 is an essential downstream target of the PITX2 homeodomain transcription factor in neural crest during eye development, to provide a mechanism to locally suppress canonical Wnt signaling activity during eye development [47].
Therefore, manipulation of TGFβ and Wnt signaling pathways in CECs could help improve conditions for ex vivo culture of CECs, and direct differentiation of pluripotent stem cells or neural crest cells into CECs.
In conclusion, the high throughput expression analysis of CECs presented in this paper revealed a panel of genes (SLC4A11, COL8A2 and CYYR1) that could be used to identify CECs and proposed pathways (TGFβ and Wnt) that could be explored for expansion of CEC in vitro or generation of CECs de novo.
Materials and Methods
Research-grade Human Corneoscleral Tissues
Research-grade corneoscleral tissues from cadaver human donors considered unsuitable for transplantation were procured from Lions Eye Institute for Transplant and Research Inc. (Tampa, FL, USA). Overall general health of the donor before death was also considered which included previous history or medical treatment that might damage or affect the growth of the corneal endothelium. Research corneas were preserved and transported in Optisol-GS at 4°C, and were used within 13 days from preservation. The ages of donors ranged from 19–76 years (Table 11).
Table 11. Donor information.
| Serial Number | Age | Sex | Cell Count (OS/OD) | Cause of Death | |||||
| A | B | C | D | E | |||||
| Single | |||||||||
| 01 | 19 | M | 2625 (OS) | Overdose | • | ||||
| 02 | 23 | F | 3891 (OS) | Cholecystitis | • | ||||
| 03 | 23 | F | 3676 (OS) | Anoxia | • | ||||
| 04 | 25 | M | 3344 (OD) | Suicide | • | ||||
| 05 | 32 | F | 2625 (OS) | Liver Failure | • | ||||
| 06 | 51 | F | 2865 (OS) | Sepsis | • | ||||
| 07 | 61 | M | 2740 (OS) | Acute Cardiac Crisis | • | ||||
| 08 | 57 | F | 2597 (OD) | Pulmonary Embolism | • | ||||
| 09 | 59 | M | 2494 (OD) | Cancer | • | ||||
| 10 | 76 | F | 2439 (OD) | Acute Cardiac Crisis | • | ||||
| 11 | 19 | M | 2375 (OD) | Anoxia | • | ||||
| 12 | 27 | F | 2762 (OS) | Multiple Blunt Trauma | • | ||||
| 13 | 19 | M | 3846 (OS) | Sepsis | • | ||||
| Pairs | |||||||||
| 14 | 31 | M | 2309 (OS)2398 (OD) | Overdose | • | ||||
| 15 | 28 | M | 3096 (OS)2933 (OD) | Overdose | • | ||||
| 16 | 47 | F | 2387 (OS)2451 (OD) | Cerebrovascular Accident | • | ||||
| 17 | 19 | M | 2865 (OS)2717 (OD) | Pneumonia | • | ||||
| 18 | 74 | M | 2114 (OS)2045 (OD) | Cardiopulmonary Arrest | • | ||||
| 19 | 34 | M | 2725 (OS)2801 (OD) | Sepsis | • | ||||
| 20 | 27 | F | 2037 (OS)2203 (OD) | Sepsis | • | ||||
A total of 27 donor corneas consisting of 13 single donor corneas and 7 paired donor corneas were used in this study. Donor age ranged from 19–76.
A: pooled CEC-DM from five young donors;
B: pooled CEC-DM from five old donors;
C: Isolated for cell culture;
D: young CEC-DME control;
E: old CEC-DME control.
OS: oculus sinister.
OD: oculus dexter.
Isolation of Human Corneal Endothelial Cells
Research corneas were incubated in three washes of antibiotic/antimycotic solution in PBS, 15 minutes each. Corneoscleral rims were placed endothelial-side-up on a disposable cornea vacuum punch (Ripon, England), and mildly stabilized by the vacuum suction created. A brief 30 seconds treatment with Trypan Blue solution (0.1%) was used to delineate Schwalbe’s line. The CEC-DM layer was carefully stripped off, approximately 1 mm anterior to the Schwalbe’s line (away from the trabecular meshwork) from the posterior stroma under the dissecting microscope (Nikon, Japan).
Culture of Human Corneal Endothelial Cells
Primary cultures of CECs were established as described in [48], and propagated with some modifications. Briefly, the CEC-DM layer was digested enzymatically in collagenase A (2 mg/ml) for at least 2 hours and up to 6 hours. This allowed full detachment of the CECs from the DM, which tended to conglomerate into tightly-packed CEC clusters. The CEC clusters were rinsed once in PBS and further dissociated in TrypLE Express (TE) for 5 minutes. Cell pellets collected after a mild centrifugation (800 g for 5 minutes) were plated in culture-ware coated with FNC coating mixture. Isolated cells were left to adhere overnight in a stabilization medium made up of Human Endothelial-SFM supplemented with 5% FBS and 1x anti-biotic/anti-mycotic. Adhered hCECs were then cultured in F99 medium containing Ham’s F12 and M199, mixed in a 1∶1 ratio, supplemented with 5% FBS, 20 µg/ml ascorbic acid, 1x Insulin-Transferrin-Selenium, 1x anti-biotic/anti-mycotic and 10 ng/ml bFGF. When the cultured cells reached 80–90% confluence, they were re-exposed to the stabilization medium for at least one week before passaging [49]. Confluent hCECs were passaged using TE, and seeded onto FNC-coated culture ware at a plating density of approximately 10,000 cells per cm2 for subsequent passage. All incubation and cultivation of hCECs were carried out in a humidified incubator at 37°C containing 5% CO2 unless otherwise stated. Fresh media were replenished every two days.
RNA Extraction
For direct RNA extraction of donor tissues, isolated CEC-DM and corresponding corneal stroma button, punched out from the donor cornea tissue using an 8.0-mm diameter trephine, were rinsed once in PBS and placed directly into 1 ml Trizol reagent. It should be noted that although most of the corneal epithelium spontaneously sloughed off the cornea surface during the transport and process of the cornea, remnant cells of the basal corneal epithelium might still be present on the corneal stroma button used for RNA extraction. Tissues were homogenized using a hand-held homogenizer before addition of 200 ul of chloroform. After vigorous shaking, samples were spun at 13000 rpm for 15 min at 4°C. The upper phase, containing total RNA, was transferred to a new tube containing an equal volume of 70% ethanol. The resulting solution was transferred into a QIAGEN RNeasy column and procedures were performed as per manufacturer’s protocol with a DNAse digestion step incorporated.
RNA Sequencing
Reverse transcription and amplification
RNA-seq libraries were prepared using an AB Demonstrated Protocol similar to the one reported in Tang et al (2009). For each sample, 100 pg of total RNA was reverse transcribed by SuperScript III reverse transcriptase (Cat no: 11752-250), using a poly(T) primer with a UP1 anchor sequence (50°C for 30 min followed by an enzyme inactivation step of 70°C for 10 min). The remaining free primers were removed by incubating with Exonuclease I (37°C 30 min, 80°C 25 min). Subsequently, a poly (A) tail was added to the 3′ end of the first strand cDNA by terminal deoxynucleotidyl transferase (37°C for 15 min, and 70°C for 10 min).
The resulting product was split into 4 tubes and used for the synthesis of the second strand cDNA, using a poly(T) primer with another anchor sequence (UP2) and TaKaRa Ex Taq HS, in a volume of 22 µl each (1 cycle of 95°C for 3 min, 50°C for 2 min and 72°C for 6 min). The product of each tube was then separately amplified in a volume of 41 µl, using primers UP1 and UP2 and TaKaRa Ex Taq HS (18 cycles of 95°C for 30 sec, 67°C for 1 min and 72°C for 6 min +6 sec per cycle). The amplified cDNA was combined and purified using a QIAquick PCR purification kit and eluted with 50 µl EB buffer.
The purified cDNA was re-split into 4 tubes and re-amplified with a volume of 90 µl, using 1.2 µl of template for each tube (95°C for 3 min followed by 12 cycles of 95°C for 30 sec, 67°C for 1 min and 72°C 6 min +6 sec per cycle). For this amplification NH2-UP1 and NH2-UP2 primers were used. The amplified cDNA for each sample was then combined, purified and size-selected (500 bp to 3 kb) by gel purification.
Library preparation
The ABI standard library preparation protocol (Chapter 2 of AB SOLiD 4 system library preparation guide - PN 4445673) was used for non-barcoded library preparation. The SOLiD fragment library barcoding kit module protocol (AB PN 4443045) was used for barcoded library preparation. The libraries were generated by using the SOLiD fragment library construction kit (PN 4443471) and the SOLiD fragment library barcoding kit (AB PN 4444836).
In brief 1 µg of amplified cDNA was sheared to approximately 165 bp, end repaired and P1, P2 adapters ligated. The product was then nick translated and amplified for 5 cycles before being size selected to be between ∼240 bp to 270 bp. The libraries were further processed using the AB SOLiD 4 system templated bead preparation guide (PN 4448378) and sequenced on 1/8th of a SOLiD slide.
Alignment and counting
The resulting RNA-seq reads were processed using the ABI Bioscope pipeline. The reads were aligned to the hg19 human reference genome. Gene expression was measured by counting the number of reads mapping uniquely to both strands of each gene footprint and normalized to the total uniquely mapped reads to the entire genome. The value was adjusted to show reads per million (RPM).
Gene Expression Analysis
Reverse transcription
Reverse transcription was carried out using Superscript III (Cat no: 11752-250) according to manufacturer’s protocol.
High-throughput Quantitative Polymerase Chain Reaction (QPCR)
Fluidigm BioMark™System was used for high throughput QPCR and procedures were performed as per manufacturer’s protocol. Briefly, 5.6 ng of cDNA and 5x Taqman Gene Expression Assays (Applied Biosystems) were used per reaction and were loaded on a 48×48 Dynamic Array. Data was analyzed using BioMark™ HD System Software Suite. Expression from each gene was normalized to house-keeping genes (GAPDH, ATP6V0E1 and H2AFY) Error bars represent standard deviation from three replicates. The list of primers used can be found in Table 12.
Table 12. Primer list.
| Gene Name | Array Probe ID | Catalog Number | Location of usage |
| ATP5B | Hs00969569_m1 | 4331182 | Figure 3 |
| CA3 | Hs01013316_m1 | 4331182 | Figure 4 |
| COL8A2 | Hs00697025_m1 | 4331182 | Figure 3, 6 |
| CYYR1 | Hs00364793_m1 | 4331182 | Figure 5, 6 |
| EEPD1 | Hs00286893_m1 | 4331182 | Figure 5 |
| ENO1 | Hs00361415_m1 | 4331182 | Figure 3 |
| IER3 | Hs00174674_m1 | 4331182 | Figure 4 |
| MGP | Hs00969490_m1 | 4331182 | Figure 4 |
| MYO | Hs00165345_m1 | 4331182 | Figure 3 |
| OLFML1 | Hs00416948_m1 | 4331182 | Figure 5 |
| PLK | Hs00288354_m1 | 4331182 | Figure 5 |
| PTGDS | Hs00168748_m1 | 4331182 | Figure 4 |
| SFRP1 | Hs00610060_m1 | 4331182 | Figure 4 |
| SLC2A1 | Hs00892681_m1 | 4331182 | Figure 3 |
| SLC4A11 | Hs00984689_g1 | 4351372 | Figure 3, 6 |
| TUB | Hs00163231_m1 | 4331182 | Figure 5 |
| ZNF16 | Hs00937483_m1 | 4331182 | Figure 5 |
| ZNF846 | Hs01394168_m1 | 4331182 | Figure 5 |
| GAPDH | 4326317E | Housekeeping Gene | |
| ATP6V0E1 | Hs00859570_g1 | 4331182 | Housekeeping Gene |
| H2AFY | Hs00191689_m1 | 4331182 | Housekeeping Gene |
List of primers used in this study.
QPCR
7500 Fast Real-Time PCR System (Life Technologies) was used for QPCR and procedures were performed as per manufacturer’s protocol. Briefly, 12.5 ng of cDNA and 2x Taqman Gene Expression Assays (Applied Biosystems) were used per reaction and loaded on a 96-well plate (for Life Technologies PCR system). Expression of each gene was normalized to GAPDH in the same run. Expression levels across samples were normalised to that in CEC culture (100 in CEC culture). Error bars represent standard deviation from three replicates. The list of primers used can be found in Table 12.
Supporting Information
RNAseqpooled_fulldataset. Full data set of RNA sequencing performed on 1) CEC-DM pooled from 5 young donors; 2) CEC-DM pooled from 5 old donors; 3) CEC cultures and 4) Corneal stroma pooled from 5 young donors.
(XLSX)
Transporters. List of transporters (based on PANTHER classification system) and their respective RPM values for young CEC-DM, old CEC-DM, CEC cultures and corneal stroma. This table is a subset of Table S1.
(XLSX)
Cytokine Receptors. List of cytokine receptors (based on PANTHER classification system) and their respective RPM values for young CEC-DM, old CEC-DM, CEC cultures and corneal stroma. This table is a subset of Table S1.
(XLSX)
Transcription Factors. List of cytokine transcription factors (based on PANTHER classification system) and their respective RPM values for young CEC-DM, old CEC-DM, CEC cultures and corneal stroma. This table is a subset of Table S1.
(XLSX)
TGF. List of components of the TGF pathway and their respective RPM values for young CEC-DM, old CEC-DM, CEC cultures and corneal stroma. This table is a subset of Table S1.
(XLSX)
Wnt. List of components of the Wnt pathway and their respective RPM values for young CEC-DM, old CEC-DM, CEC cultures and corneal stroma. This table is a subset of Table S1.
(XLSX)
Acknowledgments
We thank B. George for helpful discussion and for critically reading the manuscript. We also thank Lion Eye Institute for Transplant and Research (Tampa, FL, USA) for assistance with procurement of the research-grade donor corneas.
Funding Statement
This study is supported by Agency for Science, Technology and Research TCRP Grant (TCR0101673). The funders had no role in study design, data collection and analysis, decision to publish, or preparation of the manuscript.
References
- 1. Peh GS, Beuerman RW, Colman A, Tan DT, Mehta JS (2011) Human corneal endothelial cell expansion for corneal endothelium transplantation: an overview. Transplantation 91: 811–819. [DOI] [PubMed] [Google Scholar]
- 2. Bourne WM, Nelson LR, Hodge DO (1997) Central corneal endothelial cell changes over a ten-year period. Investigative ophthalmology & visual science 38: 779–782. [PubMed] [Google Scholar]
- 3. Joyce NC (2003) Proliferative capacity of the corneal endothelium. Progress in retinal and eye research 22: 359–389. [DOI] [PubMed] [Google Scholar]
- 4. Kaufman HE, Katz JI (1977) Pathology of the corneal endothelium. Investigative ophthalmology & visual science 16: 265–268. [PubMed] [Google Scholar]
- 5. Edelhauser HF (2000) The resiliency of the corneal endothelium to refractive and intraocular surgery. Cornea 19: 263–273. [DOI] [PubMed] [Google Scholar]
- 6. Melles GR, Ong TS, Ververs B, van der Wees J (2006) Descemet membrane endothelial keratoplasty (DMEK). Cornea 25: 987–990. [DOI] [PubMed] [Google Scholar]
- 7. Rose L, Kelliher C, Jun AS (2009) Endothelial keratoplasty: historical perspectives, current techniques, future directions. Canadian journal of ophthalmology Journal canadien d’ophtalmologie 44: 401–405. [DOI] [PubMed] [Google Scholar]
- 8. Tan DT, Anshu A, Mehta JS (2009) Paradigm shifts in corneal transplantation. Annals of the Academy of Medicine, Singapore 38: 332–338. [PubMed] [Google Scholar]
- 9. Barry PA, Petroll WM, Andrews PM, Cavanagh HD, Jester JV (1995) The spatial organization of corneal endothelial cytoskeletal proteins and their relationship to the apical junctional complex. Investigative ophthalmology & visual science 36: 1115–1124. [PubMed] [Google Scholar]
- 10. Sugrue SP, Zieske JD (1997) ZO1 in corneal epithelium: association to the zonula occludens and adherens junctions. Experimental eye research 64: 11–20. [DOI] [PubMed] [Google Scholar]
- 11. Savion N, Farzame N (1986) Characterization of the Na, K-ATPase pump in cultured bovine corneal endothelial cells. Experimental eye research 43: 355–363. [DOI] [PubMed] [Google Scholar]
- 12. Corti C, Xuereb JH, Crepaldi L, Corsi M, Michielin F, et al. (2011) Altered levels of glutamatergic receptors and Na+/K+ ATPase-alpha1 in the prefrontal cortex of subjects with schizophrenia. Schizophrenia research 128: 7–14. [DOI] [PubMed] [Google Scholar]
- 13. Sanchez C, Corrias A, Bueno-Orovio A, Davies M, Swinton J, et al. (2012) The Na+/K+ pump is an important modulator of refractoriness and rotor dynamics in human atrial tissue. American journal of physiology Heart and circulatory physiology 302: H1146–1159. [DOI] [PMC free article] [PubMed] [Google Scholar]
- 14. Sune G, Sarro E, Puigmule M, Lopez-Hellin J, Zufferey M, et al. (2010) Cyclophilin B interacts with sodium-potassium ATPase and is required for pump activity in proximal tubule cells of the kidney. PloS one 5: e13930. [DOI] [PMC free article] [PubMed] [Google Scholar]
- 15. Bonting SL, Simon KA, Hawkins NM (1961) Studies on sodium-potassium-activated adenosine triphosphatase. I. Quantitative distribution in several tissues of the cat. Archives of biochemistry and biophysics 95: 416–423. [DOI] [PubMed] [Google Scholar]
- 16. Wang Z, Gerstein M, Snyder M (2009) RNA-Seq: a revolutionary tool for transcriptomics. Nature reviews Genetics 10: 57–63. [DOI] [PMC free article] [PubMed] [Google Scholar]
- 17. Huang da W, Sherman BT, Lempicki RA (2009) Systematic and integrative analysis of large gene lists using DAVID bioinformatics resources. Nature protocols 4: 44–57. [DOI] [PubMed] [Google Scholar]
- 18. Mi H, Dong Q, Muruganujan A, Gaudet P, Lewis S, et al. (2010) PANTHER version 7: improved phylogenetic trees, orthologs and collaboration with the Gene Ontology Consortium. Nucleic acids research 38: D204–210. [DOI] [PMC free article] [PubMed] [Google Scholar]
- 19. Tang F, Barbacioru C, Wang Y, Nordman E, Lee C, et al. (2009) mRNA-Seq whole-transcriptome analysis of a single cell. Nature methods 6: 377–382. [DOI] [PubMed] [Google Scholar]
- 20. Sakai R, Kinouchi T, Kawamoto S, Dana MR, Hamamoto T, et al. (2002) Construction of human corneal endothelial cDNA library and identification of novel active genes. Investigative ophthalmology & visual science 43: 1749–1756. [PubMed] [Google Scholar]
- 21. Gottsch JD, Seitzman GD, Margulies EH, Bowers AL, Michels AJ, et al. (2003) Gene expression in donor corneal endothelium. Archives of ophthalmology 121: 252–258. [DOI] [PubMed] [Google Scholar]
- 22. Bonanno JA (2012) Molecular mechanisms underlying the corneal endothelial pump. Experimental eye research 95: 2–7. [DOI] [PMC free article] [PubMed] [Google Scholar]
- 23. Madan P, Rose K, Watson AJ (2007) Na/K-ATPase beta1 subunit expression is required for blastocyst formation and normal assembly of trophectoderm tight junction-associated proteins. The Journal of biological chemistry 282: 12127–12134. [DOI] [PubMed] [Google Scholar]
- 24. Violette MI, Madan P, Watson AJ (2006) Na+/K+ -ATPase regulates tight junction formation and function during mouse preimplantation development. Developmental biology 289: 406–419. [DOI] [PubMed] [Google Scholar]
- 25. Sugi K, Musch MW, Field M, Chang EB (2001) Inhibition of Na+,K+-ATPase by interferon gamma down-regulates intestinal epithelial transport and barrier function. Gastroenterology 120: 1393–1403. [DOI] [PubMed] [Google Scholar]
- 26. Sonoda S, Sreekumar PG, Kase S, Spee C, Ryan SJ, et al. (2010) Attainment of polarity promotes growth factor secretion by retinal pigment epithelial cells: relevance to age-related macular degeneration. Aging 2: 28–42. [DOI] [PMC free article] [PubMed] [Google Scholar]
- 27. Desir J, Moya G, Reish O, Van Regemorter N, Deconinck H, et al. (2007) Borate transporter SLC4A11 mutations cause both Harboyan syndrome and non-syndromic corneal endothelial dystrophy. Journal of medical genetics 44: 322–326. [DOI] [PMC free article] [PubMed] [Google Scholar]
- 28. Jiao X, Sultana A, Garg P, Ramamurthy B, Vemuganti GK, et al. (2007) Autosomal recessive corneal endothelial dystrophy (CHED2) is associated with mutations in SLC4A11. Journal of medical genetics 44: 64–68. [DOI] [PMC free article] [PubMed] [Google Scholar]
- 29. Riazuddin SA, Vithana EN, Seet LF, Liu Y, Al-Saif A, et al. (2010) Missense mutations in the sodium borate cotransporter SLC4A11 cause late-onset Fuchs corneal dystrophy. Human mutation 31: 1261–1268. [DOI] [PMC free article] [PubMed] [Google Scholar]
- 30. Kapoor R, Bornstein P, Sage EH (1986) Type VIII collagen from bovine Descemet’s membrane: structural characterization of a triple-helical domain. Biochemistry 25: 3930–3937. [DOI] [PubMed] [Google Scholar]
- 31. Biswas S, Munier FL, Yardley J, Hart-Holden N, Perveen R, et al. (2001) Missense mutations in COL8A2, the gene encoding the alpha2 chain of type VIII collagen, cause two forms of corneal endothelial dystrophy. Human molecular genetics 10: 2415–2423. [DOI] [PubMed] [Google Scholar]
- 32. Gottsch JD, Sundin OH, Liu SH, Jun AS, Broman KW, et al. (2005) Inheritance of a novel COL8A2 mutation defines a distinct early-onset subtype of fuchs corneal dystrophy. Investigative ophthalmology & visual science 46: 1934–1939. [DOI] [PubMed] [Google Scholar]
- 33. Gottsch JD, Zhang C, Sundin OH, Bell WR, Stark WJ, et al. (2005) Fuchs corneal dystrophy: aberrant collagen distribution in an L450W mutant of the COL8A2 gene. Investigative ophthalmology & visual science 46: 4504–4511. [DOI] [PubMed] [Google Scholar]
- 34. Kobayashi A, Fujiki K, Murakami A, Kato T, Chen LZ, et al. (2004) Analysis of COL8A2 gene mutation in Japanese patients with Fuchs’ endothelial dystrophy and posterior polymorphous dystrophy. Japanese journal of ophthalmology 48: 195–198. [DOI] [PubMed] [Google Scholar]
- 35. Liskova P, Prescott Q, Bhattacharya SS, Tuft SJ (2007) British family with early-onset Fuchs’ endothelial corneal dystrophy associated with p.L450W mutation in the COL8A2 gene. The British journal of ophthalmology 91: 1717–1718. [DOI] [PMC free article] [PubMed] [Google Scholar]
- 36. Mok JW, Kim HS, Joo CK (2009) Q455V mutation in COL8A2 is associated with Fuchs’ corneal dystrophy in Korean patients. Eye 23: 895–903. [DOI] [PubMed] [Google Scholar]
- 37. Yellore VS, Rayner SA, Emmert-Buck L, Tabin GC, Raber I, et al. (2005) No pathogenic mutations identified in the COL8A2 gene or four positional candidate genes in patients with posterior polymorphous corneal dystrophy. Investigative ophthalmology & visual science 46: 1599–1603. [DOI] [PubMed] [Google Scholar]
- 38. Vitale L, Casadei R, Canaider S, Lenzi L, Strippoli P, et al. (2002) Cysteine and tyrosine-rich 1 (CYYR1), a novel unpredicted gene on human chromosome 21 (21q21.2), encodes a cysteine and tyrosine-rich protein and defines a new family of highly conserved vertebrate-specific genes. Gene 290: 141–151. [DOI] [PubMed] [Google Scholar]
- 39. Vitale L, Frabetti F, Huntsman SA, Canaider S, Casadei R, et al. (2007) Sequence, “subtle” alternative splicing and expression of the CYYR1 (cysteine/tyrosine-rich 1) mRNA in human neuroendocrine tumors. BMC cancer 7: 66. [DOI] [PMC free article] [PubMed] [Google Scholar]
- 40. Peh GS, Lee MX, Wu FY, Toh KP, Balehosur D, et al. (2012) Optimization of human corneal endothelial cells for culture: the removal of corneal stromal fibroblast contamination using magnetic cell separation. International journal of biomaterials 2012: 601302. [DOI] [PMC free article] [PubMed] [Google Scholar]
- 41. Hay ED (1980) Development of the vertebrate cornea. International review of cytology 63: 263–322. [DOI] [PubMed] [Google Scholar]
- 42. Lwigale PY, Cressy PA, Bronner-Fraser M (2005) Corneal keratocytes retain neural crest progenitor cell properties. Developmental biology 288: 284–293. [DOI] [PubMed] [Google Scholar]
- 43. Joyce NC, Harris DL, Mello DM (2002) Mechanisms of mitotic inhibition in corneal endothelium: contact inhibition and TGF-beta2. Investigative ophthalmology & visual science 43: 2152–2159. [PubMed] [Google Scholar]
- 44. Ittner LM, Wurdak H, Schwerdtfeger K, Kunz T, Ille F, et al. (2005) Compound developmental eye disorders following inactivation of TGFbeta signaling in neural-crest stem cells. Journal of biology 4: 11. [DOI] [PMC free article] [PubMed] [Google Scholar]
- 45. Tumer Z, Bach-Holm D (2009) Axenfeld-Rieger syndrome and spectrum of PITX2 and FOXC1 mutations. European journal of human genetics : EJHG 17: 1527–1539. [DOI] [PMC free article] [PubMed] [Google Scholar]
- 46. Zacharias AL, Gage PJ (2010) Canonical Wnt/beta-catenin signaling is required for maintenance but not activation of Pitx2 expression in neural crest during eye development. Developmental dynamics : an official publication of the American Association of Anatomists 239: 3215–3225. [DOI] [PMC free article] [PubMed] [Google Scholar]
- 47. Gage PJ, Qian M, Wu D, Rosenberg KI (2008) The canonical Wnt signaling antagonist DKK2 is an essential effector of PITX2 function during normal eye development. Developmental biology 317: 310–324. [DOI] [PMC free article] [PubMed] [Google Scholar]
- 48. Peh GS, Toh KP, Wu FY, Tan DT, Mehta JS (2011) Cultivation of human corneal endothelial cells isolated from paired donor corneas. PloS one 6: e28310. [DOI] [PMC free article] [PubMed] [Google Scholar]
- 49. Peh GS, Toh KP, Ang HP, Seah XY, George BL, et al. (2013) Optimization of human corneal endothelial cell culture: density dependency of successful cultures in vitro. BMC research notes 6: 176. [DOI] [PMC free article] [PubMed] [Google Scholar]
Associated Data
This section collects any data citations, data availability statements, or supplementary materials included in this article.
Supplementary Materials
RNAseqpooled_fulldataset. Full data set of RNA sequencing performed on 1) CEC-DM pooled from 5 young donors; 2) CEC-DM pooled from 5 old donors; 3) CEC cultures and 4) Corneal stroma pooled from 5 young donors.
(XLSX)
Transporters. List of transporters (based on PANTHER classification system) and their respective RPM values for young CEC-DM, old CEC-DM, CEC cultures and corneal stroma. This table is a subset of Table S1.
(XLSX)
Cytokine Receptors. List of cytokine receptors (based on PANTHER classification system) and their respective RPM values for young CEC-DM, old CEC-DM, CEC cultures and corneal stroma. This table is a subset of Table S1.
(XLSX)
Transcription Factors. List of cytokine transcription factors (based on PANTHER classification system) and their respective RPM values for young CEC-DM, old CEC-DM, CEC cultures and corneal stroma. This table is a subset of Table S1.
(XLSX)
TGF. List of components of the TGF pathway and their respective RPM values for young CEC-DM, old CEC-DM, CEC cultures and corneal stroma. This table is a subset of Table S1.
(XLSX)
Wnt. List of components of the Wnt pathway and their respective RPM values for young CEC-DM, old CEC-DM, CEC cultures and corneal stroma. This table is a subset of Table S1.
(XLSX)