

Abstract
Lung cancer histologic diagnosis is clinically relevant because there are histology-specific treatment indications and contraindications. Histologic diagnosis can be challenging owing to tumor characteristics, and it has been shown to have less-than-ideal agreement among pathologists reviewing the same specimens. Microarray profiling studies using frozen specimens have shown that histologies exhibit different gene expression trends; however, frozen specimens are not amenable to routine clinical application. Herein, we developed a gene expression–based predictor of lung cancer histology for FFPE specimens, which are routinely available in clinical settings. Genes predictive of lung cancer histologies were derived from published cohorts that had been profiled by microarrays. Expression of these genes was measured by quantitative RT-PCR (RT-qPCR) in a cohort of patients with FFPE lung cancer. A histology expression predictor (HEP) was developed using RT-qPCR expression data for adenocarcinoma, carcinoid, small cell carcinoma, and squamous cell carcinoma. In cross-validation, the HEP exhibited mean accuracy of 84% and κ = 0.77. In separate independent validation sets, the HEP was compared with pathologist diagnoses on the same tumor block specimens, and the HEP yielded similar accuracy and precision as the pathologists. The HEP also exhibited good performance in specimens with low tumor cellularity. Therefore, RT-qPCR gene expression from FFPE specimens can be effectively used to predict lung cancer histology.
Lung cancer is the leading cause of cancer death worldwide.1 Classification of lung cancers is critical for standardized and optimized patient care.2,3 The World Health Organization classification of lung tumors defines >40 histologic types based on morphologic features as assessed via light microscopy by a pathologist.4 The most common types are squamous cell carcinoma (29%), adenocarcinoma (27%), small cell carcinoma (13%), large cell (6%), and carcinoid (1%). (Surveillance, Epidemiology, and End Results Program, http://www.seer.cancer.gov/data, Limited-Use Data 1973-2006, National Cancer Institute, Division of Cancer Control and Population Sciences, Surveillance Research Program, Cancer Statistics Branch, released April 2009, based on the November 2008 submission, last accessed July 16, 2009) This classification is clinically relevant because the types have different recommended and contraindicated therapies (US Food and Drug Administration, Alimta/pemetrexed label, http://www.accessdata.fda.gov/drugsatfda_docs/label/2011/021462s029s030s032lbl.pdf, last accessed May 22, 2013; US Food and Drug Administration, Avastin/bevacizumab label, http://www.accessdata.fda.gov/drugsatfda_docs/label/2004/125085lbl.pdf, last accessed May 22, 2013).3,5 However, consensus histologic diagnoses as measured by interpathologist agreement can be challenging.6,7 Although immunohistochemical (IHC) markers can improve pathologist diagnosis accuracy, panels of markers have not been standardized into the most accepted tumor classifications, such as that of the World Health Organization.4,8 Finally, many patients (21%) receive a histologic diagnosis of lung cancer not otherwise specified, which inhibits the use of histology-specific treatment options. Therefore, improvements to lung cancer histologic diagnosis could result in better patient care.
Recent studies revealed that the histologic types differ not only in their morphologic features but also in their genetic features, such as gene expression, DNA copy number, and sequence mutations.5,9–12 So far, the most genetic differences among histologic types have been measured by gene expression microarrays from fresh frozen specimens.13–17 Gene expression profiling has great potential for improving the accuracy of the histologic diagnosis; owing to the need for retrospective validation and routine clinical application, the assays should be performed using formalin-fixed, paraffin-embedded (FFPE) tissues, which negates the use of conventional DNA microarrays. Herein, we determined that gene expression profiling using quantitative RT-PCR (RT-qPCR) can identify the major histologic types of lung cancer in clinically available FFPE tissue specimens, which should be especially useful in confirming the histologic diagnosis in small and compromised tissue biopsy specimens.
Materials and Methods
Gene Expression Microarrays
Published lung cancer cohorts assayed by Affymetrix U95v2 gene expression microarrays (Affymetrix Inc., Santa Clara, CA) from Bhattacharjee et al14 (n = 254) and Borczuk et al18 (n = 62), were processed by the robust multiarray average algorithm19 to produce gene expression values for each specimen.
Marker Gene Selection
The cohort of Bhattacharjee et al14 was used to select genes differentially expressed between histologic classes. The area under the receiver operating characteristic curve was used to calculate differentially expressed genes for the following class comparisons: small cell versus other, carcinoid versus other, stromal lung versus other, and squamous cell carcinoma versus adenocarcinoma. Because lung adenocarcinoma has well-described expression heterogeneity,14,20 differentially expressed genes were also determined among three adenocarcinoma expression subtypes20 so that all the variants of adenocarcinoma were represented. For each class comparison, the genes with the largest area under the receiver operating characteristic curve, indicating the largest difference in expression, were identified. These genes were manually reviewed for representation in the published lung cancer literature, and marker genes were further selected such that at least three genes with high expression in any given class/subtype were present. To be used for data normalization, housekeeping genes were selected in the following manner from the cohort of Bhattacharjee et al.14 Genes with high average expression in each histologic class and low variability as measured by standard deviation across histologic classes were considered good candidates. Candidate genes were interrogated for the ability to produce a high-performing primer pair using previously described criteria.21 Once a suitable set of housekeeping genes was produced, the set was evaluated for overall performance using previously described techniques.22
Marker Gene Validation
To verify that the marker genes were capable of discriminating the lung cancer histologic types, a predictor for microarray-based histology was built using the cohort of Bhattacharjee et al14 and the marker genes. Centroids were calculated as the mean of tumors in a sample class (adenocarcinoma, carcinoid, small cell, stromal lung, or squamous cell). The gene-wise means of the centroids were calculated and subtracted from the centroids, the cohorts of Bhattacharjee et al14 and Borczuk et al.18 The Pearson correlation was calculated between each tumor sample, and these five centroids and the histology of the maximally correlated centroid served as a tumor’s histology prediction. These predictions were compared with the tumors’ pathologically defined histologies to determine whether the marker genes enabled accurate predictions.
Patient Samples
FFPE specimens (n = 442) from patients with lung cancer receiving curative-intent surgery were collected at the University of North Carolina at Chapel Hill (Chapel Hill, NC) and at the University of Utah Health Sciences Center (Salt Lake City, UT). Patients were initially identified in an unselected manner from the clinical case records of the two institutions' multidisciplinary lung cancer programs. A second patient selection step was completed to increase cases with the rare variants of carcinoid and surgically resected small cell carcinoma. All the cases identified from the clinical record were used for this analysis without exception as long as the pathology department could provide at least one 10-μm section. When a case was identified, preference was given to section the block that was identified in the clinical pathology report as most representative of the entire surgical case diagnosis. Although most samples were obtained from grossly resected tumors, a small number came from biopsies such as mediastinoscopy or bronchoscopy. Clinical diagnosis was the pathologic diagnosis abstracted from the clinical pathology report at the time of initial diagnosis and treatment of the tumor. Clinical diagnosis is based on all information available to the clinical pathologist who reviewed the case, including IHC staining. In cases where data were indeterminate (such as inconsistent IHC staining), we relied on the clinical pathologist’s interpretation as the gold standard.
In every case, an H&E-stained section was taken from the same block immediately adjacent to the section used for molecular analysis. Slides were scanned using a digital imaging ScanScope system version 8 (Aperio, Vista, CA) and were reviewed for tumor cellularity as determined by tumor nuclei, necrosis, lymphocyte infiltrates, and fibrosis. No tumor was excluded based on these parameters. A panel of pathologists diagnosed the histology of a subset of tumors using the scanned slides as described in Pathologist Diagnosis. For the purposes of obtaining a set of stromal lung controls, sections of uninvolved adjacent lung were obtained from a subset of patients who provided tumors.
IHC Analysis
To document the impact of special stains on the clinical diagnosis, all the cases were abstracted for the use of adjunct testing beyond light microscopy, including but not limited to IHC analysis. Because the consulting clinical pathologists incorporated special staining in only a few cases, we augmented the clinical testing with IHC staining for two of the most widely used lineage markers of lung adenocarcinoma (TTF-1) and lung squamous cell carcinoma (p63). Tissue microarrays were constructed from FFPE tumor blocks. H&E-stained sections of tumors of all the patients were reviewed by one pathologist (W.K.F.) to confirm the original diagnosis, and a target area was identified in the donor block. Tissue microarrays were constructed using 1-mm cores on the manual tissue microarrayer-1 (Beecher Instruments, Sun Prarie, WI) and were made in triplicate to account for potential staining heterogeneity and potential loss of tissue during processing. Sequential 4-μm sections were cut from each tissue microarray. IHC staining of the TTF-1 and p63 proteins was performed in the Bond autostainer (Leica Microsystems Inc., Buffalo Grove, IL) according to the manufacturer's protocol. Briefly, slides were dewaxed in Bond dewaxing solution (AR9222) and were hydrated in Bond wash solution (AR9590) (Leica Microsystems Inc.). Antigen retrieval for TTF-1 was performed for 20 minutes at 100°C in Bond epitope retrieval solution 2, pH 9.0 (AR9640; Leica Microsystems Inc.). Slides were incubated with TTF-1 antibody (thyroid transcription factor-1 clone SPT24, dilution 1:100; Leica Microsystems Inc.) for 30 minutes. Lung carcinoma tissue was used as a positive control. Antigen retrieval for p63 was performed for 20 minutes at 100°C in Bond epitope retrieval solution 1, pH 6.0 (AR9961; Leica Microsystems Inc.). Slides were incubated with p63 antibody clone 4A4 (dilution 1:150; Dako, Carpinteria, CA) for 15 minutes. Prostate tissue was used as a positive control. Antibody detection for TTF-1 and p63 was performed using the Bond polymer refine detection system (DS9800; Leica Microsystems Inc.). Image acquisition was performed using ScanScope CS (Aperio). Samples were scored for percentage of tumor nuclei positively staining and the intensity on a 3-point scale. H-scores were defined as the product of intensity × percentage of cells.23 H-scores of replicate spots were averaged in each case to standardize diagnostic calls of positive or negative staining. The selected threshold for p63 H-score positivity was set at 85 to match published rates of sensitivity of 84% and specificity of 93%. Likewise, the TTF-1 threshold was determined to be 75, resulting in 70% sensitivity and 82% specificity to ensure that the performance of IHC analysis in this cohort was comparable with published studies.24–26 IHC data are available in Supplemental Table S1.
Sample Preparation and First-Strand Synthesis for RT-qPCR
Total RNA was extracted from four 10-μm FFPE tissue scrolls using the High Pure RNA paraffin kit (Roche Applied Science, Indianapolis, IN). Contaminating DNA was removed using Turbo DNase (Ambion, Austin, TX). The quantity of RNA was assessed using the NanoDrop ND-1000 spectrophotometer (NanoDrop Technologies Inc., Rockland, DE). There was no criterion on which to fail a sample based on the NanoDrop output. Experience suggests that the small number of samples that fail the housekeeping genes have a low yield by spectrophotometer (<20 ng/μL). First-strand cDNA was synthesized from 1.2 μg of total RNA using a 2-pmol mixture of reverse primers, 100 ng of random hexamers, and SuperScript III Reverse Transcriptase first-strand kit (Invitrogen, Carlsbad, CA). The reaction was held at 55°C for 60 minutes, followed by a 15-minute step at 70°C. The cDNA was washed on a QIAquick PCR purification column (Qiagen Inc., Valencia, CA) and was stored at −80°C in 25 mmol/L Tris-Cl, 1 mmol/L ethylenediamine tetraacetic acid until qPCR analysis.
PCR Primer Evaluation
Primer sets were designed using LightCycler probe design software, version 2.0 (Roche Applied Science), which considers sequence alignments, primer stability, hairpins, primer melting temperatures, and primer-dimer interactions. Primer sets were selected to have a melting temperature >60°C and guanine-cytosine content >50% and to generate a PCR amplicon <100 bp. BLAST (Basic Local Alignment Search Tool; http://blast.ncbi.nlm.nih.gov/Blast.cgi, last accessed May 22, 2013) and BLAT (BLAST-Like Alignment Tool; http://genome.ucsc.edu/cgi-bin/hgBlat?command=start, last accessed May 22, 2013) searches were performed to check for uniqueness, including the presence of amplifiable pseudogenes. Final selection of primer sets was based on the following criteria: i) target crossing point <30 using 10 ng of cDNA from a pool of FFPE lung cancers, ii) PCR efficiency >1.7, iii) no primer-dimers in the presence of template, and iv) no primer-dimers in negative template control before cycle 38. All the primer sets are tested using SYBR green I (Roche Applied Science, Indianapolis, IN) to assess the efficiency of PCR and the presence of primer-dimers. Melting curve analysis was used to distinguish primer-dimer formation from specific product. An average of two primer pairs were designed per gene target to obtain one pair that passed previously described criteria.21 Each primer set was tested from a pool of cDNA from different lung tissue types, and performance was evaluated using previously described criteria.21
RT-qPCR
Each 5-μL PCR included twofold concentrated LightCycler 480 SYBR green I master mix (Roche Applied Science) and 2.5 ng (1.25 ng/μL) of cDNA. Liquid handling for loading 384-well plates was performed using the Evolution P3 precision pipetting platform (PerkinElmer Ltd, Shelton, CT). Each run contained an internal 10-ng calibrator reference using cDNA made from human reference total RNA (catalog No. 750500; Stratagene, La Jolla, CA) and two small cell lung cultures. PCR amplification was performed in the LightCycler 480 (Roche Applied Science) using an initial denaturation step (95°C for 8 minutes) followed by 45 cycles of denaturation (95°C for 4 seconds), annealing (56°C for 6 seconds with a 2.5°C per second transition), and extension (72°C for 6 seconds with a 2°C per second transition). Fluorescence (530 nm) from the SYBR green I double-stranded DNA dye assay (Roche Applied Science) was acquired for each cycle after the extension step. The specificity of the PCR was determined by postamplification melting curve analysis. Reactions were automatically cooled to 65°C and were slowly heated at 2°C per second to 99°C while continuously monitoring fluorescence (10 acquisitions per 1°C). RT-qPCR assays were run in the laboratory of P.S.B. RT-qPCR analysis was performed in the laboratory of D.N.H.
RT-qPCR Data Processing
Gene expression was calculated using LC480 software, version 1.2.0.169 (Roche Applied Science). Relative gene expressions were calculated from an external standard curve made from a serial 10-fold dilution of glyceraldehyde-3-phosphate dehydrogenase (efficiency, 1.8) and correcting to the expression of the 10-ng calibrator. To control for variation in RNA quality, the expression of each gene was further normalized to the geometric mean of the housekeeping genes. Samples were processed in two batches; so, to remove differences between the batches, a batch correction procedure was applied that used adenocarcinomas because they were present in large numbers in both batches. The correction consisted of taking the adenocarcinoma mean expression of all genes from each batch, calculating the gene median differences between the batches, and subtracting these differences from all the samples in the second batch.
Training and Validation Design for the Histology Expression Predictor
A histology expression predictor (HEP) was developed from a training set and then was validated on three independent test sets (Supplemental Figure S1). Test specimens were partitioned into one of six exclusive groups. High tumor content specimens (minimum 50% tumor cellularity) were used to train the HEP (classifier development set) and to independently validate the HEP. The first independent validation set (single-block set) consisted of tumors that were reviewed by a panel of up to seven external pathologists. These separate reviews provided an estimate of histology diagnosis accuracy based on single-slide light microscopy review that could be compared with the accuracy of the HEP. The second independent validation set (dual-block set) included patients for which two separate blocks were available. For these cases, H&E sections from both blocks were reviewed by three external pathologists (nonoverlapping with pathologists reviewing the single-block set) who were blinded to the clinical histology diagnosis and to the cases from which blocks were derived. These blinded pathology reviews provided an estimate of the histology diagnosis precision in a case using single-slide microscopy review that could be compared with the HEP. These reviews were not intended to measure the routine clinical performance of pathologists because further materials (eg, a series of case slides, clinical history, and IHC analysis findings) were not provided to pathologists. Rather, these pathologist reviews enabled reference points for gauging the performance of the HEP. A third validation set (low tumor content) consisted of tumor specimens with infiltrating stromal cells composing >50% of the nuclei on the H&E section, consistent with quality control thresholds of large-scale genomic analysis projects.27 Assays with >10% missing expression data were set aside as failed assays. Specimens with a histologic type outside of the HEP scheme were set aside as the outside scheme set. Stromal specimens were set aside as the stromal set.
Histology Expression Predictor
The HEP was developed using tumors in the classifier development set. Tumors were randomly partitioned into a training set and a test set using a two-thirds to one-third split, respectively. Samples were selected so that each histologic type was distributed the same between the sets. A nearest-centroid predictor was developed from the training set by taking the median expression of each gene in each histologic type, resulting in four training centroids.28 Then, the mean expression of each gene across the training centroids was calculated (centroid gene means). The centroids and test set tumors were normalized by subtracting the centroid gene means. Pearson correlations were calculated between each tumor in the test set to the training centroids. Tumors in the test set were assigned a histology prediction corresponding to the maximally correlated training centroid. Correct predictions were defined as HEP calls matching the tumor’s clinical histology diagnosis. Accuracy was defined as the number of correct predictions divided by the number of all predictions. Agreement between the clinical diagnosis and the HEP was calculated by Fleiss’ κ. A minimum κ of 0.7 was used as a reference threshold for clinical utility.29 This process was repeated 1000 times to determine a Monte Carlo cross-validation error rate.30 Confidence intervals (CIs) for cross-validation were determined from the distribution of these iterations. After error rate calculation, this process was repeated a final time using all classifier development set tumors to build predictor centroids and calculate a total training error rate. Other CIs were calculated by bootstrapping (1000 iterations). The HEP centroids and accompanying data are available in Supplemental Tables S2, S3, S4, and S5.
Prediction Confidence
Prediction confidence was defined as a centroid silhouette width, (bi−ai)/max(bi,ai), where a is the 1 − Pearson correlation to a sample’s predicted histology centroid and b is the 1 − Pearson correlation to the histology centroid with the second greatest correlation. Prediction confidence values have a range of −1 to 1, with increasing values corresponding to increasing confidence.
Stromal Score
To determine whether a tumor’s expression is more similar to its predicted histology or to stromal lung, an expression contrast between each histology class and normal lung was built. A stromal lung centroid was calculated by taking gene expression means. The contrasts consisted of pairing each prenormalized histology centroid with the stromal centroid, determining the gene means of each pair, and subtracting these means from the stromal centroid to produce a stromal contrast centroid and gene means. After histology prediction, a tumor’s original expression was normalized by subtracting its corresponding stromal contrast gene means and calculating the Pearson correlation to its corresponding stromal contrast centroid to serve as its stromal score. Increasing stromal scores indicate an increasing stromal component in the tumor.
Pathologist Diagnosis
Board-certified pathologists were given digital images of H&E-stained slides of cases blinded to their clinical histology diagnosis. Using a previously described Internet-based form,7 pathologists diagnosed each case with a histology using the 44-class World Health Organization histologic type definition. To make the 44-class scheme comparable with the four histologies used by the HEP, the 44 types were mapped to adenocarcinoma, carcinoid, small cell, squamous cell, or other. Pathologist diagnoses were compared with the clinical diagnosis to determine accuracy. The pathologist histology scheme had a total of five types compared with the HEP scheme, which had four types, the difference being the other type. Under a five-class scheme, a random diagnosis is expected to have 20% accuracy, and under a four-class scheme, it is expected to be 25%. To make the pathologist scheme comparable with the four-class scheme, adjusted pathologist accuracy was calculated by adding 5% to the pathologist accuracy, which is the difference in random agreement between the schemes.
Statistical Tests
Spearman rank correlation tests evaluated the association of prediction accuracy with stromal scores and prediction confidence over all cross-validation training sets. Kruskal-Wallis tests were used to evaluate differences in stromal scores and prediction confidence among tumor sets.
Results
Marker Gene Selection
To obtain lung histologic class marker genes, we data-mined a previously published cohort (Bhattacharjee et al14) to identify differentially expressed genes capable of discriminating four lung cancer histologic types (adenocarcinoma, carcinoid, small cell, and squamous cell) and stromal lung. Six genes were identified that differentiated each of the following pairs: carcinoid versus other, small cell versus other, and stromal lung versus other (Supplemental Figure S2, A–C), giving a total of 18 genes. Sixteen genes were also selected that differentiated squamous cell carcinoma versus adenocarcinoma (Supplemental Figure S2D). Eighteen genes were identified that differentiated among the three adenocarcinoma expression subtypes (Supplemental Figure S2E). Last, five housekeeping genes were identified and used for normalization. In all, 57 genes were selected (Table 1). To test that these marker genes were capable of discriminating the histologic classes, a microarray-based HEP using the 52 marker genes was created using the Bhattacharjee et al14 microarray data set. Bhattacharjee et al14 specimens were classified using this predictor of 52 marker genes, and the resulting predictions had 85% accuracy (95% CI 81% to 89%) and a κ of 0.71 (95% CI 0.62 to 0.79) when testing for five classes (adenocarcinoma, carcinoid, small cell, stromal lung, and squamous cell), which represents training accuracy because the marker genes were selected using these same specimens. As an independent validation of the marker genes, the microarray-based predictor was applied to an independent cohort, Borczuk et al,18 and specimen predictions had an accuracy of 81% (95% CI 66% to 89%) and a κ of 0.71 (95% CI 0.53 to 0.84). Therefore, the marker genes were deemed capable of discriminating the lung specimen classes and were pursued further via translation into an RT-qPCR format that is compatible with RNA extracted from FFPE materials.
Table 1.
Marker Genes and Probes
| Symbol | Gene name | Forward primer | Reverse primer |
|---|---|---|---|
| Marker genes | |||
| ABCC5 | ATP-binding cassette, subfamily C (CFTR/MRP), member 5 | 5′-CAAGTTCAGGAGAACTCGAC-3′ | 5′-GGCATCAAGAGAGAGGC-3′ |
| ACVR1 | Activin A receptor, type I | 5′-ACTGGTGTAACAGGAACAT-3′ | 5′-AACCTCCAAGTGGAAATTCT-3′ |
| ALDH3B1 | Aldehyde dehydrogenase 3 family, member B1 | 5′-GGCTGTGGTTATGCGATAG-3′ | 5′-GATAAAGAGTTACAAGCTCCTCTG-3′ |
| ANTXR1 | Anthrax toxin receptor 1 | 5′-ACCCGAGGAACAACCTTA-3′ | 5′-TCTAGGCCTTGACGGAT-3′ |
| BMP7 | Bone morphogenetic protein 7 (osteogenic protein 1) | 5′-CCCTCTCCATTCCCTACA-3′ | 5′-TTTGGGCAAACCTCGGTAA-3′ |
| CACNB1 | Calcium channel, voltage-dependent, beta 1 subunit | 5′-CAGAGCGCCAGGCATTA-3′ | 5′-GCACAGCAAATGCCACT-3′ |
| CAPG | Capping protein (actin filament), gelsolin-like | 5′-GGGACAGCTTCAACACT-3′ | 5′-GTTCCAGGATGTTGGACTTTC-3′ |
| CBX1 | Chromobox homolog 1 (HP1 beta homolog Drosophila) | 5′-CCACTGGCTGAGGTGTTA-3′ | 5′-CTTGTCTTTCCCTACTGTCTTAC-3′ |
| CDH5 | Cadherin 5, type 2, VE-cadherin (vascular epithelium) | 5′-AAGAGAGATTGGATTTGGAACC-3′ | 5′-TTCTTGCGACTCACGCT-3′ |
| CDKN2C | Cyclin-dependent kinase inhibitor 2C (p18, inhibits CDK4) | 5′-TTTGGAAGGACTGCGCT-3′ | 5′-TCGGTCTTTCAAATCGGGATTA-3′ |
| CHGA | Chromogranin A (parathyroid secretory protein 1) | 5′-CCTGTGAACAGCCCTATG-3′ | 5′-GGAAAGTGTGTCGGAGAT-3′ |
| CIB1 | Calcium and integrin binding 1 (calmyrin) | 5′-CACGTCATCTCCCGTTC-3′ | 5′-CTGCTGTCACAGGACAAT-3′ |
| CLEC3B | C-type lectin domain family 3, member B | 5′-CCAGAAGCCCAAGAAGATTGTA-3′ | 5′-GCTCCTCAAACATCTTTGTGTTCA-3′ |
| CYB5B | Cytochrome b5 type B (outer mitochondrial membrane) | 5′-TGGGCGAGTCTACGATG-3′ | 5′-CTTGTTCCAGCAGAACCT-3′ |
| DOK1 | Docking protein 1, 62 kDa (downstream of tyrosine kinase 1) | 5′-CTTTCTGCCCTGGAGATG-3′ | 5′-CAGTCCTCTGCACCGTTA-3′ |
| DSC3 | Desmocollin 3 | 5′-GCGCCATTTGCTAGAGATA-3′ | 5′-CATCCAGATCCCTCACAT-3′ |
| FEN1 | Flap structure–specific endonuclease 1 | 5′-AGAGAAGATGGGCAGAAAG-3′ | 5′-CCAAGACACAGCCAGTAAT-3′ |
| FOXH1 | Forkhead box H1 | 5′-GCCCAGATCATCCGTCA-3′ | 5′-TTTCCAGCCCTCGTAGTC-3′ |
| GJB5 | Gap junction protein, beta 5 (connexin 31.1) | 5′-ACCACAAGGACTTCGAC-3′ | 5′-GGGACACAGGGAAGAAC-3′ |
| HOXD1 | Homeobox D1 | 5′-GCTCCGCTGCTATCTTT-3′ | 5′-GTCTGCCACTCTGCAAC-3′ |
| HPN | Hepsin (transmembrane protease, serine 1) | 5′-AGCGGCCAGGTGGATTA-3′ | 5′-GTCGGCTGACGCTTTGA-3′ |
| HYAL2 | Hyaluronoglucosaminidase 2 | 5′-ATGGGCTTTGGGAGCATA-3′ | 5′-GAACAAGTCAGTCTAGGGAATAC-3′ |
| ICA1 | Islet cell autoantigen 1, 69 kDa | 5′-GACCTGGATGCCAAGCTA-3′ | 5′-TGCTTTCGATAAGTCCAGACA-3′ |
| ICAM5 | Intercellular adhesion molecule 5, telencephalin | 5′-CCGGCTCTTGGAAGTTG-3′ | 5′-CCTCTGAGGCTGGAAACA-3′ |
| INSM1 | Insulinoma-associated 1 | 5′-ATTGAACTTCCCACACGA-3′ | 5′-AAGGTAAAGCCAGACTCCA-3′ |
| ITGA6 | Integrin, alpha 6 | 5′-ACGCGGATCGAGTTTGATAA-3′ | 5′-ATCCACTGATCTTCCTTGC-3′ |
| LGALS3 | Lectin, galactoside-binding, soluble, 3 (galectin 3) | 5′-TTCTGGGCACGGTGAAG-3′ | 5′-AGGCAACATCATTCCCTC-3′ |
| LIPE | Lipase, hormone-sensitive | 5′-CGCAAGTCCCAGAAGAT-3′ | 5′-CAGTGCTGCTTCAGACACA-3′ |
| LRP10 | Low-density lipoprotein receptor–related protein 10 | 5′-GGAACAGACTGTCACCAT-3′ | 5′-GGGAGCGTAGGGTTAAG-3′ |
| MAPRE3 | Microtubule-associated protein, RP/EB family, member 3 | 5′-GGCCAAACTAGAGCACGAATA-3′ | 5′-GTCAACACCCATCTTCTTGAAA-3′ |
| ME3 | Malic enzyme 3, NADP(+)-dependent, mitochondrial | 5′-CGCGGATACGATGTCAC-3′ | 5′-CCTTTCTTCAAGGGTAAAGGC-3′ |
| MGRN1 | Mahogunin, ring finger 1 | 5′-GAACTCGGCCTATCGCT-3′ | 5′-TCGAATTTCTCTCCTCCCAT-3′ |
| MYBPH | Myosin binding protein H | 5′-TCTGACCTCATCATCGGCAA-3′ | 5′-CTGAGTCCACACAGGTTT-3′ |
| MYO7A | Myosin VIIA | 5′-GAGGTGAAGCAAACTACGGA-3′ | 5′-CCCATACTTGTTGATGGCAATTA-3′ |
| NFIL3 | Nuclear factor, interleukin 3 regulated | 5′-ACTCTCCACAAAGCTCG-3′ | 5′-TCCTGCGTGTGTTCTACT-3′ |
| PAICS | Phosphoribosylaminoimidazole carboxylase, phosphoribosylaminoimidazole succinocarboxamide synthetase | 5′-AATCCTGGTGTCAAGGAAG-3′ | 5′-GACCACTGTGGGTCATTATT-3′ |
| PAK1 | p21/Cdc42/Rac1-activated kinase 1 (STE20 homolog, yeast) | 5′-GGACCGATTTTACCGATCC-3′ | 5′-GAAATCTCTGGCCGCTC-3′ |
| PECAM1 | Platelet/endothelial cell adhesion molecule (CD31 antigen) | 5′-ACAGTCCAGATAGTCGTATGT-3′ | 5′-ACTGGGCATCATAAGAAATCC-3′ |
| PIK3C2A | Phosphoinositide-3-kinase, class 2, alpha polypeptide | 5′-GGATTTCAGCTACCAGTTACTT-3′ | 5′-AGTCATCATGTACCCAGCA-3′ |
| PLEKHA6 | Pleckstrin homology domain containing, family A member 6 | 5′-TTCGTCCTGGTGGATCG-3′ | 5′-CCCAGGATACTCTCTTCCTT-3′ |
| PSMD14 | Proteasome (prosome, macropain) 26S subunit, non-ATPase, 14 | 5′-AGTGATTGATGTGTTTGCTATG-3′ | 5′-CACTGGATCAACTGCCTC-3′ |
| SCD5 | Stearoyl-CoA desaturase 5 | 5′-CAAAGCCAAGCCACTCACTC-3′ | 5′-CAGCTGTCACACCCAGAGC-3′ |
| SFN | Stratifin | 5′-TCAGCAAGAAGGAGATGCC-3′ | 5′-CGTAGTGGAAGACGGAAA-3′ |
| SIAH2 | Seven in absentia homolog 2 (Drosophila) | 5′-CTCGGCAGTCCTGTTTC-3′ | 5′-CGTATGGTGCAGGGTCA-3′ |
| SNAP91 | Synaptosomal-associated protein, 91-kDa homolog (mouse) | 5′-GTGCTCCCTCTCCATTAAGTA-3′ | 5′-CTGGTGTAGAATTAGGAGACGTA-3′ |
| STMN1 | Stathmin 1/oncoprotein 18 | 5′-TCAGAGTGTGGTCAGGC-3′ | 5′-CAGTGTATTCTGCACAATCAAC-3′ |
| TCF2 | Transcription factor 2, hepatic; LF-B3; variant hepatic nuclear factor | 5′-ACACCTGGTACGTCAGAA-3′ | 5′-TCTGGACTGTCTGGTTGAAT-3′ |
| TCP1 | T-complex 1 | 5′-ATGCCCAAGAGAATCGTAAA-3′ | 5′-CCTGTACACCAAGCTTCAT-3′ |
| TFAP2A | Transcription factor AP-2 alpha (activating enhancer binding protein 2 alpha) | 5′-GTCTCCGCCATCCCTAT-3′ | 5′-ACTGAACAGAAGACTTCGT-3′ |
| TITF1 | Thyroid transcription factor 1 | 5′-ATGAGTCCAAAGCACACGA-3′ | 5′-CCATGCCCACTTTCTTGTA-3′ |
| TRIM29 | Tripartite motif–containing 29 | 5′-TGAGATTGAGGATGAAGCTGAG-3′ | 5′-CATTGGTGGTGAAGCTCTTG-3′ |
| TUBA1 | Tubulin, alpha 1 | 5′-CCGACTCAACGTGAGAC-3′ | 5′-CGTGGACTGAGATGCATT-3′ |
| Housekeeping genes | |||
| CFL1 | Cofilin 1 (nonmuscle) | 5′-GTGCCCTCTCCTTTTCG-3′ | 5′-TTCATGTCGTTGAACACCTTG-3′ |
| EEF1A1 | Eukaryotic translation elongation factor 1 alpha 1 | 5′-CGTTCTTTTTCGCAACGG-3′ | 5′-CATTTTGGCTTTTAGGGGTAG-3′ |
| RPL10 | Ribosomal protein L10 | 5′-GGTGTGCCACTGAAGAT-3′ | 5′-GGCAGAAGCGAGACTTT-3′ |
| RPL28 | Ribosomal protein L28 | 5′-GTGTCGTGGTGGTCATT-3′ | 5′-GCACATAGGAGGTGGCA-3′ |
| RPL37A | Ribosomal protein L37a | 5′-GCATGAAGACAGTGGCT-3′ | 5′-GCGGACTTTACCGTGAC-3′ |
Paraffin Sample Set
A surgical incident cohort was collected from historical lung cancer paraffin specimens at the University of North Carolina at Chapel Hill and the University of Utah for a total of 442 specimens (Table 2). Patient clinical characteristics were highly similar between the two institutions, with no major differences except in tumor cellularity, which was greater in tumors from the University of North Carolina at Chapel Hill. The four predictor histologic types composed most cases. A small proportion (9%) had other histologic types.
Table 2.
Clinical Characteristics of the FFPE Cohort
| Characteristic | University of North Carolina | University of Utah | Total |
|---|---|---|---|
| Total No. of specimens | 350 | 92 | 442 |
| Gene detection rate (10th, 50th, and 90th percentiles) | 83, 97, 100 | 93, 98, 100 | 85, 97, 100 |
| Within sample gene detection rate (10th, 50th, and 90th percentiles) | 83, 97, 99 | 91, 99, 100 | 85, 98, 99 |
| Tumor specimen histology | |||
| Adenocarcinoma | 144 | 28 | 172 |
| Carcinoid | 28 | 11 | 39 |
| Small cell carcinoma | 18 | 0 | 18 |
| Squamous cell carcinoma | 94 | 13 | 107 |
| Other types | 25 | 8 | 33 |
| Tumor necrosis (median %) | 15 | 15 | 15 |
| Tumor fibrosis (median %) | 10 | 15 | 10 |
| Tumor cellularity (median %) | 80 | 65 | 80 |
| Normal specimens matched tumor histology | |||
| Adenocarcinoma | 17 | 20 | 37 |
| Carcinoid | 5 | 0 | 5 |
| Small cell carcinoma | 1 | 0 | 1 |
| Squamous cell carcinoma | 13 | 9 | 22 |
| Other types | 5 | 3 | 8 |
| Tissue type | |||
| Gross resection | 335 | 92 | 427 |
| Small-volume biopsy | 6 | 0 | 6 |
| Lymph node | 9 | 0 | 9 |
| Special IHC stains used in clinical diagnosis | 70 | 0 | 70 |
| Sex | |||
| Female | 132 | 35 | 167 |
| Male | 177 | 22 | 199 |
| Stage | |||
| I | 153 | 34 | 187 |
| II | 58 | 6 | 64 |
| III | 38 | 13 | 51 |
| IV | 4 | 1 | 5 |
| Grade | |||
| Poor | 88 | 24 | 112 |
| Moderate | 131 | 16 | 147 |
| Well | 19 | 2 | 21 |
| Smoking | |||
| Nonsmoker | 25 | 2 | 27 |
| Smoker | 235 | 45 | 280 |
Values are specimen counts except for those labeled as percentiles or median values. For the cases that provided matched normal specimens, the distribution of the tumor histologies is presented. The number of cases in which IHC analysis was used in the clinical diagnosis is presented, and this is a subset of the number of tumor cases. Some clinical data were missing, so not all clinical features sum to the total.
Probes were designed for the 57 genes (Table 1). RT-qPCR gene expression of nearly all the genes was detected across samples, with the median gene having detectable values for 97% of specimens (Table 2 and Supplemental Figure S3). Expression of BMP7 was not detected in 41% of samples and was removed from further analysis. Within samples, a high rate of detectable expression was achieved, with the median sample having 98% of genes detected. Fourteen specimens with >15 genes having no detectable expression were removed from analysis (failed assay). Gene detectability was not associated with histology or tumor characteristics, including tumor cellularity, necrosis, fibrosis, or the age of the sample. Therefore, the RT-qPCR assay could robustly detect gene expression in lung tumor specimens of variable quality and age.
Predictor Development
The classifier development specimen set (Supplemental Figure S1) was used to develop an RT-qPCR HEP and to evaluate its performance by Monte Carlo cross-validation. The predictor exhibited a mean 84% (95% CI 75% to 93%) test set accuracy and surpassed the objective target for clinically useful diagnostic reproducibility of κ> 0.7, achieving a mean κ of 0.77 (95% CI 0.64 to 90) over 1000 test set iterations. All histologic types were predicted with high accuracy, although the accuracy was highest for carcinoid and small cell carcinoma, although relatively fewer of these histologic types were assessed (Figure 1A). Among the cross-validation iterations, prediction confidence was significantly and positively correlated with prediction accuracy (Spearman rank correlation on tertiles of confidence and accuracy, rho = 0.85, P < 0.001) (Figure 1A). Also, stromal score was significantly negatively correlated with prediction accuracy (Spearman rank correlation on tertiles of stromal score and accuracy, rho = −0.81, P < 0.001) (Figure 1A). The confidence and stromal scores provide information about the overall quality of the sample that would be useful for clinical application.
Figure 1.

HEP performance. A: Performance of the cross-validation iterations (n = 1000). Prediction confidence and stromal score tertiles were assigned in each cross-validation iteration. Tertile accuracies over all the iterations are displayed. Data are shown as means (95% CIs). B: Total training performance for the final predictor applied to the predictor development tumor set. Each column represents one tumor specimen. NA, not assessed.
After predictor performance was estimated, all the training set tumors were used to make a final predictor. This predictor was then applied to the entire classifier set to estimate training performance (Figure 1B). Training prediction accuracy (87%; 95% CI 81% to 92%) and κscore (0.81; 95% CI 0.72 to 0.89) were similar to the accuracy estimated by cross-validation. When there were discrepancies between predicted tumor histology and the clinical diagnosis, these were generally associated with lower prediction confidence, higher stromal scores, or both. These results suggested that estimates of prediction confidence and stromal scores could be factored into the interpretation of a predicted class. In some cases, the predicted histology differed from the clinical diagnosis but was associated with high confidence in the divergent prediction. In summary, genes selected from microarrays enabled accurate prediction of histologic types by RT-qPCR in paraffin specimens that was highly concordant with clinical diagnosis.
Independent Validation
The HEP was then applied to two independent validation sets so that HEP performance could be evaluated on separate sets of tumors and could be compared with pathologist histology diagnosis on the same tumor specimens. In the single-block validation set, tumor specimens were given histology classifications by a pathologist panel to compare the diagnostic performance of the HEP with multiple independent light microscopy reviews (Figure 2A). This experiment is an estimate of interobserver reproducibility of histology for these tumors viewed as single slides rather than as an entire clinical case. The mean accuracy (relative to the clinical diagnosis) of the pathologists was 68% (95% CI 56% to 76%), consistent with large historical morphology experiments on interobserver variability of this type.8 The adjusted pathologist accuracy for a four-category diagnosis was 73% (95% CI 61% to 81%). The HEP exhibited a similar accuracy of 78% (95% CI 69% to 88%). As before, high stromal scores or low prediction confidence values corresponded to lower accuracy. For most cases in which the HEP disagreed with the clinical diagnosis, at least one of the pathologists was concordant with the HEP. In one case, all the study pathologists and the HEP were in agreement but in disagreement with the clinical diagnosis (Figure 2A). Conversely, there was only one case in which the clinical diagnosis and the HEP disagreed and the pathologists exhibited no disagreement with the clinical diagnosis. In summary, the HEP compared favorably with pathologists in a test of interobserver reproducibility of histology diagnosis.
Figure 2.

HEP compared with pathologist diagnosis. A: Single-block independent validation set results. Columns represent the same tumor specimen. Pathologist diagnoses of these same specimens are indicated by the bar graph in which the height of each colored bar represents the portion that the specimen was diagnosed as having a histology of corresponding color. In one case (marked with an asterisk), all the study pathologists and the HEP were in agreement but in disagreement with the clinical diagnosis. B: Dual-block independent validation set results. Tumor replicate specimens (blocks) are indicated by black vertical bars.
In the dual-block validation set, tumor specimens were histologically diagnosed by three pathologists and the HEP (Figure 2B). This experiment estimates intraobserver reliability of histologic diagnosis for the HEP across a block pair in the same tumor. The experiment is standardized for the difficulty of each paired sample by obtaining multiple reviews by light microscopy from pathologists blinded to the paired nature of the samples. Precision was defined as the percentage of cases in which a classifier (either HEP or a pathologist) reported the same histology for both tumor blocks in a case. The pathologists had 68%, 68%, and 44% case precision, yielding a mean precision of 60% (95% CI 44% to 68%). The pathologist case precision adjusted for the four-class scheme was 65% (95% CI 49% to 73%). The HEP had a precision of 92% (95% CI 80% to 100%), indicating that it made highly consistent calls among blocks from the same tumor.
Impact of Sample Quality on Prediction Accuracy
To assess the impact of specimen quality, specifically low tumor cellular content, the HEP was applied to the independent set of samples with low tumor content (cellularity, <50%) (Figure 3). Prediction accuracy remained almost as high as in samples deemed to be of high quality (accuracy, 81%; 95% CI 73% to 89%; κ = 0.70, 95% CI 0.56 to 0.82). Consistent with the low tumor content set’s definition of <50% tumor cellularity, stromal scores were found to be significantly greater in the low tumor content set (mean, −0.42) compared with the high-quality classifier development set (mean, −0.25) (Kruskal-Wallis P < 0.001). A reduction in prediction confidence was also found in the low tumor content set (mean, 0.32) compared with the high-quality classifier development sets (mean, 0.40) (Kruskal-Wallis P < 0.01), although this difference in confidence is not as large as the difference in stromal scores. As in classifier development, inaccurate predictions exhibited lower prediction confidence than did accurate predictions. Therefore, these data support that the lower limit of tumor cellularity for confident RT-qPCR histology prediction is <50% and that prediction confidence can be effectively used in interpreting predictions.
Figure 3.
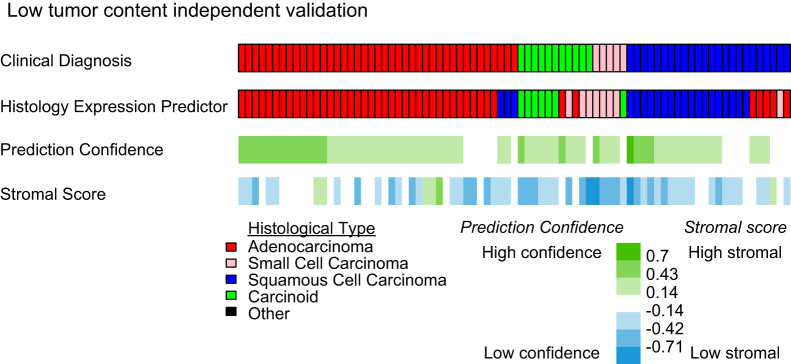
Prediction in specimens with low tumor content. The results for the low tumor content independent validation set are displayed. Each column represents one tumor specimen.
Finally, the predictor was applied to two other tumor sets relevant in clinical settings: specimens with high rates of failed gene amplification (failed assay) and specimens that are outside the scope of the HEP (outside scheme), such as metastatic tumors or large cell carcinomas (Supplemental Figure S4). Prediction accuracy and confidence were low for the failed assay set, indicating that failed assays should be viewed with caution. Outside scheme tumors also had low confidence, further supporting that prediction confidence is helpful in identifying mispredicted specimens.
Comparison with Special Stains
Consistent with what has long been considered good clinical practice, the most recent consensus recommendations for the classification of lung adenocarcinomas recommend that “[i]f the tumor cannot be classified based on light microscopy alone, special studies such as immunohistochemistry and/or mucin stains should be applied to classify the tumor further.”24, p245 To investigate cases that were considered diagnostically uncertain by light microscopy alone, we abstracted data on the use of IHC staining as reported by the clinical pathology reports of patients in the present study. In approximately 22% of all cases, there was a report of at least one special stain in the clinical pathology report. We are unaware of other published data on the rates of special stain use in a clinical cases series such as this one; however, use in this range would be consistent with previous published rates at which pathologists reported low confidence in a diagnosis based on findings from light microscopy of grossly resected tumors.7,24 As expected, given the lack of consensus recommendation, a wide range of markers and standards were used (33 individual stains and markers). The most commonly reported consideration when a marker was used was to support a suspected diagnosis of non–small cell lung cancer (NSCLC) or NSCLC variant, such as lung adenocarcinoma or lung squamous cell carcinoma (50%). Other common uses were to evaluate a suspected metastasis of extrathoracic primary tumor (22%), neuroendocrine tumor (22%), infectious etiology (17%), or other specifically mentioned diagnoses (14%). It was not always possible to decipher the diagnostic intent of every case. Some reports considered multiple markers.
To standardize the use of special stains in this cohort, we had tumors scored for TTF-1 and p63, two popular markers for the detection of adenocarcinoma and squamous cell carcinoma, respectively, which are the most prevalent histologies of NSCLC. Of the 64 cases from the single-block validation data set with a clinical diagnosis of adenocarcinoma or squamous cell carcinoma, 8 (13%) failed to stain for either of the diagnostic markers TTF-1 or p63 (Figure 2A). Nine additional cases (14%) were evaluable for only one marker. Two additional tumors (3%) stained positively for both. In brief, limited staining or a failed staining pattern was observed in 31% of cases, consistent with previous technical reports. Ambiguous staining is not entirely uninterruptable for clinical use because many of these would be expected to be lung adenocarcinomas.26 However, limitations in technical performance illustrate the ongoing need for high-performance gold standard reagents inclusive of the full heterogeneity of NSCLC. However, for the sake of discrete comparison in the present example, we compare the HEP only with those 45 cases that are positive for either TTF-1 or p63 but not both. Compared with the clinical diagnosis, IHC analysis findings agreed in 93% of cases (95% CI 87% to 100%) and the HEP agreed in 91% of cases (95% CI 82% to 98%), suggesting outstanding agreement in the most unambiguous cases.
Discussion
In this study, we sought to predict the histologic diagnosis (adenocarcinoma, carcinoid, small cell, or squamous cell) of patient tumors by gene expression in clinically relevant specimens. These classes are each of particular importance in the clinical management of lung cancer as they have specific implications for patient therapeutic decisions. We were able to accomplish this goal of developing a robust HEP that uses routinely collected paraffin samples rather than research-grade frozen material. Using specimens with high tumor cellularity (>50%), we developed a predictor that exhibited high accuracy (84%) in cross-validation. Because specimen quality is a common concern in cancer studies14 and in developing cancer assays, we evaluated the predictor on an independent set of tumors with low tumor cellularity (<50%). The prediction performance (81% accuracy) was not a substantial reduction from the high tumor content set. Therefore, RT-qPCR gene expression can be used to accurately predict lung histology in specimens of low tumor cellularity without a significant reduction in performance. The implication of this result is that a greater number of patients can be eligible for RT-qPCR histology prediction because not all patient tumor specimens have high tumor cellularity. Such results warrant further evaluation in even more marginal specimens that are routinely collected in clinical practice, such as needle, endoscopic-guided, and other small-volume biopsies.
Because not only diagnosis but diagnostic confidence is important in clinical practice, we designed the predictor to also calculate a prediction confidence and a stromal score. These quality metrics reflect different properties of a tumor specimen’s expression: how well a specimen is predicted to be its histology versus another histology and how much of a stromal lung component is present in a tumor. Prediction accuracy was significantly and positively correlated with prediction confidence, which to our knowledge is the first demonstration of this relationship in cancer gene expression studies and could be used in setting cutoff points as to when to accept the result of an assay for patient use. Such objective confidence thresholds are generally lacking in current practice. Although stromal scores demonstrated slight negative trends with prediction accuracy, this was much less of a concern than might have been expected. This is encouraging as attempts to offer molecular diagnostics to patients whose tumors fail to meet the most rigorous standards of tissue purity. This histologic confidence estimation and stromal estimates could, in future studies, be shown to have clinical benefit and could suggest when to pursue additional tissue or other diagnostic modalities before offering definitive therapy based on a specific tumor histology.
Lung cancer histologic classification is officially based on pathologist light microscopy review of multiple sections of tumor.4 Recently, IHC protein stains have been proposed that correlate with the histologic classification24–26 and are sometimes used clinically; however, they are not part of the official histologic classification.4 To serve as an estimate of the diagnostic standard, we had pathologists classify one representative H&E slide from each case. The HEP was run using RNA extracted from the same tissue block as the representative slide to control for possible within-tumor variation. In the single-block validation set, HEP predicted the clinical histologic diagnosis at least as well as a panel of pathologists. In the dual-block validation set in which the precision of diagnoses were compared between two separate blocks from the same case, the HEP exhibited greater precision. Pathologists often have multiple slides from a case, and their performance might have improved with more slides. The present work is performed in an experimental setting and suggests favorable test characteristics. However, it remains to be seen how reproducible the approach is in a prospective clinical setting.
In the present study, we pursued an unbiased search for transcriptional markers of the morphologic classes of lung cancer, as described in Materials and Methods. In many cases, the list of candidates was in the thousands, with hundreds of excellent markers to choose from. In some cases, the unbiased search yielded markers that are among the most well characterized for the tumor types, such as the gene TTF-1 (otherwise known as TITF-1 or NKX2-1). In other cases, well-characterized markers, such as p63 for squamous cell carcinoma and CD56 for small cell carcinoma, did not rise to the absolute top of the unbiased search and they were not considered, although we anticipate that they might have been reasonable additions.
The present study was performed by profiling many samples for the same gene across several PCR plates (research settings) rather than profiling a single sample across many genes on the same plate, which would be done clinically. Because not all the samples were assayed at the same time, we observed a small but measureable batch effect by PCR plate such that technical performance improved slightly with batch correction. In clinical practice, a reference is included for each gene on the plate to correct for batch effect.31 In addition, future use of the HEP versus IHC panels must consider multiple factors, such as the ability of tissue and cost. Although reagent costs for the HEP are low (<$1 per gene), the actual cost to a commercial laboratory would likely be on the scale of other multigene molecular assays. It would be vital to determine the utility of such a test versus the added cost.
In the United States, it is estimated that up to 70% of patients are diagnosed as having NSCLC based on small-volume biopsy samples.24 Although such biopsies are proved to be useful for the purposes of distinguishing small cell lung cancer from NSCLC, they are limiting in the number and nature of special studies that can be performed. Accurate morphologic diagnosis, mutational assessment, and special stains are frequently difficult or impossible.24 Any assay that can address the use of small-volume biopsy specimens would, therefore, have the potential for immediate impact. A nucleic acid–based test such as the HEP offers an opportunity to use small-volume biopsy samples. In the setting of small-volume biopsy samples, it is important that the HEP compliment the need for mutational testing rather than compete for tissue. In fact, this is an advantage of the technology because it is possible to isolate DNA and RNA from the same specimen such that both assays can be performed from samples currently used for DNA testing only. In other words, the HEP does not increase the tissue requirement beyond what is already required for mutation testing. In fact, the net result may be a decrease in tissue requirements because tissue for special stains might not be required. The present study was designed with tissue requirements based on significant previous experience with a similar protocol in breast cancer.22,31,32 This experience suggested that 1 to 2 × 10-μm sections of a paraffin block from a grossly resected surgical case were nearly always sufficient to produce sufficient RNA to perform 100 PCRs on the LightCycler 480. The present study requested 4 × 10 μm of FFPE tissue scrolls from anatomical pathology based on previous experience primarily in breast cancer studies. However, in practice, sections from a single 10-μm section of lung cancer ranged from 200 to 1000 μm of RNA, an amount that was sufficient for RNA profiling. In no case was >2 × 10 μm of tissue used. The present study was not designed to primarily evaluate small biopsy samples. However, approximately 3% of the samples were from mediastinoscopies and endobronchial biopsies, and these samples were processed in an identical manner to the grossly resected tumors with overall similar results. The present experiment in lung cancer validates those input requirements, and initial experiments from smaller sections showed no degradation in performance. Rigorous evaluation of minimum input requirements in terms of cell number or RNA quantity was not a component of the present study. Future studies will focus on evaluating small-volume biopsy samples and randomized clinical trials to provide additional validation for possible clinical use.
In the present study, we compared the accuracy of a novel PCR-based assay to categorize lung cancer histologic subtypes with the standard of the clinical diagnosis. Comparison of molecular diagnostic with routine diagnosis, as we have done herein, is a widely used study design.24,26,33 By this measure, the HEP performs favorably compared with existing biomarkers and shows potential to advance clinical lung cancer care. The clearest promise would be if the assay performs well in future studies of small input material where routine biomarkers such as IHC are limiting. Unlike most studies, however, the present work includes multiple independent pathologist reviews of the histology from the case. The value of supplemental reviews relative to that obtained from the clinical pathology report is limited because the study pathologist lacks the complete case, clinical history, and special stains. Nonetheless, review of the data suggests that there may be insights gained by including additional pathologist reviews as we have done. For example, the approximately 15% to 20% of cases in which the HEP is discordant with the clinical diagnosis are highly overlapping with the most discordant independent reviews by light microscopy as well as discordant and uninformative cases by IHC analysis. In our experience, further characterization of such cases often fails to produce a consensus diagnosis. Similar rates of challenging cases have been observed in other large NSCLC data sets. For example, after careful screening by clinical diagnosis, a tumor bank pathologist, and central pathology review, the NIH-sponsored NSCLC tumor profiling projects have routinely seen the final expert pathology review reject 15% of tumors as belonging to the wrong histologic group.34 Recognition that NSCLC has a significant fraction of cases that are challenging to classify is important because the rate of correct classification is the outcome of studies such as we report in this article. Recognizing that some clinical cases are likely to be misclassified suggests that other outcome measures should be considered because classification by definition will underestimate the performance of the assay. One approach is to emphasize assay performance measures, such as reproducibility, as we do in the present study.
Accurate classification of lung cancer histology is vital to making correct treatment decisions for patients with this disease as there are indications for specific groups (ie, pemetrexed for adenocarcinomas) and indications against other groups (ie, no bevacizumab for squamous cell carcinomas). In direct contrast to its importance, there are few molecular tools to augment the clinical pathologist’s ability to make a diagnosis. This is particularly problematic given the challenges facing lung cancer pathologists, including heterogeneous samples that are frequently small and indeterminate in morphology. Herein, we presented a near-term potential tool that is a multigene predictor of histology based on a large body of preexisting data to make a reliable multiclass diagnostic prediction in clinically relevant patient specimens. We evaluated this technology in multiple independent patient cohorts totaling nearly 450 samples, providing a large amount of objective data on the HEP’s performance as a function of sample quality and assay quality.
Footnotes
Supported by a Ruth L. Kirschstein National Research Service Award Individual Fellowship from the National Cancer Institute (NIH F32CA142039 to M.D.W.) and by the Thomas G. Labreque Foundation through Joan’s Legacy Foundation.
M.D.W., J.M.S., and D.N.H. contributed equally to this work.
Disclosures: C.M.P., D.N.H., and P.S.B. have a provisional patent related to work described in this study. C.M.P. and D.N.H. have stock ownership and an advisory board position (D.N.H.) in GeneCentric Diagnostics. M.D.W. was a consultant for GeneCentric Diagnostics.
Contributor Information
D. Neil Hayes, Email: hayes@med.unc.edu.
Philip S. Bernard, Email: philip.bernard@hci.utah.edu.
Supplemental Data
Cohort stratification for HEP design and evaluation. Tumors were each assigned exactly one set. Sets are indicated by bold face. Three stromal specimens were in the failed assay set.
Lung marker genes and expression in the microarray cohort. Expression levels across the training set cohort and the area under the receiver operating characteristic curve (AUC) differential expression statistic are listed for each marker gene: carcinoid (A), stromal lung (B), small cell carcinoma (C), squamous cell carcinoma and adenocarcinoma (D), and adenocarcinoma subtype (E). Columns of AUC statistics correspond to comparisons of class A with class B. AUC values range from 0, indicating underexpression in class A compared with class B, to 1, indicating overexpression in class A compared with class B. Pink rectangles mark the AUC statistics that guided the manual gene selection process. These gene expression subtypes are taken from an earlier publication20; however, we recently published a more comprehensive description of the adenocarcinoma expression subtypes11 that readers interested in these subtypes should consult.
RT-qPCR gene expression. Gene expression is displayed for the training set of the FFPE cohort. Tumors are labeled with their clinical diagnosis and their HEP histology.
The HEP was applied to the failed assay (A) and outside scheme (B) sets. Each column represents one tumor specimen.
Supplemental Data
Supplemental material for this article can be found at http://dx.doi.org/10.1016/j.jmoldx.2013.03.007.
References
- 1.Parkin D.M., Bray F., Ferlay J., Pisani P. Global cancer statistics, 2002. CA Cancer J Clin. 2005;55:74–108. doi: 10.3322/canjclin.55.2.74. [DOI] [PubMed] [Google Scholar]
- 2.Johnson D.H., Fehrenbacher L., Novotny W.F., Herbst R.S., Nemunaitis J.J., Jablons D.M., Langer C.J., DeVore R.F., III, Gaudreault J., Damico L.A., Holmgren E., Kabbinavar F. Randomized phase II trial comparing bevacizumab plus carboplatin and paclitaxel with carboplatin and paclitaxel alone in previously untreated locally advanced or metastatic non-small-cell lung cancer. J Clin Oncol. 2004;22:2184–2191. doi: 10.1200/JCO.2004.11.022. [DOI] [PubMed] [Google Scholar]
- 3.Scagliotti G.V., Parikh P., von Pawel J., Biesma B., Vansteenkiste J., Manegold C., Serwatowski P., Gatzemeier U., Digumarti R., Zukin M., Lee J.S., Mellemgaard A., Park K., Patil S., Rolski J., Goksel T., de Marinis F., Simms L., Sugarman K.P., Gandara D. Phase III study comparing cisplatin plus gemcitabine with cisplatin plus pemetrexed in chemotherapy-naive patients with advanced-stage non-small-cell lung cancer. J Clin Oncol. 2008;26:3543–3551. doi: 10.1200/JCO.2007.15.0375. [DOI] [PubMed] [Google Scholar]
- 4.Travis WD, Brambilla E, Müller-Hermelink HK, Harris CC (Eds): World Health Organization Classification of Tumours: Pathology and Genetics of the Lung, Pleura, Thymus and Heart. Edited by WD Travis, E Brambilla, HK Müller-Hermelink, CC Harris. Lyon, France, IARC Press, 2004
- 5.Herbst R.S., Heymach J.V., Lippman S.M. Lung cancer. N Engl J Med. 2008;359:1367–1380. doi: 10.1056/NEJMra0802714. [DOI] [PMC free article] [PubMed] [Google Scholar]
- 6.Burnett R.A., Swanson Beck J., Howatson S.R., Lee F.D., Lessells A.M., McLaren K.M., Ogston S., Robertson A.J., Simpson J.G., Smith G.D., Tavadia H.B., Walker F. Observer variability in histopathological reporting of malignant bronchial biopsy specimens. J Clin Pathol. 1994;47:711–713. doi: 10.1136/jcp.47.8.711. [DOI] [PMC free article] [PubMed] [Google Scholar]
- 7.Grilley-Olson J.E., Hayes D.N., Moore D.T., Leslie K.O., Wilkerson M.D., Qaqish B.F., Hayward M.C., Cabanski C.R., Yin X., Socinski M.A., Stinchcombe T.E., Thorne L.B., Allen T.C., Banks P.M., Beasley M.B., Borczuk A.C., Cagle P.T., Christensen R., Colby T.V., Deblois G.G., Elmberger G., Graziano P., Hart C.F., Jones K.D., Maia D.M., Miller C.R., Nance K.V., Travis W.D., Funkhouser W.K. Validation of interobserver agreement in lung cancer assessment: hematoxylin-eosin diagnostic reproducibility for non-small cell lung cancer: the 2004 World Health Organization classification and therapeutically relevant subsets. Arch Pathol Lab Med. 2013;137:32–40. doi: 10.5858/arpa.2012-0033-OA. [DOI] [PMC free article] [PubMed] [Google Scholar]
- 8.Burnett R.A., Howatson S.R., Lang S., Lee F.D., Lessells A.M., McLaren K.M., Nairn E.R., Ogston S., Robertson A.J., Simpson J.G., Smith G.D., Tavadia H.B., Walker F. Observer variability in histopathological reporting of non-small cell lung carcinoma on bronchial biopsy specimens. J Clin Pathol. 1996;49:130–133. doi: 10.1136/jcp.49.2.130. [DOI] [PMC free article] [PubMed] [Google Scholar]
- 9.Kan Z., Jaiswal B.S., Stinson J., Janakiraman V., Bhatt D., Stern H.M., Yue P., Haverty P.M., Bourgon R., Zheng J., Moorhead M., Chaudhuri S., Tomsho L.P., Peters B.A., Pujara K., Cordes S., Davis D.P., Carlton V.E., Yuan W., Li L., Wang W., Eigenbrot C., Kaminker J.S., Eberhard D.A., Waring P., Schuster S.C., Modrusan Z., Zhang Z., Stokoe D., de Sauvage F.J., Faham M., Seshagiri S. Diverse somatic mutation patterns and pathway alterations in human cancers. Nature. 2010;466:869–873. doi: 10.1038/nature09208. [DOI] [PubMed] [Google Scholar]
- 10.Tonon G., Wong K.K., Maulik G., Brennan C., Feng B., Zhang Y., Khatry D.B., Protopopov A., You M.J., Aguirre A.J., Martin E.S., Yang Z., Ji H., Chin L., Depinho R.A. High-resolution genomic profiles of human lung cancer. Proc Natl Acad Sci U S A. 2005;102:9625–9630. doi: 10.1073/pnas.0504126102. [DOI] [PMC free article] [PubMed] [Google Scholar]
- 11.Wilkerson M.D., Yin X., Walter V., Zhao N., Cabanski C.R., Hayward M.C., Miller C.R., Socinski M.A., Parsons A.M., Thorne L.B., Haithcock B.E., Veeramachaneni N.K., Funkhouser W.K., Randell S.H., Bernard P.S., Perou C.M., Hayes D.N. Differential pathogenesis of lung adenocarcinoma subtypes involving sequence mutations, copy number, chromosomal instability, and methylation. PLoS One. 2012;7:e36530. doi: 10.1371/journal.pone.0036530. [DOI] [PMC free article] [PubMed] [Google Scholar]
- 12.Wilkerson M.D., Yin X., Hoadley K.A., Liu Y., Hayward M.C., Cabanski C.R., Muldrew K., Miller C.R., Randell S.H., Socinski M.A., Parsons A.M., Funkhouser W.K., Lee C.B., Roberts P.J., Thorne L., Bernard P.S., Perou C.M., Hayes D.N. Lung squamous cell carcinoma mRNA expression subtypes are reproducible, clinically important, and correspond to normal cell types. Clin Cancer Res. 2010;16:4864–4875. doi: 10.1158/1078-0432.CCR-10-0199. [DOI] [PMC free article] [PubMed] [Google Scholar]
- 13.Beer D.G., Kardia S.L., Huang C.C., Giordano T.J., Levin A.M., Misek D.E., Lin L., Chen G., Gharib T.G., Thomas D.G., Lizyness M.L., Kuick R., Hayasaka S., Taylor J.M., Iannettoni M.D., Orringer M.B., Hanash S. Gene-expression profiles predict survival of patients with lung adenocarcinoma. Nat Med. 2002;8:816–824. doi: 10.1038/nm733. [DOI] [PubMed] [Google Scholar]
- 14.Bhattacharjee A., Richards W.G., Staunton J., Li C., Monti S., Vasa P., Ladd C., Beheshti J., Bueno R., Gillette M., Loda M., Weber G., Mark E.J., Lander E.S., Wong W., Johnson B.E., Golub T.R., Sugarbaker D.J., Meyerson M. Classification of human lung carcinomas by mRNA expression profiling reveals distinct adenocarcinoma subclasses. Proc Natl Acad Sci U S A. 2001;98:13790–13795. doi: 10.1073/pnas.191502998. [DOI] [PMC free article] [PubMed] [Google Scholar]
- 15.Garber M.E., Troyanskaya O.G., Schluens K., Petersen S., Thaesler Z., Pacyna-Gengelbach M., van de Rijn M., Rosen G.D., Perou C.M., Whyte R.I., Altman R.B., Brown P.O., Botstein D., Petersen I. Diversity of gene expression in adenocarcinoma of the lung. Proc Natl Acad Sci U S A. 2001;98:13784–13789. doi: 10.1073/pnas.241500798. [DOI] [PMC free article] [PubMed] [Google Scholar]
- 16.Rohrbeck A., Neukirchen J., Rosskopf M., Pardillos G.G., Geddert H., Schwalen A., Gabbert H.E., von Haeseler A., Pitschke G., Schott M., Kronenwett R., Haas R., Rohr U.P. Gene expression profiling for molecular distinction and characterization of laser captured primary lung cancers. J Transl Med. 2008;6:69. doi: 10.1186/1479-5876-6-69. [DOI] [PMC free article] [PubMed] [Google Scholar]
- 17.Virtanen C., Ishikawa Y., Honjoh D., Kimura M., Shimane M., Miyoshi T., Nomura H., Jones M.H. Integrated classification of lung tumors and cell lines by expression profiling. Proc Natl Acad Sci U S A. 2002;99:12357–12362. doi: 10.1073/pnas.192240599. [DOI] [PMC free article] [PubMed] [Google Scholar]
- 18.Borczuk A.C., Gorenstein L., Walter K.L., Assaad A.A., Wang L., Powell C.A. Non-small-cell lung cancer molecular signatures recapitulate lung developmental pathways. Am J Pathol. 2003;163:1949–1960. doi: 10.1016/S0002-9440(10)63553-5. [DOI] [PMC free article] [PubMed] [Google Scholar]
- 19.Irizarry R.A., Hobbs B., Collin F., Beazer-Barclay Y.D., Antonellis K.J., Scherf U., Speed T.P. Exploration, normalization, and summaries of high density oligonucleotide array probe level data. Biostatistics. 2003;4:249–264. doi: 10.1093/biostatistics/4.2.249. [DOI] [PubMed] [Google Scholar]
- 20.Hayes D.N., Monti S., Parmigiani G., Gilks C.B., Naoki K., Bhattacharjee A., Socinski M.A., Perou C., Meyerson M. Gene expression profiling reveals reproducible human lung adenocarcinoma subtypes in multiple independent patient cohorts. J Clin Oncol. 2006;24:5079–5090. doi: 10.1200/JCO.2005.05.1748. [DOI] [PubMed] [Google Scholar]
- 21.Mullins M., Perreard L., Quackenbush J.F., Gauthier N., Bayer S., Ellis M., Parker J., Perou C.M., Szabo A., Bernard P.S. Agreement in breast cancer classification between microarray and quantitative reverse transcription PCR from fresh-frozen and formalin-fixed, paraffin-embedded tissues. Clin Chem. 2007;53:1273–1279. doi: 10.1373/clinchem.2006.083725. [DOI] [PubMed] [Google Scholar]
- 22.Szabo A., Perou C.M., Karaca M., Perreard L., Palais R., Quackenbush J.F., Bernard P.S. Statistical modeling for selecting housekeeper genes. Genome Biol. 2004;5:R59. doi: 10.1186/gb-2004-5-8-r59. [DOI] [PMC free article] [PubMed] [Google Scholar]
- 23.Ang M.K., Patel M.R., Yin X.Y., Sundaram S., Fritchie K., Zhao N., Liu Y., Freemerman A.J., Wilkerson M.D., Walter V., Weissler M.C., Shockley W.W., Couch M.E., Zanation A.M., Hackman T., Chera B.S., Harris S.L., Miller C.R., Thorne L.B., Hayward M.C., Funkhouser W.K., Olshan A.F., Shores C.G., Makowski L., Hayes D.N. High XRCC1 protein expression is associated with poorer survival in patients with head and neck squamous cell carcinoma. Clin Cancer Res. 2011;17:6542–6552. doi: 10.1158/1078-0432.CCR-10-1604. [DOI] [PMC free article] [PubMed] [Google Scholar]
- 24.Travis W.D., Brambilla E., Noguchi M., Nicholson A.G., Geisinger K.R., Yatabe Y. International association for the study of lung cancer/american thoracic society/european respiratory society international multidisciplinary classification of lung adenocarcinoma. J Thorac Oncol. 2011;6:244–285. doi: 10.1097/JTO.0b013e318206a221. [DOI] [PMC free article] [PubMed] [Google Scholar]
- 25.Thunnissen E., Beasley M.B., Borczuk A.C., Brambilla E., Chirieac L.R., Dacic S., Flieder D., Gazdar A., Geisinger K., Hasleton P., Ishikawa Y., Kerr K.M., Lantejoul S., Matsuno Y., Minami Y., Moreira A.L., Motoi N., Nicholson A.G., Noguchi M., Nonaka D., Pelosi G., Petersen I., Rekhtman N., Roggli V., Travis W.D., Tsao M.S., Wistuba I., Xu H., Yatabe Y., Zakowski M., Witte B., Kuik D.J. Reproducibility of histopathological subtypes and invasion in pulmonary adenocarcinoma: an international interobserver study. Mod Pathol. 2012;25:1574–1583. doi: 10.1038/modpathol.2012.106. [DOI] [PMC free article] [PubMed] [Google Scholar]
- 26.Tsuta K., Tanabe Y., Yoshida A., Takahashi F., Maeshima A.M., Asamura H., Tsuda H. Utility of 10 immunohistochemical markers including novel markers (desmocollin-3, glypican 3. S100A2, S100A7, and Sox-2) for differential diagnosis of squamous cell carcinoma from adenocarcinoma of the Lung. J Thorac Oncol. 2011;6:1190–1199. doi: 10.1097/JTO.0b013e318219ac78. [DOI] [PubMed] [Google Scholar]
- 27.Shedden K., Taylor J.M., Enkemann S.A., Tsao M.S., Yeatman T.J., Gerald W.L. Gene expression-based survival prediction in lung adenocarcinoma: a multi-site, blinded validation study. Nat Med. 2008;14:822–827. doi: 10.1038/nm.1790. [DOI] [PMC free article] [PubMed] [Google Scholar]
- 28.Dabney A.R. ClaNC: point-and-click software for classifying microarrays to nearest centroids. Bioinformatics. 2006;22:122–123. doi: 10.1093/bioinformatics/bti756. [DOI] [PubMed] [Google Scholar]
- 29.Landis J.R., Koch G.G. The measurement of observer agreement for categorical data. Biometrics. 1977;33:159–174. [PubMed] [Google Scholar]
- 30.Lee J.K. Wiley-Blackwell; Hoboken, NJ: 2010. Statistical Bioinformatics: A Guide for Life and Biomedical Science Researchers. [Google Scholar]
- 31.Bastien R.R., Rodriguez-Lescure A., Ebbert M.T., Prat A., Munarriz B., Rowe L., Miller P., Ruiz-Borrego M., Anderson D., Lyons B., Alvarez I., Dowell T., Wall D., Segui M.A., Barley L., Boucher K.M., Alba E., Pappas L., Davis C.A., Aranda I., Fauron C., Stijleman I.J., Palacios J., Anton A., Carrasco E., Caballero R., Ellis M.J., Nielsen T.O., Perou C.M., Astill M., Bernard P.S., Martin M. PAM50 breast cancer subtyping by RT-qPCR and concordance with standard clinical molecular markers. BMC Med Genomics. 2012;5:44. doi: 10.1186/1755-8794-5-44. [DOI] [PMC free article] [PubMed] [Google Scholar]
- 32.Parker J.S., Mullins M., Cheang M.C., Leung S., Voduc D., Vickery T., Davies S., Fauron C., He X., Hu Z., Quackenbush J.F., Stijleman I.J., Palazzo J., Marron J.S., Nobel A.B., Mardis E., Nielsen T.O., Ellis M.J., Perou C.M., Bernard P.S. Supervised risk predictor of breast cancer based on intrinsic subtypes. J Clin Oncol. 2009;27:1160–1167. doi: 10.1200/JCO.2008.18.1370. [DOI] [PMC free article] [PubMed] [Google Scholar]
- 33.Thunnissen E., Boers E., Heideman D.A., Grunberg K., Kuik D.J., Noorduin A., van Oosterhout M., Pronk D., Seldenrijk C., Sietsma H., Smit E.F., van Suylen R., von der Thusen J., Vrugt B., Wiersma A., Witte B.I., den Bakker M. Correlation of immunohistochemical staining p63 and TTF-1 with EGFR and K-ras mutational spectrum and diagnostic reproducibility in non small cell lung carcinoma. Virchows Arch. 2012;461:629–638. doi: 10.1007/s00428-012-1324-x. [DOI] [PubMed] [Google Scholar]
- 34.Hammerman P.S., Hayes D.N., Wilkerson M.D., Schultz N., Bose R., Chu A., Collisson E.A., Cope L., Creighton C.J., Getz G., Herman J.G., Johnson B.E., Kucherlapati R., Ladanyi M., Maher C.A., Robertson G., Sander C., Shen R., Sinha R., Sivachenko A., Thomas R.K., Travis W.D., Tsao M.S., Weinstein J.N., Wigle D.A., Baylin S.B., Govindan R., Meyerson M. Comprehensive genomic characterization of squamous cell lung cancers. Nature. 2012;489:519–525. doi: 10.1038/nature11404. [DOI] [PMC free article] [PubMed] [Google Scholar]
Associated Data
This section collects any data citations, data availability statements, or supplementary materials included in this article.
Supplementary Materials
Cohort stratification for HEP design and evaluation. Tumors were each assigned exactly one set. Sets are indicated by bold face. Three stromal specimens were in the failed assay set.
Lung marker genes and expression in the microarray cohort. Expression levels across the training set cohort and the area under the receiver operating characteristic curve (AUC) differential expression statistic are listed for each marker gene: carcinoid (A), stromal lung (B), small cell carcinoma (C), squamous cell carcinoma and adenocarcinoma (D), and adenocarcinoma subtype (E). Columns of AUC statistics correspond to comparisons of class A with class B. AUC values range from 0, indicating underexpression in class A compared with class B, to 1, indicating overexpression in class A compared with class B. Pink rectangles mark the AUC statistics that guided the manual gene selection process. These gene expression subtypes are taken from an earlier publication20; however, we recently published a more comprehensive description of the adenocarcinoma expression subtypes11 that readers interested in these subtypes should consult.
RT-qPCR gene expression. Gene expression is displayed for the training set of the FFPE cohort. Tumors are labeled with their clinical diagnosis and their HEP histology.
The HEP was applied to the failed assay (A) and outside scheme (B) sets. Each column represents one tumor specimen.