

Abstract
MAX8, a designer peptide known to undergo self-assembly following changes in temperature, pH, and ionic strength, has demonstrated usefulness for tissue engineering and drug delivery. It is hypothesized that the self-assembled MAX8 nanofiber structure consists of closed β-hairpins aligned into antiparallel β-sheets. Here, we report evidence from solid-state NMR spectroscopy that supports the presence of the hypothesized β-hairpin conformation within the nanofiber structure. Specifically, our 13C-13C two-dimensional exchange data indicate spatial proximity between V3 and K17, and 13C-13C dipolar coupling measurements reveal proximity between the V3 and V18 backbone carbonyls. Moreover, isotopic dilution of labeled MAX8 nanofibers did not result in a loss of the 13C-13C dipolar couplings, showing that these couplings are primarily intramolecular. NMR spectra also indicate the existence of a minor conformation, which is discussed in terms of previously hypothesized nanofiber physical cross-linking and possible nanofiber polymorphism.
Introduction
With known protein structures serving as inspiration, peptides have been designed to form nanostructures through stimuli-sensitive folding and self-assembly mechanisms (1,2). These designer peptides, capable of undergoing conformational transitions following changes in pH (3–11), temperature (12–18), ionic strength (19–22), enzyme concentration (23–27), or light exposure (28–32), have been investigated for applications in tissue engineering (7,23,25,28) and drug delivery (6,15,17,22). On a fundamental level, design of self-assembling peptide biomaterials challenges our basic understanding of protein folding and aggregation (3–5,10,11,14,16–18).
MAX8 is a promising self-assembling peptide designed by Schneider et al. (33). It is an amphiphilic molecule composed of 20 amino acids: VKVKVKVKVDPPTKVEVKVKV-NH2, where DP represents a proline with D-chirality for its Cα, and –NH2 refers to an amidated C-terminus. The two stretches of alternating hydrophilic K (or E) and hydrophobic V residues promote β-strand formation (34,35). The VDPPT motif is known to form a type II′ β-turn (36). This turn makes it possible for the β-strands of a MAX8 molecule to form a hairpin structure in which the β-strands are antiparallel. The formation of this β-hairpin in solution, however, would be hindered by repulsion between positively charged K side chains. Folding of MAX8 into a β-hairpin can be triggered through the addition of counterions. In particular, Dulbecco’s modified eagle medium (DMEM), a common cell culture medium, can initiate MAX8 self-assembly ostensibly because of its salt content. MAX8 nanofibers are hypothesized to consist of molecules in β-hairpin conformations assembled into extended antiparallel β-sheets. The minimal MAX8 nanofiber structural unit is believed to consist of two antiparallel β-sheets associated to form a hydrophobic core (33).
The hypothesized MAX8 nanofiber structure of Schneider et al. (33) is consistent with measurements of nanofiber dimension and secondary structure. Transmission electron microscopy (TEM) images of MAX8 nanofibers showed fibrils ∼3 nm in width, a dimension in line with the expected length of a MAX8 β-hairpin (33,34). Circular dichroism spectroscopy showed a transition from random coil to β-strand secondary structure following an increase in solution ionic strength (33). MAX8 differs from its parent peptide, MAX1, by the substitution K15E, which reduces the overall charge of the peptide. This substitution decreased the time to form β-sheets from 30 min to <1 min (33).
Here, we report site-specific atomic-level information on the MAX8 conformation within nanofibers. These results support the predominance of a closed β-hairpin conformation. Antiparallel β-sheets of aligned MAX8 molecules were built by molecular modeling, and predicted atomic configurations were tested by 13C solid-state NMR spectroscopy of MAX8 nanofiber samples. We present direct evidence for proximity of V3 and K17 as well as of the V3 and V18 backbone carbonyl (CO) atoms, as predicted by the molecular model of a β-hairpin. Although the major NMR signals are consistent with an ordered self-assembled β-hairpin structure, there is also evidence for a minor additional conformation.
Materials and Methods
The MAX8 peptide was synthesized with standard fluorenylmethylcarbonyl (Fmoc) synthesis procedures on a RINK amide resin (Anaspec, 0.4 meq/g) using an Applied Biosystems Model 433A Peptide Synthesizer with HBTU/HoBt activation. Fmoc-protected amino acids were purchased from Anaspec. For labeled samples (see Table 1), isotopically labeled Fmoc-protected amino acids were purchased from Cambridge Isotopes or Sigma-Aldrich.
Table 1.
Isotopic labeling for MAX8 nanofiber samples
| Sample | Isotopic labeling |
|---|---|
| A | Uniform 13C and 15N in V3, T12, and K17 |
| B | Unlabeled (natural abundance) |
| C | 13C on V3 CO |
| D | 13C on V3 CO and V18 CO |
| E | 10% 13C on V3 CO and V18 CO, 90% unlabeled |
The peptide was cleaved from the synthesis resin using a cleavage cocktail of 95% trifluoroacetic acid (TFA), 2.5% triisopropylsilane, and 2.5% deionized water (20 mL of cleavage solution per 1 g of resin-bound peptide) for 2 h. The peptide/cocktail mixture was filtered and then diluted 10-fold with ice-cold tert-butyl methyl ether. The suspension was then centrifuged at 5880 × g for 10 min at 4°C. The following cycle was repeated 4 times: the supernatant was discarded and the pellet was resuspended in ice-cold tert-butyl methyl ether followed by centrifugation. The peptide was then dried overnight in vacuum (∼10 mTorr) at room temperature.
The peptide was purified by high-performance liquid chromatography on a Beckman Coulter System Gold 125 Solvent Module with a System Gold 166 Detector and a Waters C18-bonded silica semipreparative column. Here, two solvents were used: 0.1% TFA in deionized water (Solvent A), and 10% deionized water, 90% acetonitrile, and 0.1% TFA (Solvent B). For each run, 10 mg of peptide was dissolved in 10 mL of Solvent A, filtered (VWR International 25 mm syringe filters with 0.2 μm polyethersulfone membrane), and loaded onto the column at a rate of 1 mL/min for 10 min. This was followed by 0% Solvent B for 2 min, a linear gradient from 0% to 22% Solvent B over 1 min, a linear gradient from 22% to 40% Solvent B over 18 min, and a linear gradient from 40% to 100% Solvent B over 5 min. The peptide began to elute off the column after 24 min (33% B). Purified solutions were frozen in liquid nitrogen and lyophilized using a Virtis Benchtop K Freeze Dryer. The purity of the peptide was verified using mass spectrometry on a Jeol Accutof JMS-T100LC Mass Spectrometer with low-resolution and electrospray ionization (ESI+) settings.
MAX8 hydrogels were prepared at 0.5% (by weight) as previously described (33). In a 45 mL centrifuge tube, 1 mL of 25 mM HEPES, pH 7.4, was added to 10 mg of purified peptide. Self-assembly was initiated through the addition of 1 mL of DMEM supplemented with 25 mM HEPES, pH 7.4. After 48 h of self-assembly, nanofibers were removed from solution by centrifugation after diluting the hydrogel solution by filling the 45 mL centrifuge tube with deionized water. Following centrifugation, the supernatant was discarded and the pellet was frozen in liquid nitrogen. Samples were lyophilized using a Virtis Benchtop K Freeze Dryer. Each solid-state NMR sample contained between 5 and 10 mg of lyophilized nanofibers. Each NMR sample was rehydrated with ∼1 μL of water per mg of peptide after packing in solid-state NMR rotors.
A Bruker Avance III 11.75 Tesla (500 MHz 1H NMR frequency) spectrometer equipped with a 2.5 mm Bruker magic angle spinning (MAS) probe was used for all solid-state NMR experiments, including 1H-13C cross-polarization magic angle spinning (CPMAS) (37), two-dimensional (2D) 13C-13C finite pulse radio frequency driven recoupling (fpRFDR) (38), 2D 13C-13C dipolar-assisted rotational resonance (DARR) (39,40), and 13C-13C PITHIRDS-CT (41). All reported 13C chemical shifts are relative to the NMR frequency of tetramethylsilane, calibrated through measurement of CO 13C-labeled crystalline glycine. The CO signal of glycine is at 176.5 ppm, as calibrated using adamantane. The CO-labeled glycine was also used to calibrate the magic angle. CPMAS 1H-13C spectra were acquired at 25 kHz MAS with ∼1.5 h and 15 h of signal averaging for Samples A and B, respectively. Simultaneous application of a constant 50 kHz radio frequency field on the 13C channel and a linear ramp in 1H pulse power between 60 and 120 kHz radio frequency field strength was used during the 1H-13C cross-polarization spinlock (2 ms contact time) for all NMR experiments. 110 kHz of 1H decoupling was applied using a two pulse phase modulation during the CPMAS and 2D NMR experiments (42). 2D fpRFDR experiments were conducted at 25 kHz MAS with 5 μs π/2 flip back pulses, 13.3 μs π pulses (1/3 of the rotor period) during the 1.28 ms recoupling period (32 rotor periods), and 110 kHz of two pulse phase modulation 1H decoupling during the 13C-13C recoupling. A 2 s recycle delay was used between scans. The major signals in the 2D fpRFDR spectra were clearly visible after 24 h of signal averaging. One week of signal averaging was used in an effort to visualize peaks for 13C-labeled sites within the minor conformation. 2D DARR experiments were conducted at 10 kHz MAS with mixing times of 500 ms. During exchange mixing periods, experiments required continuous irradiation with 1H field powers corresponding to 10 kHz nutation frequencies (equal to the MAS spinning rate). Approximately 4 days of signal averaging was used. PITHIRDS-CT measurements were conducted at 12.5 kHz MAS and 33.33 μs π pulses were applied during the 61.44 ms period of dipolar recoupling with k1 = 4 and k2 + k3 = 16, as defined by Tycko (41). 110 kHz field strength of continuous wave 1H decoupling was applied during the PITHIRDS-CT pulse sequence and 90 kHz of continuous wave 1H decoupling was used for acquisition. Signal averaging took ∼3 days, 12 h, and 1 week for Samples C, D, and E, respectively. PITHIRDS-CT data analysis included correction for undesired 13C natural abundance background signal. We calculated the relative contributions of the isotopically enriched and naturally abundant 13C signals, and subtracted the calculated natural abundance contribution from each data point for all PITHIRDS-CT curves. We assumed that natural abundance 13C signal does not decay in PITHIRDS-CT experiments.
For TEM, a 10 μL aliquot of MAX8 hydrogel was diluted by addition of 40 μL of deionized water 4 h after initiating self-assembly. The diluted solution was sonicated for 2 s in a bath sonicator. A 5 μL drop was applied to a carbon-coated copper grid (Ted Pella ultrathin carbon on holey support, 400 mesh copper grid). After 2 min, excess fluid was wicked from the grid surface with filter paper and 5 μL of deionized water was applied to rinse the surface. After 1 min, the water was wicked away and the sample was negatively stained with 5 μL of 2% (wt/vol) aqueous uranyl acetate for 1 min before wicking and allowing the grid to air dry.
The computer models for MAX8 β-sheets were generated by assembling β-hairpins. A β-hairpin model of the MAX8 molecule was built by combining three segments: β-strand I (1VKVKVKVK8), type II′ β-turn (9VDPPT12), and β-strand II (13KVEVKVKV20). β-strands I and II were first generated by Ambertools 1.5 with backbone ϕ and ψ angles around −123° and 123°, respectively, and then assembled in an antiparallel orientation with an interstrand spacing of 0.49 nm (43). Finally, the type II′ β-turn was generated by using Modeller (44). The above β-hairpin was replicated to generate antiparallel β-sheets containing 10 β-hairpins by satisfying the following conditions: strand-strand distance of 0.49 nm; valine residues lining up along the fiber axis; and maximum number of backbone hydrogen bonds between β-hairpins. Each model was then solvated in a 5 × 8 × 13 nm3 water box with NaCl at 0.15 M, and energy minimized for 50,000 steps in NAMD 2.8 (45). The energy minimized β-sheets were then used to provide atomic coordinates of 13C-labeled sites for PITHIRDS-CT simulations. The two β-sheet structures were well maintained in molecular dynamics simulations in which two β-sheets were associated to bury the valine side chains.
The SPINEVOLUTION software package was used to simulate PITHIRDS-CT experiments (46). The simulations included 8 13C atoms at coordinates predicted by models of MAX8 antiparallel β-sheets. The coordinates used for the SPINEVOLUTION simulations were selected based upon the labeling schemes for Samples C and D (Table 1). In these simulations, initial magnetization for all 13C atoms was on the xy plane before the PITHIRDS-CT pulses. Other parameters (magnetic fields, pulse timings, etc.) were chosen to match the experimental conditions. To minimize end effects for the limited 8-spin systems, SPINEVOLUTION dephasing curves each examine only magnetization of four central spins.
Results
TEM images of MAX8 nanofibers (Fig. 1) exhibit fibril widths of ∼3 nm. This dimension is consistent with that obtained previously and nanofiber morphologies appear similar suggesting the successful reproduction of MAX8 nanofibers (33). The nanofiber width is also consistent with the length of a MAX8 molecule folded into a β-hairpin structure (33,47).
Figure 1.
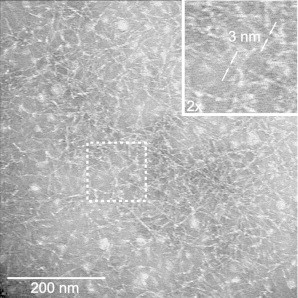
TEM image of MAX8 nanofibers negatively stained with 2% uranyl acetate. The inset shows a twofold magnified image of the region defined by the dashed white box.
Fig. 2 shows a 2D fpRFDR NMR spectrum from a MAX8 nanofiber sample isotopically labeled with uniform 13C and 15N in the V3, T12, and K17 residues (Sample A, Table 1). The signal/noise in this spectrum is illustrated using horizontal slices in Fig. S1 in the Supporting Material. Spectral assignments for 13C sites are illustrated with lines that connect diagonal signals and crosspeaks between directly bonded 13C atoms (some weak two-bond crosspeaks were also observed) (38). Peak positions, obtained through nonlinear fitting of crosspeaks to Gaussian functions, are listed in Table 2. Line widths were near 1.5 ppm (full width, half-maximum), similar to previously observed amyloid fibril line widths (48). For 13C atoms near the peptide backbone (CO, Cα, and Cβ) secondary structures are known to correlate with secondary shifts, i.e., deviations of 13C NMR peak positions from those of equivalent signals within random coil peptides (49). For V3 and K17, our observed negative secondary shifts of >1.5 ppm for the CO and Cα signals and positive secondary shifts of >2.4 ppm for Cβ signals are consistent with β-strand secondary structure (49). On the other hand, Cα and Cβ secondary chemical shifts for T12 are inconsistent with these trends, due to the proximity of T12 to the DPP hinge.
Figure 2.
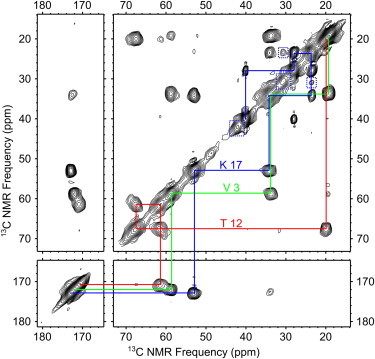
2D 13C-13C fpRFDR NMR spectrum for Sample A, with chemical shift assignment paths representing single-bond correlations. Dashed boxes indicate minor signals most likely associated with K17.
Table 2.
Peak positions based on 2D fpRFDR data
| Residue | CO | Cα | Cβ | Cγ1 | Cγ2 | Cδ | Cϵ |
|---|---|---|---|---|---|---|---|
| V3 | 172.0 (174.6) | 58.6 (60.5) | 33.7 (31.2) | 19.3 | 19.3 | – | – |
| T12 | 170.7 (173.0) | 61.5 (60.1) | 67.4 (68.1) | 19.9 | – | – | – |
| K17 | 172.9 (174.9) | 52.9 (54.5) | 34.1 (31.4) | 23.6 | – | 28.0 | 40.1 |
CO, Cα, and Cβ random coil chemical shifts are shown in parentheses. Estimated error: ±0.1 ppm.
Dashed boxes in Fig. 2 mark minor signals observed in the 2D fpRFDR NMR spectrum. Observed minor signals include crosspeaks between 30.7 and 23.7 ppm, as well as resolved signals at 42.0 and 30.7 ppm on the diagonal. We believe that the peaks on the diagonal at 42.0 and 30.7 ppm are too strong to be natural abundance background signals from unlabeled sites. Natural abundance signals are commonly observed on the diagonals of 2D NMR spectra, but they are expected to be 100 times weaker than peaks from 13C-labeled sites due to the 1% natural abundance of 13C. The probability of existence of adjacent pairs of natural abundance 13C atoms makes it nearly impossible to observe natural abundance crosspeaks; these signals would be 104-fold weaker than crosspeaks between labeled sites. Instead, we believe that minor signals are due to 13C-labeled sites within a subpopulation of MAX8 molecules in a conformation that differs from the major conformation. The diagonal peak at 48.9 ppm, in contrast, has an intensity that is consistent with natural abundance background. We do not have definitive assignments for the observed minor signals because they do not exhibit a complete set of crosspeaks expected for V, K, or T residues. Based on the chemical shifts, it is likely that the observed minor signals are due to K: the peak on the diagonal at 42.0 ppm could be due to K Cϵ and the crosspeaks could correspond to a K Cβ-Cγ or Cγ-Cδ transfer. Based on the relative intensities of the minor and major K Cϵ signals, we estimate that the minor signals account for 21 ± 8% of the total sample. Possible differences in 1H-13C cross-polarization efficiency for major and minor signals, due to differences in side-chain dynamics, could lead to error in this estimate.
In Fig. 3 we compare the CPMAS 13C NMR spectrum for Sample A to that of an unlabeled MAX8 nanofiber sample (Sample B, Table 1) and show the peak assignments. Because the NMR signals from the unlabeled sample are due to an evenly distributed 1% population of 13C (natural abundance), these signals correspond to roughly equal contributions from every C site in the sample. Therefore, although each peak from the labeled sample corresponds to a single 13C site, signals from V or K within the unlabeled sample correspond to overlapping signals from the 9 V and 7 K residues in the peptide. We observed agreement in positions for the V and K signals between these two samples within 0.1 ppm, indicating a uniform secondary structure within the VK repeats. Similar ratios of major and minor K signals between Samples A and B support the assignment of minor (as opposed to natural abundance) signals in Fig. 2 and suggest that K polymorphism occurs uniformly across the MAX8 amino acid sequence. When these peak positions were input into the TALOS software (50), the predicted ϕ and ψ backbone torsion angles were consistent with β-strand secondary structure for residues 1–8 and 13–20 (see Table S1). Signals observed only in the natural abundance spectrum at 48.7 and 26.4 ppm are assigned to P Cδ and P Cγ (51). NMR signals from the E15 residue are not resolved from other signals.
Figure 3.
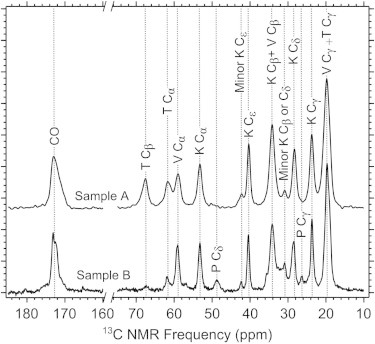
1H-13C CPMAS NMR spectra of Sample A and Sample B. Vertical dotted lines aid comparison of peak positions.
Evidence of a closed β-hairpin molecular conformation within MAX8 nanofibers was obtained through a 2D DARR 13C-13C NMR experiment on Sample A. The 2D DARR spectrum in Fig. 4 A exhibits crosspeaks between the V3 and K17 residues (circled). Selected horizontal slices corresponding to V3, T12, and K17 signals shown in Fig. 4 B further illustrate the polarization transfer between the V and K residues. We would expect an interresidue 2D DARR contact to be most sensitive to the closest interresidue 13C-13C distance; the β-hairpin model shown in Fig. 4 C predicts a distance of 0.48 nm between the CO sites of V3 and K17.
Figure 4.
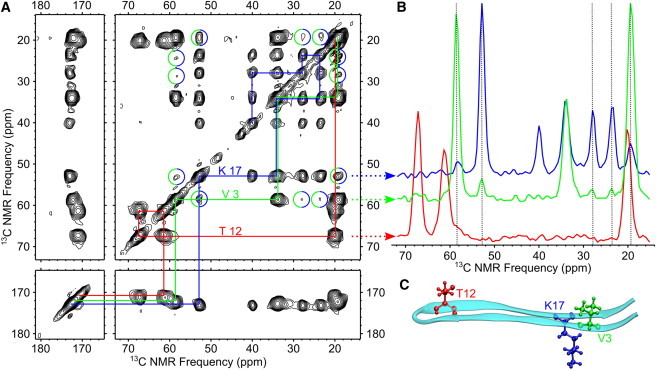
(A) 2D 13C-13C DARR NMR spectrum of Sample A showing long-range (up to ∼0.6 nm) contacts between labeled sites. Solid lines indicate single-bond assignment pathways for each 13C-labeled residue. Contacts between V3 and K17 are indicated with circles. (B) Horizontal slices at peak frequencies of V3 Cα, T12 Cβ, and K17 Cα signals. Vertical dotted lines indicate polarization transfers between the V3 and K17 signals. (C) A molecular model indicating relative positions of labeled residues within a β-hairpin.
To further test the hypothesized β-hairpin conformation, we performed 13C-13C dipolar recoupling NMR experiments using the PITHIRDS-CT technique on selectively 13C-labeled samples. In general, PITHIRDS-CT decays are dependent on the three-dimensional organization of dipolar coupled 13C nuclei and are dominated by nearest-neighbor internuclear distances (41). Our selective labeling included a sample with 13C labeling only on the V3 CO (Sample C, Table 1), a sample with 13C labeling on V3 CO and V18 CO (Sample D, Table 1), and a sample with 10% of molecules labeled with 13C on V3 CO and V18 CO and 90% unlabeled (Sample E, Table 1). Experimental data are compared to simulated PITHIRDS-CT decays (Fig. 5 A) performed on antiparallel β-sheet models with 1), adjacent β-hairpin turns on the same edge of the β-sheet (the “syn” configuration; Fig. 5 B) and 2), adjacent β-hairpin turns on opposite edges of the β-sheets (the “anti” configuration; Fig. 5 C). We also considered the expected behavior for two additional configurations for MAX8 molecules arranged in extended conformations corresponding to an open VDPPT hinge. The first we identify as an open hinge in-register parallel β-sheet, where the β-strands are aligned perpendicular to the fiber axis and all N-termini are on the same edge of the β-sheet (Table 3). The second is identified as an open hinge antiparallel β-sheet, where the N- and C-termini alternate along each edge of the β-sheet (Table 3). We observed minimal PITHIRDS-CT decay for Sample C, indicating that intermolecular distances between V3 CO sites must be above ∼0.7 nm. This result rules out the in-register parallel β-sheet configuration that is commonly observed for amyloid fibrils (Table 3) (52). Data for Sample D, in contrast, exhibit a significantly stronger decay, indicating shorter distances between the V3 CO and V18 CO. Sample E, with the same labels as Sample D but with a 10-fold isotopic dilution, exhibits a similar PITHIRDS-CT decay. Therefore, there was no change in internuclear distance between labeled V3 CO and V18 CO sites upon isotopic dilution; this result is only possible if the coupling is between nuclei within the same molecule as predicted for the β-hairpin conformation (Table 3). We validated our PITHIRDS-CT experiments by measuring the decay for Aβ (1–42) amyloid fibrils selectively 13C-labeled at the V36 CO site. The observed decay (Fig. S2) is consistent with the known geometry (0.5 nm 13C-13C distance) for in-register parallel β-sheets (53–56).
Figure 5.
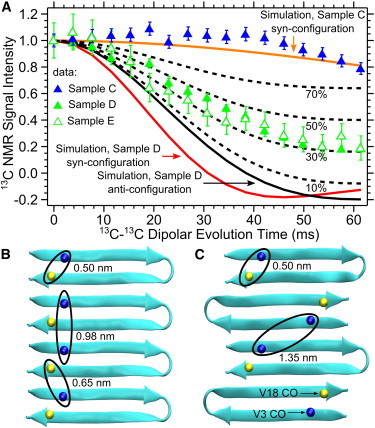
(A) PITHIRDS-CT NMR data for Samples C, D, and E. The solid curves show simulated behaviors for 8 13C nuclei at V3 CO and V18 CO positions within MAX8 β-sheets arranged as shown in panels B and C. Dashed curves show how the Sample D anti configuration curve is expected to change upon incorporation of the indicated percentages of MAX8 molecules in minor conformations that do not exhibit 13C-13C dipolar couplings. (B) A representation of a β-sheet with MAX8 β-hairpins arranged in the syn configuration. (C) An alternative β-sheet with MAX8 β-hairpins arranged in the anti configuration. V3 CO and V18 CO atoms are shown as spheres.
Table 3.
Expected decay strengths for PITHIRDS-CT 13C-13C dipolar recoupling experiments
| Configuration | Schematic | Sample C | Sample D | Sample E |
|---|---|---|---|---|
| Open hinge, in-register parallel β-sheet | Strong decay | Strong decay | Weak decay | |
| Open hinge, antiparallel β-sheet | Weak decay | Strong decay | Weak decay | |
| Closed hinge, β-hairpin |  |
Weak decay | Strong decay | Strong decay |
Strong decay refers to an 80% or larger reduction of signal intensity after 60 ms of recoupling. Weak decay refers to a 20% or smaller reduction of signal intensity after 60 ms of recoupling. The underlined predictions are not consistent with our experimental results (Fig. 5A).
Molecular modeling and simulated PITHIRDS-CT curves provided a basis for quantitative analysis of the experimental decays. We modeled two possible arrangements of MAX8 molecules: the syn-configuration (Fig. 5 B) or the anti-configuration (Fig. 5 C). For both models, we considered only intermolecular alignments that maximized hydrogen bonding. The solid curves in Fig. 5 A correspond to predictions based on 8-spin simulations of the PITHIRDS-CT experiment using the atomic coordinates in the molecular models depicted in Fig. 5, B and C. The PITHIRDS-CT decay for Sample C agrees with the simulated curves for both the syn- and anti-configurations (the anti-configuration simulated curve is not shown). The simulated curve for the syn-configuration, with a 0.98 nm distance between nearest V3 CO sites, has a very weak decay; the simulated curve for the anti-configuration, with an even longer 1.35 nm distance between nearest V3 CO sites, shows essentially no decay. Simulated curves for Sample D for syn- and anti-configurations are shown in Fig. 5 A. The simulated curve for the syn-configuration predicts a slightly faster decay compared to the simulated curve for the anti-configuration, but neither agrees well with the experimental data. As discussed below, we interpret the discrepancy between the experimental and simulated decays for Sample D in terms of polymorphic behavior resulting in a minor population of molecules which are not in the β-hairpin conformation. Each dashed curve in Fig. 5 A represents a prediction corresponding to an anti-configuration with the indicated percent abundance of molecules in the minor population. For this analysis, we assumed that signal from the minor population would exhibit no decay due to a lack of 13C-13C dipolar couplings between labeled sites. The dashed curves therefore suggest that the minor structure represents 33 ± 8% of the MAX8 molecules. A similar analysis based on a syn-configuration major structure (not shown) would predict a minor population at 28 ± 8%.
Discussion
This work represents a direct interrogation of MAX8 molecular structure within nanofibers. Although previous results from circular dichroism measurements established that MAX8 adopts a β-strand secondary structure, and β-hairpin dimensions are consistent with TEM nanofiber dimensions, these results include no site-specific information or interatomic distance measurements. Our NMR data support the hypothesized β-hairpin as the major conformation for MAX8 molecules within the nanofiber. This interpretation is based on 1), 13C NMR chemical shifts; 2), a contact between V3 and K17 as observed in the 2D DARR spectrum of Sample A; 3), weak 13C-13C dipolar couplings between V3 CO sites in Sample C; 4), strong 13C-13C dipolar couplings between V3 CO and V18 CO sites in Sample D; and 5), lack of an isotopic dilution effect on 13C-13C dipolar coupling between V3 CO and V18 CO sites (Sample E).
NMR measurements provide atomic-level constraints on the conformation of MAX8 molecules, making it possible to test the hypothesized β-hairpin conformation. Analysis of the 13C NMR chemical shifts indicates β-strand secondary structure for residues 1–8 and 13–20. The 2D DARR contact between V3 and K17 is consistent with a closed β-hairpin conformation, but this result alone does not rule out alternative β-sheet structures in which intermolecular packing brings V3 and K17 into close proximity. Alternative β-sheet structures could include parallel or antiparallel alignment of MAX8 molecules in extended conformations (open hinge; Table 3). Selective 13C labeling on V3 CO and V18 CO sites was employed so that PITHIRDS-CT experiments could be used to further test the β-hairpin conformation. Two possible arrangements of MAX8 β-hairpins (Fig. 5, B and C), within β-sheets predict distances between equivalent V3 CO sites to be 0.98 nm or larger because each molecule contributes two neighboring β-strands to the β-sheet. This distance is consistent with the weak PITHIRDS-CT decay observed for Sample C. In contrast, a much stronger dipolar coupling is observed for Sample D, consistent with the shorter distance predicted when both V3 CO and V18 CO sites are labeled with 13C. Any conformation with an extended VDPPT hinge could predict V3 CO proximity to V18 CO only between neighboring molecules; such a configuration would exhibit attenuated PITHIRDS-CT decay upon isotopic dilution (see Table 3). Sample E, which was isotopically diluted with 90% unlabeled MAX8, exhibits PITHIRDS-CT decay similar to that of Sample D, clearly indicating that this coupling is between nuclei within the same molecule. It should be noted that because PITHIRDS-CT decays are most sensitive to the shortest 13C-13C distances in a sample, we are unable to distinguish between syn and anti intermolecular β-hairpin configurations (Fig. 5, B and C), which could coexist. Fig. S3 shows an all-atom representation of a single MAX8 molecule in the β-hairpin conformation.
NMR data indicate that not all MAX8 molecules in the nanofiber samples adopt the same conformation. In the 2D fpRFDR (Fig. 2) and 1H-13C CPMAS (Fig. 3) spectra, minor signals most likely from K side chains are visible at distinct chemical shifts. Integration of the resolved K Cϵ signals suggests that the minor conformation accounts for 21 ± 8% of the total population. Minor signals are not observed for V3 or T12, possibly due to overlapping of major and minor signals. It is also possible that minor K NMR signals are due to alternative K side chain conformations within molecules that otherwise match the major conformation; minor V3 and T12 signals would not exist if structural heterogeneity were limited to K side chain conformations. It should be noted that the magnetic inequivalence predicted by Nielsen et al. (57) for neighboring β-strands within antiparallel β-sheets would not lead to peak splittings for MAX8; each MAX8 molecule contributes two neighboring β-strands to a β-sheet. However, inequivalence could result from interactions between different β-sheets within a nanofiber. The observed PITHIRDS-CT decays for Samples D and E show significant evidence of 13C-13C dipolar coupling between V3 CO and V18 CO sites, but observed decays are weaker than simulated curves (Fig. 5 A). As illustrated in Fig. S4, the PITHIRDS-CT data are not well represented by spin simulations that consider longer 13C-13C distances. We interpret the PITHIRDS-CT data in terms of the existence of MAX8 molecules in conformations that do not exhibit significant 13C-13C dipolar couplings. One possibility is a MAX8 molecule with only one β-strand (residues 1–8 or 13–20) inserted into the β-sheet; this configuration would not generate significant 13C-13C intra- or intermolecular dipolar couplings between V3 CO and V18 CO sites. Based on the analysis represented by the dashed lines in Fig. 5 A, the minor conformation would account for 33 ± 8% of the MAX8 molecules (also see dashed curve in Fig. S4). Although minor population estimates are similar between NMR spectra and PITHIRDS-CT observations, it is not clear if the 2D fpRFDR and PITHIRDS-CT measurements reflect the same minor conformation. Without the ability to separate most minor and major NMR signals, we are unable to provide more constraints on the minor conformation.
The existence of a minor conformation was predicted by Schneider, Pochan, and co-workers (33), who proposed that MAX8 nanofibers have physical cross-links, although alternative explanations exist. Evidence for permanent junction points between nanofibers has been found in rheological studies of MAX1 solutions (58); MAX1 and MAX8 are likely to have similar nanofiber structures. Observed crossing of nanofibers in TEM images of MAX1 or MAX8 has also been attributed to nanofiber cross-linking (33). The minor conformations evident in our NMR data could be attributed to conformational rearrangement at nanofiber junctions. However, our PITHIRDS-CT data indicate that minor conformations do not correspond to closed β-hairpins, contradicting the proposal that junctions correspond to interfacial association of closed β-hairpins. Furthermore, observation of minor NMR signals is not strongly supportive of molecular rearrangement at junction points: minor conformations are commonly observed in amyloid fibril samples and attributed to coexistence of fibrils with distinct molecular structures. These minor NMR signals can be eliminated through sample preparations designed to produce homogeneous samples, suggesting that minor conformations are not fundamental to the amyloid fibril structure (55,59,60). To our knowledge, no group has attributed polymorphic structure to structural rearrangements at amyloid fibril junction points. With amyloid fibrils, distinct structures are associated with distinct fibril TEM morphologies, but the greater thicknesses of amyloid fibrils (∼10 nm) compared to MAX8 nanofiber thicknesses (∼3 nm) make it easier to probe amyloid morphologies with TEM (48,53,55).
The β-hairpin major conformation observed in MAX8 nanofibers supports the idea that MAX8 β-hairpin formation is important to self-assembly. This hypothesis was pivotal to the design of the MAX8 peptide for salt-triggered self-assembly, but previous results did not prove that β-hairpins dominate the final nanofiber structure. Repulsion between like-charged K side chains at low ionic strength is believed to prevent self-assembly by deterring β-hairpin formation. However, there are other possible explanations for observed salt-triggered self-assembly. Salt is known to induce a transition from random coil to β-strand secondary structure (33); a secondary structural transition alone could explain salt-dependent kinetics. Furthermore, although ionic strength could promote β-hairpin formation by screening intramolecular repulsion between K side chains, ionic strength will also screen intermolecular repulsion between K side chains. In fact, oligopeptides without turns can also exhibit salt-sensitive self-assembly kinetics (61). Even if β-hairpin formation is critical to initiate self-assembly, β-hairpins may serve only as nuclei that could propagate through addition of extended MAX8 molecules. The observation that 60–75% of MAX8 molecules within nanofibers are in β-hairpin conformations contradicts the alternative hypotheses for self-assembly and suggests that the self-assembly mechanism is dominated by association of β-hairpins.
Acknowledgments
The authors acknowledge financial support from the National Science Foundation (DMR-105521 to A.K.P.) and the National Institutes of Health (GM88187 to H.X.Z.). Portions of this work were conducted at the National High Magnetic Field Laboratory (NHMFL) which is supported by the National Science Foundation Cooperative Agreement (DMR-0654118), the State of Florida, and the U.S. Department of Energy. A National High Magnetic Field Lab (NHMFL) User Collaboration Research Grant to A.K.P. also provided partial financial support for this research.
Supporting Material
References
- 1.Löwik D.W.P.M., Leunissen E.H.P., van Hest J.C.M. Stimulus responsive peptide based materials. Chem. Soc. Rev. 2010;39:3394–3412. doi: 10.1039/b914342b. [DOI] [PubMed] [Google Scholar]
- 2.Versluis F., Marsden H.R., Kros A. Power struggles in peptide-amphiphile nanostructures. Chem. Soc. Rev. 2010;39:3434–3444. doi: 10.1039/b919446k. [DOI] [PubMed] [Google Scholar]
- 3.Adhikari B., Palui G., Banerjee A. Self-assembling tripeptide based hydrogels and their use in removal of dyes from waste-water. Soft Matter. 2009;5:3452–3460. [Google Scholar]
- 4.Aggeli A., Bell M., Boden N. pH as a trigger of peptide beta-sheet self-assembly and reversible switching between nematic and isotropic phases. J. Am. Chem. Soc. 2003;125:9619–9628. doi: 10.1021/ja021047i. [DOI] [PubMed] [Google Scholar]
- 5.Altman M., Lee P., Zhang S.G. Conformational behavior of ionic self-complementary peptides. Protein Sci. 2000;9:1095–1105. doi: 10.1110/ps.9.6.1095. [DOI] [PMC free article] [PubMed] [Google Scholar]
- 6.Apostolovic B., Klok H.A. pH-sensitivity of the E3/K3 heterodimeric coiled coil. Biomacromolecules. 2008;9:3173–3180. doi: 10.1021/bm800746e. [DOI] [PubMed] [Google Scholar]
- 7.Hartgerink J.D., Beniash E., Stupp S.I. Self-assembly and mineralization of peptide-amphiphile nanofibers. Science. 2001;294:1684–1688. doi: 10.1126/science.1063187. [DOI] [PubMed] [Google Scholar]
- 8.Pagel K., Wagner S.C., Koksch B. Random coils, beta-sheet ribbons, and alpha-helical fibers: one peptide adopting three different secondary structures at will. J. Am. Chem. Soc. 2006;128:2196–2197. doi: 10.1021/ja057450h. [DOI] [PubMed] [Google Scholar]
- 9.Zhao Y., Yokoi H., Tan T. Self-assembled pH-responsive hydrogels composed of the RATEA16 peptide. Biomacromolecules. 2008;9:1511–1518. doi: 10.1021/bm701143g. [DOI] [PubMed] [Google Scholar]
- 10.Zimenkov Y., Dublin S.N., Conticello V.P. Rational design of a reversible pH-responsive switch for peptide self-assembly. J. Am. Chem. Soc. 2006;128:6770–6771. doi: 10.1021/ja0605974. [DOI] [PubMed] [Google Scholar]
- 11.Schneider J.P., Pochan D.J., Kretsinger J. Responsive hydrogels from the intramolecular folding and self-assembly of a designed peptide. J. Am. Chem. Soc. 2002;124:15030–15037. doi: 10.1021/ja027993g. [DOI] [PubMed] [Google Scholar]
- 12.Dong H., Hartgerink J.D. Role of hydrophobic clusters in the stability of alpha-helical coiled coils and their conversion to amyloid-like beta-sheets. Biomacromolecules. 2007;8:617–623. doi: 10.1021/bm060871m. [DOI] [PubMed] [Google Scholar]
- 13.Komori H., Inai Y. Control of peptide helix sense by temperature tuning of noncovalent chiral domino effect. J. Org. Chem. 2007;72:4012–4022. doi: 10.1021/jo0625305. [DOI] [PubMed] [Google Scholar]
- 14.Rajagopal K., Lamm M.S., Schneider J.P. Tuning the pH responsiveness of beta-hairpin peptide folding, self-assembly, and hydrogel material formation. Biomacromolecules. 2009;10:2619–2625. doi: 10.1021/bm900544e. [DOI] [PubMed] [Google Scholar]
- 15.Sallach R.E., Wei M., Chaikof E.L. Micelle density regulated by a reversible switch of protein secondary structure. J. Am. Chem. Soc. 2006;128:12014–12019. doi: 10.1021/ja0638509. [DOI] [PubMed] [Google Scholar]
- 16.Trabbic-Carlson K., Setton L.A., Chilkoti A. Swelling and mechanical behaviors of chemically cross-linked hydrogels of elastin-like polypeptides. Biomacromolecules. 2003;4:572–580. doi: 10.1021/bm025671z. [DOI] [PubMed] [Google Scholar]
- 17.Wang C., Stewart R.J., Kopecek J. Hybrid hydrogels assembled from synthetic polymers and coiled-coil protein domains. Nature. 1999;397:417–420. doi: 10.1038/17092. [DOI] [PubMed] [Google Scholar]
- 18.Zhang S.G., Rich A. Direct conversion of an oligopeptide from a beta-sheet to an alpha-helix: a model for amyloid formation. Proc. Natl. Acad. Sci. USA. 1997;94:23–28. doi: 10.1073/pnas.94.1.23. [DOI] [PMC free article] [PubMed] [Google Scholar]
- 19.Beyer R.L., Hoang H.N., Fairlie D.P. Metal clips induce folding of a short unstructured peptide into an alpha-helix via turn conformations in water. Kinetic versus thermodynamic products. J. Am. Chem. Soc. 2004;126:15096–15105. doi: 10.1021/ja0453782. [DOI] [PubMed] [Google Scholar]
- 20.Cerasoli E., Sharpe B.K., Woolfson D.N. ZiCo: a peptide designed to switch folded state upon binding zinc. J. Am. Chem. Soc. 2005;127:15008–15009. doi: 10.1021/ja0543604. [DOI] [PubMed] [Google Scholar]
- 21.Dublin S.N., Conticello V.P. Design of a selective metal ion switch for self-assembly of peptide-based fibrils. J. Am. Chem. Soc. 2008;130:49–51. doi: 10.1021/ja0775016. [DOI] [PubMed] [Google Scholar]
- 22.Pires M.M., Chmielewski J. Self-assembly of collagen peptides into microflorettes via metal coordination. J. Am. Chem. Soc. 2009;131:2706–2712. doi: 10.1021/ja8088845. [DOI] [PubMed] [Google Scholar]
- 23.Jun H., Yuwono V., Hartgerink J. Enzyme-mediated degradation of peptide-amphiphile nanofiber networks. Adv. Mater. 2005;17:2612–2617. [Google Scholar]
- 24.Kühnle H., Börner H.G. Biotransformation on polymer-peptide conjugates: a versatile tool to trigger microstructure formation. Angew. Chem. Int. Ed. Engl. 2009;48:6431–6434. doi: 10.1002/anie.200805768. [DOI] [PubMed] [Google Scholar]
- 25.Straley K.S., Heilshorn S.C. Dynamic, 3D-pattern formation within enzyme-responsive hydrogels. Adv. Mater. 2009;21:4148–4152. [Google Scholar]
- 26.Tuchscherer G., Chandravarkar A., Mutter M. Switch-peptides as folding precursors in self-assembling peptides and amyloid fibrillogenesis. Biopolymers. 2007;88:239–252. doi: 10.1002/bip.20663. [DOI] [PubMed] [Google Scholar]
- 27.Yang Z., Ma M., Xu B. Using matrix metalloprotease-9 (MMP-9) to trigger supramolecular hydrogelation. Soft Matter. 2009;5:2546–2548. [Google Scholar]
- 28.Haines L.A., Rajagopal K., Schneider J.P. Light-activated hydrogel formation via the triggered folding and self-assembly of a designed peptide. J. Am. Chem. Soc. 2005;127:17025–17029. doi: 10.1021/ja054719o. [DOI] [PMC free article] [PubMed] [Google Scholar]
- 29.Kusebauch U., Cadamuro S.A., Renner C. Photocontrolled folding and unfolding of a collagen triple helix. Angew. Chem. Int. Ed. Engl. 2006;45:7015–7018. doi: 10.1002/anie.200601432. [DOI] [PubMed] [Google Scholar]
- 30.Löwik D.W.P.M., Meijer J.T., van Hest J.C.M. Controlled disassembly of peptide amphiphile fibres. J. Pept. Sci. 2008;14:127–133. doi: 10.1002/psc.969. [DOI] [PubMed] [Google Scholar]
- 31.Woolley G.A. Photocontrolling peptide alpha helices. Acc. Chem. Res. 2005;38:486–493. doi: 10.1021/ar040091v. [DOI] [PubMed] [Google Scholar]
- 32.Zhang F., Zarrine-Afsar A., Woolley G.A. Structure-based approach to the photocontrol of protein folding. J. Am. Chem. Soc. 2009;131:2283–2289. doi: 10.1021/ja807938v. [DOI] [PubMed] [Google Scholar]
- 33.Haines-Butterick L., Rajagopal K., Schneider J.P. Controlling hydrogelation kinetics by peptide design for three-dimensional encapsulation and injectable delivery of cells. Proc. Natl. Acad. Sci. USA. 2007;104:7791–7796. doi: 10.1073/pnas.0701980104. [DOI] [PMC free article] [PubMed] [Google Scholar]
- 34.Altunbas A., Lee S.J., Pochan D.J. Encapsulation of curcumin in self-assembling peptide hydrogels as injectable drug delivery vehicles. Biomaterials. 2011;32:5906–5914. doi: 10.1016/j.biomaterials.2011.04.069. [DOI] [PMC free article] [PubMed] [Google Scholar]
- 35.Xiong H., Buckwalter B.L., Hecht M.H. Periodicity of polar and nonpolar amino acids is the major determinant of secondary structure in self-assembling oligomeric peptides. Proc. Natl. Acad. Sci. USA. 1995;92:6349–6353. doi: 10.1073/pnas.92.14.6349. [DOI] [PMC free article] [PubMed] [Google Scholar]
- 36.Stanger H., Gellman S. Rules for antiparallel beta-sheet design: D-pro-gly is superior to L-asn-gly for beta-hairpin nucleation. J. Am. Chem. Soc. 1998;120:4236–4237. [Google Scholar]
- 37.Schaefer J., Stejskal E. C-13 nuclear magnetic-resonance of polymers spinning at magic angle. J. Am. Chem. Soc. 1976;98:1031–1032. [Google Scholar]
- 38.Ishii Y. C-13-C-13 dipolar recoupling under very fast magic angle spinning in solid-state nuclear magnetic resonance: applications to distance measurements, spectral assignments, and high-throughput secondary-structure determination. J. Chem. Phys. 2001;114:8473–8483. [Google Scholar]
- 39.Takegoshi K., Nakamura S., Terao T. C-13-H-1 dipolar-assisted rotational resonance in magic-angle spinning NMR. Chem. Phys. Lett. 2001;344:631–637. [Google Scholar]
- 40.Morcombe C.R., Gaponenko V., Zilm K.W. Diluting abundant spins by isotope edited radio frequency field assisted diffusion. J. Am. Chem. Soc. 2004;126:7196–7197. doi: 10.1021/ja047919t. [DOI] [PubMed] [Google Scholar]
- 41.Tycko R. Symmetry-based constant-time homonuclear dipolar recoupling in solid state NMR. J. Chem. Phys. 2007;126:064506-1–064506-9. doi: 10.1063/1.2437194. [DOI] [PubMed] [Google Scholar]
- 42.Bennett A.E., Rienstra C.M., Griffin R.G. Heteronuclear decoupling in rotating solids. J. Chem. Phys. 1995;103:6951–6958. [Google Scholar]
- 43.Sawaya M.R., Sambashivan S., Eisenberg D. Atomic structures of amyloid cross-beta spines reveal varied steric zippers. Nature. 2007;447:453–457. doi: 10.1038/nature05695. [DOI] [PubMed] [Google Scholar]
- 44.Eswar N., Webb B., Sali A. Comparative protein structure modeling using MODELLER. Curr. Protoc. Protein Sci. 2007;50:2.9.1–2.9.31. doi: 10.1002/cpps.20. [DOI] [PubMed] [Google Scholar]
- 45.Phillips J.C., Braun R., Schulten K. Scalable molecular dynamics with NAMD. J. Comput. Chem. 2005;26:1781–1802. doi: 10.1002/jcc.20289. [DOI] [PMC free article] [PubMed] [Google Scholar]
- 46.Veshtort M., Griffin R.G. SPINEVOLUTION: a powerful tool for the simulation of solid and liquid state NMR experiments. J. Magn. Reson. 2006;178:248–282. doi: 10.1016/j.jmr.2005.07.018. [DOI] [PubMed] [Google Scholar]
- 47.Ozbas B., Kretsinger J., Pochan D.J. Salt-triggered peptide folding and consequent self-assembly into hydrogels with tunable modulus. Macromolecules. 2004;37:7331–7337. [Google Scholar]
- 48.Paravastu A.K., Petkova A.T., Tycko R. Polymorphic fibril formation by residues 10–40 of the Alzheimer’s beta-amyloid peptide. Biophys. J. 2006;90:4618–4629. doi: 10.1529/biophysj.105.076927. [DOI] [PMC free article] [PubMed] [Google Scholar]
- 49.Wishart D.S., Sykes B.D., Richards F.M. Relationship between nuclear magnetic resonance chemical shift and protein secondary structure. J. Mol. Biol. 1991;222:311–333. doi: 10.1016/0022-2836(91)90214-q. [DOI] [PubMed] [Google Scholar]
- 50.Shen Y., Delaglio F., Bax A. TALOS+: a hybrid method for predicting protein backbone torsion angles from NMR chemical shifts. J. Biomol. NMR. 2009;44:213–223. doi: 10.1007/s10858-009-9333-z. [DOI] [PMC free article] [PubMed] [Google Scholar]
- 51.Ulrich E.L., Akutsu H., Markley J.L. BioMagResBank. Nucleic Acids Res. 2008;36(Database issue):D402–D408. doi: 10.1093/nar/gkm957. [DOI] [PMC free article] [PubMed] [Google Scholar]
- 52.Tycko R. Solid-state NMR studies of amyloid fibril structure. Annu. Rev. Phys. Chem. 2011;62:279–299. doi: 10.1146/annurev-physchem-032210-103539. [DOI] [PMC free article] [PubMed] [Google Scholar]
- 53.Petkova A.T., Leapman R.D., Tycko R. Self-propagating, molecular-level polymorphism in Alzheimer’s beta-amyloid fibrils. Science. 2005;307:262–265. doi: 10.1126/science.1105850. [DOI] [PubMed] [Google Scholar]
- 54.Balbach J.J., Petkova A.T., Tycko R. Supramolecular structure in full-length Alzheimer’s beta-amyloid fibrils: evidence for a parallel beta-sheet organization from solid-state nuclear magnetic resonance. Biophys. J. 2002;83:1205–1216. doi: 10.1016/S0006-3495(02)75244-2. [DOI] [PMC free article] [PubMed] [Google Scholar]
- 55.Paravastu A.K., Leapman R.D., Tycko R. Molecular structural basis for polymorphism in Alzheimer’s beta-amyloid fibrils. Proc. Natl. Acad. Sci. USA. 2008;105:18349–18354. doi: 10.1073/pnas.0806270105. [DOI] [PMC free article] [PubMed] [Google Scholar]
- 56.Tay W.M., Huang D., Paravastu A.K. The Alzheimer’s amyloid-beta(1–42) peptide forms off-pathway oligomers and fibrils that are distinguished structurally by intermolecular organization. J. Mol. Biol. 2013 doi: 10.1016/j.jmb.2013.04.003. [DOI] [PMC free article] [PubMed] [Google Scholar]
- 57.Nielsen J.T., Bjerring M., Nielsen N.C. Unique identification of supramolecular structures in amyloid fibrils by solid-state NMR spectroscopy. Angew. Chem. Int. Ed. Engl. 2009;48:2118–2121. doi: 10.1002/anie.200804198. [DOI] [PubMed] [Google Scholar]
- 58.Ozbas B., Rajagopal K., Pochan D.J. Semiflexible chain networks formed via self-assembly of beta-hairpin molecules. Phys. Rev. Lett. 2004;93 doi: 10.1103/PhysRevLett.93.268106. 268106-1–26108-4. [DOI] [PubMed] [Google Scholar]
- 59.Qiang W., Yau W.M., Tycko R. Structural evolution of Iowa mutant β-amyloid fibrils from polymorphic to homogeneous states under repeated seeded growth. J. Am. Chem. Soc. 2011;133:4018–4029. doi: 10.1021/ja109679q. [DOI] [PMC free article] [PubMed] [Google Scholar]
- 60.Bertini I., Gonnelli L., Nesi A. A new structural model of Aβ40 fibrils. J. Am. Chem. Soc. 2011;133:16013–16022. doi: 10.1021/ja2035859. [DOI] [PubMed] [Google Scholar]
- 61.Caplan M.R., Schwartzfarb E.M., Lauffenburger D.A. Control of self-assembling oligopeptide matrix formation through systematic variation of amino acid sequence. Biomaterials. 2002;23:219–227. doi: 10.1016/s0142-9612(01)00099-0. [DOI] [PubMed] [Google Scholar]
Associated Data
This section collects any data citations, data availability statements, or supplementary materials included in this article.