

Abstract
Glucose-stimulated insulin secretion is pulsatile and driven by intrinsic oscillations in metabolism, electrical activity, and Ca2+ in pancreatic islets. Periodic variations in glucose can entrain islet Ca2+ and insulin secretion, possibly promoting interislet synchronization. Here, we used fluorescence microscopy to demonstrate that glucose oscillations can induce distinct 1:1 and 1:2 entrainment of oscillations (one and two oscillations for each period of exogenous stimulus, respectively) in islet Ca2+, NAD(P)H, and mitochondrial membrane potential. To our knowledge, this is the first demonstration of metabolic entrainment in islets, and we found that entrainment of metabolic oscillations requires voltage-gated Ca2+ influx. We identified diverse patterns of 1:2 entrainment and showed that islet synchronization during entrainment involves adjustments of both oscillatory phase and period. All experimental findings could be recapitulated by our recently developed mathematical model, and simulations suggested that interislet variability in 1:2 entrainment patterns reflects differences in their glucose sensitivity. Finally, our simulations and recordings showed that a heterogeneous group of islets synchronized during 1:2 entrainment, resulting in a clear oscillatory response from the collective. In summary, we demonstrate that oscillatory glucose can induce complex modes of entrainment of metabolically driven oscillations in islets, and provide additional support for the notion that entrainment promotes interislet synchrony in the pancreas.
Introduction
In response to a rise in blood glucose, β-cells in the pancreatic islets secrete insulin in pulses with a period of ∼5 min, and this is believed to underlie high-frequency oscillations in plasma insulin levels (1–3). At the cellular level, pulsatile insulin secretion is driven by oscillations in the β-cells’ cytosolic calcium concentration [Ca2+]c (4,5). These oscillations are a result of bursting electrical activity, which in turn may derive from oscillations in cellular metabolic variables (6–9). A rise in blood glucose concentration increases insulin pulse mass, but there is little modification of the oscillation period (10,11). However, it has been shown that a periodic glucose stimulus can entrain the pulsatile insulin response, thereby modifying the period of the insulin profile (1,12), likely via entrainment of [Ca2+]c oscillations (13), which could conceivably rely on entrainment of underlying metabolic oscillations. High-frequency fluctuations in plasma glucose concentrations are correlated with and similar in frequency to those of insulin (14,15). These rapid glucose oscillations have been suggested to be caused by rhythmic hepatic glucose output driven by oscillations in the glucagon/insulin ratio (16). Our theoretical investigations have suggested that islet entrainment by such glucose oscillations can help synchronize individual islets within the pancreas, which is a requirement for overall pancreatic insulin output to be pulsatile (17). The ability of glucose to entrain endogenous insulin pulses is impaired in humans with type 2 diabetes (14,18) and in pancreatic islets from Zucker diabetic fatty (ZDF) rats (1). The loss of islet entrainment in diabetes has been suggested to be a glucose-specific manifestation of β-cell dysfunction (19). Periodic insulin signals may optimize the action of the hormone on target tissues (20–22), and as a result, impaired islet entrainment may contribute to the pathogenesis of diabetes. This emphasizes the need to understand this fundamental nonlinear phenomenon and clarify its cellular basis.
Entrainment is a fundamental phenomenon that is associated with periodically forced, or coupled, nonlinear oscillators (23). It is characterized by an adjustment of both phase and period of the endogenous oscillations to the external signal and has been observed in many physiological systems (24), including circadian rhythms (25,26), the slow whole-body glucose/insulin feedback system (27), and brain waves and neurons (28,29). A defining feature of entrainment is that it occurs in distinct modes that reflect different ratios between the period of the exogenous stimulus and that of the resulting endogenous oscillations. In the simplest case of 1:1 entrainment, the system has one endogenous oscillation for each period of the external signal. As an example of higher-order entrainment, the oscillating system may adjust in such a way that two endogenous oscillations are observed for each period of the exogenous signal (so-called 1:2 entrainment). More complicated periodic—and even chaotic—patterns also arise when nonlinear oscillators are entrained (30,31). This behavior differs fundamentally from the outcome of a periodic all-or-none stimulus, which essentially switches the system on and off, and always results in a one-to-one response. Although such stimuli can be used to obtain insights regarding pancreatic β-cell function and synchrony (32,33), the analysis of real islet entrainment requires a more physiological stimulus of moderate amplitude.
To date, despite mounting evidence that metabolic oscillations form the foundation for pulsatile insulin release (34), there has been no demonstration of β-cell metabolic entrainment. Moreover, no experimental studies have specifically examined the possibility of higher-order entrainment in pancreatic islets. As a basis for the present investigation, we hypothesized that a physiological glucose stimulus can entrain islet cytosolic Ca2+ and metabolic flux in 1:1, 1:2, and possibly more complex modes, reflecting the nonlinearity of the underlying oscillating system. Here, we test this by using fluorescence microscopy and computer simulation, and we demonstrate entrainment of oscillations in islet NAD(P)H, mitochondrial membrane potential (ΔΨm), and cytosolic Ca2+ in response to an oscillating glucose stimulus. To our knowledge, our recordings are the first experimental evidence of metabolic entrainment in pancreatic islets. Moreover, our results demonstrate that glucose oscillations can induce distinct 1:1 and 1:2 entrainment of islet oscillations, and that metabolic entrainment by glucose requires voltage-gated Ca2+ influx. We show that interislet synchronization during entrainment involves adjustments of both oscillatory phase and period, and our simulations show that a heterogeneous group of islets synchronize when undergoing 1:2 entrainment to a slow glucose stimulus, resulting in a clear oscillatory response from the collective.
Materials and Methods
Pancreatic islet isolation and culture
Mouse pancreatic islets were isolated from 7- to 12-week-old male C57BL/6 mice in accordance with institutionally approved animal-care protocols. Mice were given an intraperitoneal injection of pentobarbital sodium (5 mg/100 g body weight), followed 5 min later by cervical dislocation. Islets were then isolated by collagenase digestion and purified either by centrifugal separation on a discontinuous Ficoll gradient as described previously (35) or by filtration through a 70 μm cell strainer (36). The islets were then cultured overnight in Gibco RPMI 1640 media containing 10 mM glucose and supplemented with 100 μU/ml penicillin, 100 μg/ml streptomycin, and 10% fetal calf serum (pH 7.4 with NaOH) at 37°C and 5% CO2. The following day, islets were hand-picked, transferred to glass coverslips in groups of three to eight, and allowed to adhere in culture for another 48 h before being used for imaging.
Islet imaging
The coverslips were transferred to a chamber (1 ml volume) that was mounted on a temperature-controlled stage, and held at 35°C on an inverted microscope (Eclipse TE300; Nikon Instruments Inc., Melville, NY) equipped with a 10× S Fluor objective (Nikon Instruments Inc.). Groups of islets isolated from a single mouse were imaged simultaneously, but were sufficiently separate on the coverslip to ensure that there was no physical contact between them. In most instances, islets from different mice were used for each experiment shown. During the experiments, islets were perifused continuously by Ringer’s solution containing (in mM) NaCl 144, KCl 5.5, MgCl2 1, CaCl2 2, Hepes 20 (adjusted to pH 7.35 by NaOH), and variable glucose, as indicated. Perifusion was carried out by means of computer-controlled, Gilson Minipulse 3 peristaltic pumps. The flow rate was held constant at 2.5 ml/min, and the glucose concentration varied in a sine-wave pattern with mean, period, and amplitude as indicated for the individual experiments.
Changes in islet ΔΨm were recorded using the indicator Rhodamine 123 (Rh123), and measurements of cytosolic Ca2+ ([Ca2+]c) were performed using the cell-permeant acetoxymethyl (AM) ester form of the Ca2+-indicators Fura-2 or Fura Red (8). Both dyes were loaded at a concentration of 5 μM for 30 min, and Rh123 was loaded at a concentration of 2 μg/ml for 10 min. All dye loading was done in RPMI media under standard culture conditions. Before imaging, the islets were perfused for 30 min with Ringer’s solution containing either a constant concentration of 10 mM glucose or an oscillating concentration profile with mean, frequency, and period as indicated in the text.
Fluorescence excitation wavelengths were controlled by means of excitation filters (Chroma Technology, Bellows Falls, VT) mounted in a Lambda DG-4 wavelength switcher (Sutter Instrument Company, Novato, CA). NAD(P)H autofluorescence was excited at 365 nm, whereas both Fura Red and Rh123 were excited at 495 nm. Fura-2 was excited ratiometrically at 340 nm and 380 nm, and the changes in [Ca2+]c were expressed as the ratio of fluorescence emission intensity (F340/F380). NAD(P)H autofluorescence, Fura Red fluorescence, and Rh123 fluorescence were filtered using a DAPI/FITC/TxRed polychroic beamsplitter (Chroma Technology) and triple-band emission filter. A D510/80m wide-band emission filter was used for monitoring of Fura-2 fluorescence. Images were collected every 5 s by a CoolSNAP HQ Monochrome 12 bit digital camera (Roper Scientific, Trenton, NJ), and both image acquisition and analysis were controlled by MetaFluor software (Molecular Devices, Sunnyvale, CA).
Chemicals
Fura Red/AM, Fura-2/AM, and Rh123 were purchased from Life Technologies (Carlsbad, CA). All other chemicals were obtained from Sigma (St. Louis, MO).
Data presentation and analysis
Islet NAD(P)H, Rh123, and Fura Red recordings were corrected for the slow downward trend due to photobleaching and dye loss, as previously described (8). The trend was estimated by an exponential best fit to the full time series. The slow trend in the time series was then corrected by dividing the raw data by the estimated exponential function, and the fluorescence intensity changes were expressed relative to the projected mean fluorescence. In other cases, detrending was obtained by expressing the data as the residual after subtraction of the projected mean fluorescence. Average islet traces were obtained and quantified after detrending and normalization of the individual islet recordings. Because Fura Red fluorescence changes inversely with cytosolic Ca2+, we plotted all Fura Red intensities on an inverted scale for a more intuitive representation of the changes in Ca2+. As outlined in previous analyses of pulsatile insulin secretion (1), we quantified the oscillatory periods using autocorrelation and spectral power analyses. These estimations were performed on detrended steady-state time series using MATLAB (The MathWorks, Natick, MA). For all other processing and plotting of experimental data, the program Igor Pro (Wavemetrics Inc., Portland, OR) was used. Results are presented as mean ± SE. Differences between groups were evaluated with the Mann-Whitney-Wilcoxon test or with the Wilcoxon signed-rank test for unpaired and paired testing, respectively, using R (http://www.R-project.org), and were considered significant at the 0.05 level.
Modeling and simulations
We used the model we developed in Bertram et al. (9), which combines essential aspects of previous models describing electrical activity and Ca2+ dynamics (37), glycolysis (38), and mitochondrial metabolism (39,40). Depending on the parameters, this model allows for an oscillatory glycolysis that causes rhythmic variations in mitochondrial metabolism, electrical activity, and Ca2+ levels. Feedbacks from Ca2+ on ATP levels, and from ATP on glycolysis, are included in the model. We refer to the original work (9) for further details. The model equations and parameters are described in the Supporting Material.
To study entrainment patterns, we added a forcing glucose term, which modifies the glucokinase rate, JGK, as described previously (17). JGK is a Hill function of the glucose concentration, G, which is assumed to be equal in the extra- and intracellular spaces:
| (1) |
VGK is the maximal glucokinase rate, KGK denotes the glucose concentration at which JGK is half-maximal, and nGK is the Hill coefficient. All simulations were done using the fifth-order Dormand-Prince solver in the program XPPAUT (41). The computer code is available at http://www.dei.unipd.it/∼pedersen.
Results and Discussion
Islet synchronization and 1:1 entrainment by oscillatory glucose
In the simplest form of entrainment, the endogenous oscillation frequency locks in a 1:1 ratio with the applied periodic signal. We examined the ability of an exogenous glucose signal to entrain islet [Ca2+]c oscillations in this manner by imaging groups of Fura-2-loaded islets. The intrinsic islet rhythm was first established during exposure to a constant glucose concentration for 32 min, and the concentration profile was then varied sinusoidally for an equal length of time. Fig. 1 A illustrates an experiment in which the glucose concentration was made to oscillate around a mean of 10 mM with a period of 4 min and amplitude of 20% of the mean. The frequency was chosen to be within the range observed for self-sustained oscillations in mouse islets stimulated with 10 mM glucose (4,8,42). During the constant glucose baseline, all islets exhibited regular self-sustained [Ca2+]c oscillations. When the islets were exposed to oscillatory glucose, there was a transient period of 5–10 min, after which all islets, with the exception of one, adjusted their phases to increase interislet synchrony.
Figure 1.
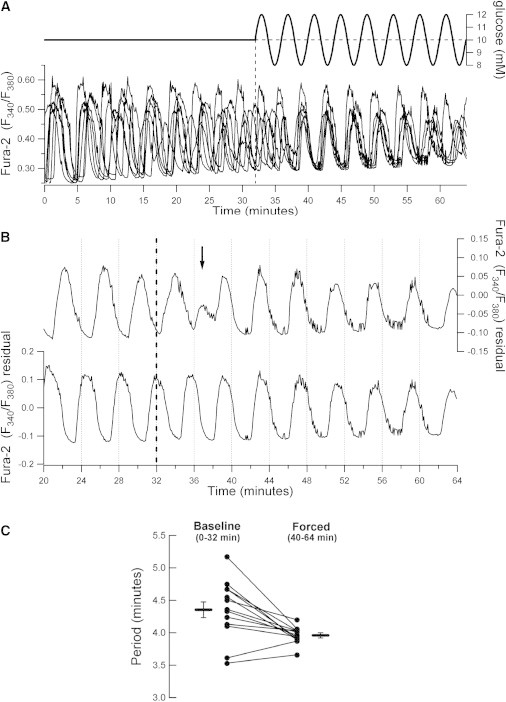
Characterization of 1:1 islet Ca2+ entrainment to glucose. (A) Representative experiment in which the cytosolic Ca2+ responses of seven Fura-2-loaded islets were imaged simultaneously. The islets were stimulated with an extracellular glucose profile as indicated above the recordings (mean: 10 mM; amplitude: 20%; period: 4 min). (B) Illustration of interislet phase synchronization upon exposure to glucose forcing as shown in panel A. The sinusoidal glucose stimulus was initiated at 32 min (dashed line). The arrow indicates the approximate time at which the islets synchronized their Ca2+ oscillations. (C) Islet Ca2+ oscillation periods quantified pre- and postentrainment to the glucose stimulus shown in panel A. Horizontal bars indicate mean ± SE (p = 0.005 by Wilcoxon signed-rank test, n = 13 islets from two mice).
Fig. 1 B illustrates the adaptation of islet phase that takes place during the transition to forcing-induced synchrony. Two of the islets from the experiment in Fig. 1 A are shown separately. During baseline, the islets oscillated with nearly identical periods but were clearly out of phase. The dashed line marks the onset of the forcing, and approximately at the time indicated by the arrow, the islets had switched to in-phase oscillations. Between islets, the phase transition can happen with different kinetics depending on the relative phase of the intrinsic oscillations at the onset of the external stimulation. In the examples shown, the transition was abrupt for one islet (Fig. 1 B, top), whereas another islet underwent a more gradual phase adjustment (Fig. 1 B, bottom). The external glucose signals changed the periods of their oscillations from 4.36 and 4.24 min to 3.97 and 3.88 min, respectively. The oscillatory periods of islets exposed to this protocol are summarized and compared in Fig. 1 C. As expected for 1:1 entrainment, the glucose forcing clearly caused a convergence of oscillatory periods and there was a significant adaptation of the mean period from 4.35 ± 0.13 min during baseline to 3.96 ± 0.04 min during the last 24 min after the transient adjustment phase (n = 13 islets from two independent experiments, p = 0.005 by Wilcoxon signed-rank test). As shown in Fig. 1 C, this involved both increases and decreases in the islet oscillation periods. These results are similar to the phase synchronization observed in other instances of cellular entrainment, including that of coupled vascular smooth muscle cells (43), and are in close agreement with recent work by Zhang et al. (13), who used a microfluidic device to stimulate groups of islets with an oscillating glucose stimulus.
Model simulations reproduced the experimentally observed islet behavior well. Fig. 2 shows two model cells that have oscillations in Ca2+, NADHm, and ΔΨm with a period of 8.4 min at a constant glucose concentration of 10 mM. When the glucose profile oscillates around this mean with an amplitude of 2 mM and a period of 7 min, the model cells adjust their period accordingly. In line with the experiments (Fig. 1 B), one cell adjusted its phase abruptly and the other model cell showed a more gradual adjustment, with the result that the two cells, which started out of phase, rapidly synchronized. Moreover, the resulting Ca2+ oscillations are in antiphase with the glucose oscillations, as we also observed experimentally (Fig. 1). Together, these experiments and simulations illustrate that the entrainment and synchronization of pancreatic islets by an oscillatory glucose profile involves an adaptation of both phase and period of the endogenous islet oscillator.
Figure 2.
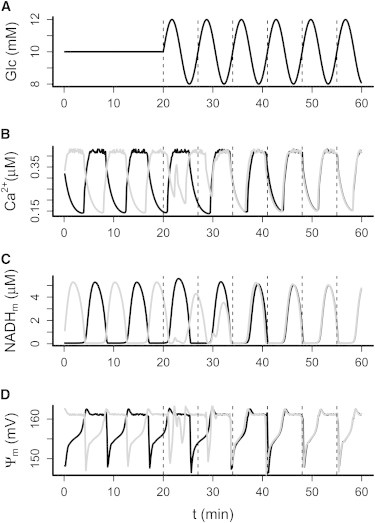
Model simulations of 1:1 entrainment. Two identical model islets were started out of phase in 10 mM constant glucose. (A–D) After 20 min, glucose (A) was made to oscillate with amplitude 2 mM and period 7 min, which induced rapid entrainment involving phase shift and period modulation as illustrated by the cytosolic [Ca2+] (B), mitochondrial [NADH] (C), and mitochondrial membrane potential (ΔΨm) (D).
Diverse patterns of 1:2 entrainment of islet Ca2+ by glucose
We next exposed islets to slower glucose oscillations with a period of 10 min to investigate the ability of islets to undergo 1:2 entrainment. As we hypothesized, this forcing profile induced a distinct 1:2 entrainment pattern with two Ca2+ peaks in the islet profile per period of the glucose forcing (Fig. 3). Intriguingly, some islets adapted to the glucose with a broad peak, followed by a narrower second peak during each full period (Fig. 3 Ai), whereas others showed two almost identical peaks (Fig. 3, Aii and Aiii). The first case would likely correspond to a large insulin pulse followed by a much smaller one, as has been observed in human islets exposed to a glucose stimulus of 10 min period (44), and also in the circulation of healthy humans infused with a rhythmic glucose signal of more than twice the endogenous pulsatile insulin period (14). The shift in period after entrainment to the oscillatory glucose stimulus was confirmed by autocorrelation and spectral analyses, as exemplified in Fig. 3, B and C. In this example, the islet had a peak autocorrelation coefficient at 10.6 min during the full entrainment interval and at 10.0 min for the last 30 min of the recording (Fig. 3 B), further illustrating the transient islet adjustment phase to a periodic glucose stimulus. Autocorrelation analysis established that the average principal period of the islets in constant glucose was 4.13 ± 0.14 min (35 islets from five mice), whereas islets exposed to oscillatory glucose showed an average period of 9.48 ± 0.09 min (22 islets from three mice; p < 0.0001 by Mann-Whitney-Wilcoxon test), demonstrating the successful 1:2 entrainment of the Ca2+ oscillations (Fig. 3 D). The 1:2 entrainment of islet Ca2+ is also clearly seen in the normalized and averaged fluorescence traces, which show a clear oscillatory pattern with a period of ∼10 min, with smaller intermediate shoulders during the slow sinusoidal glucose forcing, in contrast to the irregular small-amplitude fluctuations seen under constant glucose (Fig. 3 E).
Figure 3.
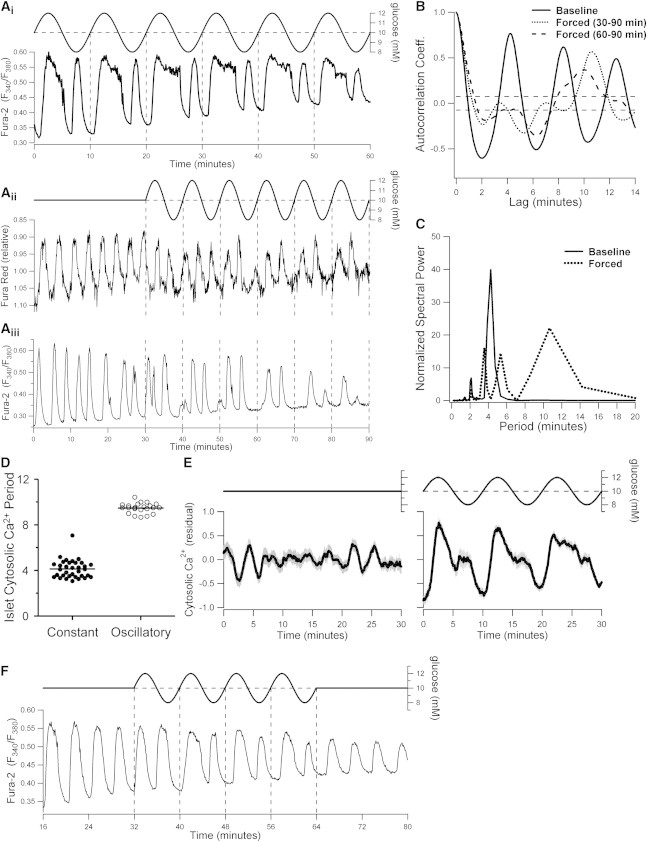
Heterogeneous patterns of 1:2 islet entrainment to slowly oscillating glucose. (A) Examples illustrating various 1:2 entrainment patterns of islet Ca2+ to an oscillating extracellular glucose profile with a period of 10 min, 10 mM mean, and 20% amplitude. The islet recordings in panels Aii and Aiii are from separate experiments with identical extracellular glucose stimulation profiles. Note that this and all subsequent Fura Red recordings are shown on an inverted intensity scale to reflect the direction of changes in cytosolic Ca2+. (B and C) Autocorrelation and spectral analyses of the cytosolic Ca2+ profile in panel Aiii. Solid and dashed lines indicate the properties before and after the onset of the oscillating glucose signal, respectively. The shift in period illustrates the 1:2 entrainment to the extracellular signal (representative of 16 islets from two mice). (D) Comparison of cytosolic Ca2+ oscillation periods of islets exposed to constant 10 mM glucose and islets during steady-state recordings in oscillatory glucose with 10 min period and 20% amplitude (p < 0.0001; n = 35 islets from six mice and 22 islets from three mice, respectively). (E) Mean cytosolic Ca2+ profiles of the islets quantified in panel D (left: constant glucose; right: oscillatory glucose). Before autocorrelation analysis and averaging, the individual islet recordings were detrended as described in Materials and Methods. Shaded gray bars represent mean ± SE. (F) Example of 1:2 islet Ca2+ entrainment to an oscillating glucose signal with 8 min period (representative of n = 6 islets from two mice).
An external stimulus is able to entrain an autonomous oscillator provided the frequencies of the two systems are sufficiently close to being at a 1:1, 1:2, or some other n:m integer ratio (23,24). We tested this in the context of 1:2 islet entrainment by changing the period of the slow glucose oscillations from 10 to 8 min. As illustrated in Fig. 3 F, the faster glucose signal was able to similarly entrain the islet Ca2+ oscillations in a 1:2 mode. Autocorrelation analyses of this profile showed peak lags at 4.4 min during baseline and at 8.5 min during the oscillatory glucose signal, confirming the entrainment.
We speculated that the variability we observed in the shape of the 1:2 entrainment patterns (Fig. 3 A) could reflect an inherent interislet heterogeneity in the responsiveness to glucose. To test this, we performed simulations in which we varied the glucokinase properties of the forced model cell. In accord with our experiments, this resulted in different Ca2+-response patterns. With default parameter values, we obtained two nearly identical Ca2+ peaks for each glucose oscillation (Fig. 4 B). When the affinity for glucose was increased by lowering the parameter KGK, one large peak followed by a smaller one could be simulated if the ATP-sensitive K+ (K(ATP)) conductance was raised slightly (Fig. 4 C), whereas only one large Ca2+ peak was produced with default K(ATP) conductance (Fig. 4 D). At first glance, the latter response resembles 1:1 entrainment, but the underlying metabolic profile showed a clear 1:2 pattern (Fig. 4 E). However, NADHm, ATP/ADP, and K(ATP) conductance only went below the threshold for electrical activity at one point during each period of the glucose forcing, so even though the metabolic subsystem was effectively 1:2 entrained to the glucose profile, this only manifested itself as a slight modulation in the plateau of the Ca2+ oscillation at this value of KGK (Fig. 4 D).
Figure 4.
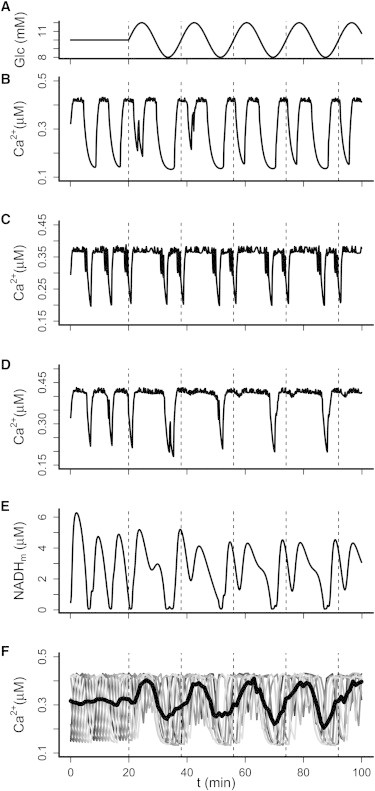
Model simulations of 1:2 entrainment. (A–D) In response to slowly oscillating glucose concentrations (A; mean 10 mM, amplitude 2 mM, period 18 min), various 1:2 entrainment patterns are seen (B–D). (E) The Ca2+ pattern in D resembles 1:1 entrainment despite being a result of clear 1:2 entrainment of the underlying metabolic oscillator, illustrated by mitochondrial NADH. Parameters take default values except that in C, KGK = 8.0 mM and K(ATP) = 14,300 pS, and in D and E, KGK = 8.0 mM. (F) Slow glucose oscillations synchronize eight heterogeneous and out-of-phase model islets (gray curves). Islet heterogeneity was modeled by different KGK-values (9.3–10.0 mM in steps of 0.1 mM). Synchronization by glucose gives rise to distinct pulses in the average Ca2+ concentration (black, thick curve).
Next, we used model simulations to investigate the ability of a slow glucose stimulus to synchronize and collectively entrain a group of individual, nonidentical islets. We used different KGK values to simulate eight such heterogeneous islets, which were initially out of phase. Each islet was modeled by a single cell representing a perfectly synchronized intra-islet β-cell population. When the glucose input was kept constant, the model islets were desynchronized and their averaged Ca2+ signal showed only modest and irregular fluctuations, but in response to oscillating glucose, a clear periodic signal arose rapidly due to increased synchronization of the model islets (Fig. 4 F). This finding is in agreement with the appearance of a slow periodic pattern in the average Ca2+ fluorescence trace of islets from different mice (Fig. 3 E), as well as with the results reported by Ritzel et al. (44), who did not observe periodic insulin secretion from a group of human islets in constant glucose, but detected a clear periodic insulin signal in response to oscillating glucose levels. Taken together, our results demonstrate that slow glucose oscillations can entrain pancreatic islets in a 1:2 mode with a period of approximately twice that of the endogenous oscillations, and further suggest that this may serve to synchronize and amplify slow pulsatile insulin secretion from a heterogeneous population of islets.
Entrainment of the islet metabolic oscillator
Studies of insulin secretion and cytosolic Ca2+ levels can provide important evidence regarding islet entrainment. However, when one considers insulin pulse entrainment, confounding factors such as peripheral dampening due to, e.g., hepatic extraction, systemic degradation, and dilution of secreted insulin may mask the exact entrainment mode of the synchronized pancreatic output (44). At the cellular level, the simulations in Fig. 4, D and E, indicate that even Ca2+ oscillations may not always clearly reveal the true entrainment state of the fundamental islet oscillator, which mounting evidence suggests is inherent to β-cell metabolism (34,45). Our model simulations predict that glucose has a robust ability to entrain the oscillatory metabolic subsystem (Figs. 2 C and 4 E). We tested this prediction experimentally by glucose-entraining the oscillations we and others have demonstrated in islet NAD(P)H levels (8) and in the mitochondrial membrane potential (ΔΨm) (8,46,47). In agreement with our simulations and the Ca2+ imaging results in Fig. 3, we observed 1:2 entrainment of both of these metabolic outputs to a periodic glucose profile with a period of 10 min (Fig. 5). Spectral analysis of the steady-state ΔΨm and NAD(P)H responses showed marked peaks at the induced period of 10 min and at the 5 min harmonic (Fig. 5, Bii and Cii), as is characteristic of 1:2 entrainment. The frequency adaptation of the endogenous oscillator was corroborated by autocorrelation analysis, which showed a significant periodic component of 10 min (Fig. 5 Biii). In similarity to the 1:2 entrainment of Ca2+ oscillations, our autocorrelation analyses demonstrated that the sinusoidal glucose stimulus significantly increased the average islet NAD(P)H period from 4.79 ± 0.20 min in constant 10 mM glucose (29 islets from five mice) to 10.00 ± 0.25 min (Fig. 5 D; 19 islets from three mice; p < 0.0001 by Mann-Whitney-Wilcoxon test). Moreover, the marked effect of glucose entrainment on the overall islet metabolic response was clearly seen by the appearance of a clear periodic signal in the average NAD(P)H fluorescence signal under oscillatory glucose, in contrast to the small and irregular fluctuations seen in the average response during constant glucose (Fig. 5 E). The averaged NAD(P)H 1:2 entrainment profile does not show as well-defined a secondary shoulder as the averaged Ca2+ response (Fig. 3 E), likely because the individual NAD(P)H peaks generally are less distinct and slightly more mismatched between individual islets. Together, these data demonstrate that endogenous oscillations in both islet metabolism and cytosolic Ca2+ are entrained by an oscillating external glucose signal.
Figure 5.
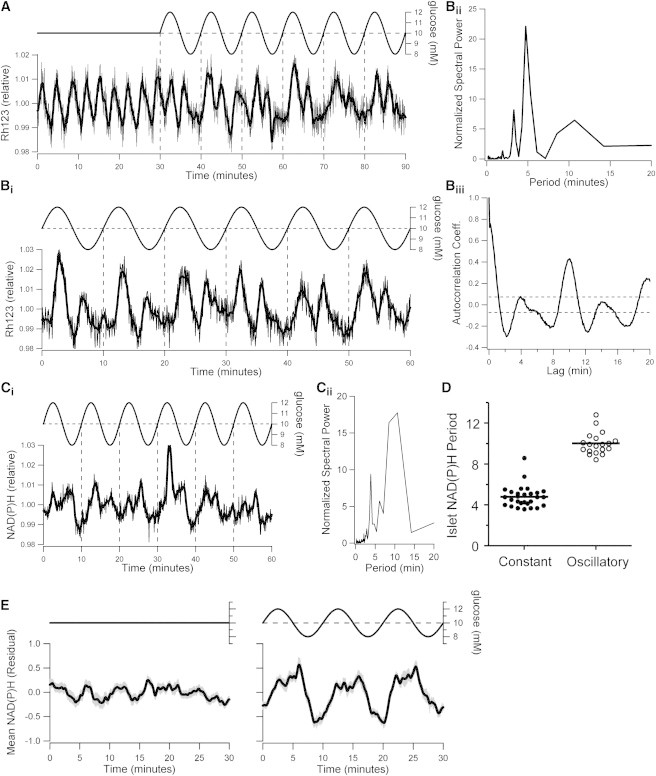
Metabolic entrainment by glucose. (A) Rh123 recordings demonstrate the endogenous oscillations in the mitochondrial membrane potential (ΔΨm) in islets exposed to 10 mM glucose, and their 1:2 entrainment in response to subsequent glucose oscillations with 10 min period and 20% amplitude (representative of six islets from one mouse). (B) Representative steady-state ΔΨm recording (Bi), and associated spectral (Bii) and autocorrelation (Biii) profiles during 1:2 entrainment by a slowly oscillating glucose stimulus (representative of 11 islets from one mouse). (C) Steady-state NAD(P)H recording (Ci) and associated spectral analysis profile of an islet 1:2 entrained by a slowly oscillating glucose stimulus (Cii; representative of 12 islets from two mice). (D) Comparison of NAD(P)H oscillation periods of islets exposed to constant 10 mM glucose and islets during steady-state recordings in oscillatory glucose with 10 min period and 20% amplitude (p < 0.0001; n=29 islets from five mice and 19 islets from three mice, respectively). (E) Mean NAD(P)H profiles of the islets quantified in panel D (left: constant glucose; right: steady-state oscillatory glucose). Before autocorrelation analysis and averaging, the individual islet recordings were detrended as described in Materials and Methods. Shaded gray bars represent mean ± SE.
Ca2+-metabolism interactions and the basis for islet entrainment
The feedback interactions that occur between calcium levels and metabolic flux have been the subject of significant work aimed at clarifying the mechanistic basis of glucose-induced islet oscillations (8,34,45,48). Metabolic oscillations have been shown to depend on [Ca2+]c. When plasma membrane depolarization and Ca2+ influx are prevented by the opening of ATP-sensitive K+ (K(ATP))-channels with diazoxide, oscillations in oxygen consumption (48) and NAD(P)H (8,45) are suppressed.
To clarify the role of Ca2+-metabolism interactions in islet entrainment, we first examined islet NAD(P)H and cytosolic Ca2+ oscillations simultaneously in response to a periodic glucose stimulus. The parallel NAD(P)H and Fura Red recordings demonstrated a high degree of correlation between the two, with each peak in metabolism paralleled by a peak in [Ca2+]c (Fig. 6 A). The specific recording in Fig. 6 A was also chosen to illustrate another interesting finding. In the course of our studies, we observed a few islets that responded to the slow glucose signal with a repeating pattern of two, two, and three peaks during each period of the external signal, i.e., seven peaks total every three periods of the glucose profile. Although the recordings were too short for us to draw definite conclusions, they suggest that the 10 min glucose signal entrained the abovementioned islets in a higher-order 3:7 mode. Indeed, our simulations reproduced such 3:7 entrainment when the period of the external glucose signal was ∼7/3 times that of the endogenous oscillations (Fig. 6 B).
Figure 6.
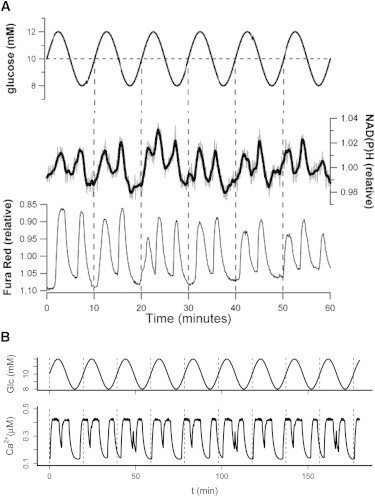
Close correlation of islet metabolic and [Ca2+]c entrainment and evidence for 3:7 mode locking. (A) Simultaneous recordings of pancreatic islet NAD(P)H autofluorescence and cytosolic Ca2+ during entrainment to a slowly oscillating glucose stimulus reveal that each peak in metabolism coincides with a peak in [Ca2+]c (representative of 13 islets from two mice). This specific recording was chosen to illustrate one of a few islets in which glucose oscillations with 10 min period induced an apparent 3:7 entrainment pattern rather than the predominant 1:2 frequency-locking mode (cf. Figs. 3 and 5). (B) Simulated 3:7 entrainment of model islets to glucose oscillations with period 19.6 min (mean: 10 mM; amplitude: 20%).
We next investigated the importance of Ca2+ influx for metabolic entrainment. When islets were exposed to a 10 min oscillatory glucose profile in the presence of 250 μM diazoxide, they no longer responded with 1:2 entrainment, and instead showed what could be misinterpreted as 1:1 mode-locking (Fig. 7 A). Model simulations reproduced this distinct behavior (Fig. 7 B) and clarified the reason for the switch in the islet response. The simulated addition of diazoxide (increasing maximal K(ATP) conductance) caused the model to pass into an inherently nonoscillatory steady state (Fig. 7 B) (45), which also agrees with experiments (Fig. 7 A) (8,45,48). Hence, in the presence of diazoxide, glucose oscillations do not entrain, but periodically modulate a stable glucose-responsive system. This further illustrates that true entrainment of a nonlinear system requires the presence of an active endogenous oscillator. Our simulations and recordings did not provide any indication that the intrinsic metabolic oscillator was activated during periodic substrate fluctuations in hyperpolarized islets. This shows that Ca2+ influx is also required for metabolic oscillations in islets exposed to a more physiological nonstationary glucose stimulus. At face value, these findings align with a model in which Ca2+ oscillations drive metabolic fluctuations. However, it was recently shown that a stable KCl-induced increase in [Ca2+]c restores islet NAD(P)H oscillations in the presence of diazoxide (45). Metabolic oscillations thus appear to rely on elevated Ca2+, but not on Ca2+ oscillations per se. A permissive role of elevated Ca2+ in sustaining an intrinsic metabolic oscillator, which in turn drives periodic voltage-gated Ca2+ influx, is fully compatible with the entrainment results we present here.
Figure 7.
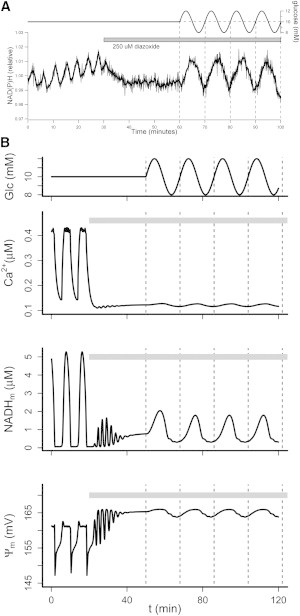
Voltage-gated Ca2+ influx is required for metabolic entrainment. (A) An oscillating glucose stimulus of 10 min period and 20% amplitude around a 10 mM mean concentration was started after islet hyperpolarization by 250 μM diazoxide. NAD(P)H autofluorescence measurements demonstrate that the normal 1:2 entrainment of islet metabolic oscillations is lost and replaced by an apparent 1:1 profile (representative of n = 16 islets from two mice). A similar change is seen in the NAD(P)H response when diazoxide is added during the entrainment, and is also observed in Rh123-based ΔΨm recordings (data not shown). (B) Model simulation reproducing the experiment in panel A. The glucose oscillations (upper panel) were as in Fig. 4. Diazoxide application was simulated by raising the maximal K(ATP) conductance K(ATP) to 30.000 pS during the period indicated by the gray bars.
Conclusions
A constant glucose stimulus triggers pulsatile insulin release, and increasing glucose levels enhance insulin secretion by increasing the amplitude of the insulin pulses with little change to their frequency (10). In this study, we addressed another important aspect of insulin secretion control, namely, how rhythmic islet activity is modified by periodic changes in glucose. Previous studies have shown that pulsatile insulin secretion can be entrained by a periodic glucose signal, resulting in an amplification of insulin pulse mass. Here we demonstrated that entrainment of both metabolic flux and cytosolic Ca2+ in pancreatic islets likely underlies this phenomenon, and that entrainment involves an adjustment of both the phase and frequency of the endogenous islet oscillations. Of note, this is the first experimental demonstration (to our knowledge) of metabolic entrainment in pancreatic islets. In addition to examining basic 1:1 entrainment, we demonstrated that a slower glucose stimulus can robustly entrain intrinsic oscillations of both islet Ca2+ and metabolism in a 1:2 frequency-locking mode. We believe such higher-order entrainment has been observed in the insulin secretion profiles of periodically stimulated human islets, albeit without being recognized as such (44), and also in plasma insulin levels during periodic glucose infusion in vivo (14). Our experiments also suggest that a slowly oscillating glucose profile of 10 min period can induce more complex 3:7 frequency locking in a small subset of islets. We emphasize that such regular multiple-peaks-per-period responses also represent nonlinear entrainment, in which the endogenous oscillator adjusts its phase and frequency to the external signal. Further, with regard to insulin secretion, our findings strengthen the evidence that entrainment of intrinsic islet oscillations helps synchronize islets and promote regular and robust insulin secretion patterns from the whole pancreas. The work by Ritzel et al. (44) suggests this may even occur in response to a glucose signal of very small amplitude. Our recordings and simulations confirmed that endogenous oscillations in islet metabolism depend on voltage-gated Ca2+ entry (8,45,48). Additionally, we established that oscillatory glucose is incapable of reactivating the endogenous metabolic oscillator in the absence of cytosolic Ca2+. We also found that under conditions in which a group of islets is entrained by the same slow glucose stimulus, islet heterogeneity leads to different shapes of the individual 1:2 entrainment patterns (cf. Fig. 4, B and C), which contributes to a combined insulin secretion profile that resembles 1:1 entrainment (Fig. 4 F) (1). Systemic dampening may further obscure the detection of 1:2 entrainment in peripheral measurements (44), but see also Mao et al. (14) for a counter-example. Even if they are not readily detected in systemic circulation, the underlying presence of these higher-order entrainment patterns is likely indicative of healthy islet function (19), including normal calcium-metabolism interactions (Fig. 7). However, this proposal remains to be addressed in further studies on islets from animal models of diabetes.
Acknowledgments
We thank Dr. Richard Bertram and Dr. Arthur Sherman for valuable suggestions during the early phases of this work. M.G.P. designed and performed model simulations, analyzed data, and wrote the manuscript. E.M. designed experiments and model simulations, and contributed to the manuscript. K.S.P. designed experiments and model simulations, and contributed to the manuscript. D.S.L. designed and performed experiments, designed model simulations, analyzed data, and wrote the manuscript.
This work was supported by National Institutes of Health operating grant DK31842 to K.S.P., and Canadian Institutes for Health Research operating grant MOP-119537 to D.S.L. M.G.P. was partly funded by the Lundbeck Foundation.
Supporting Material
References
- 1.Sturis J., Pugh W.L., Polonsky K.S. Alterations in pulsatile insulin secretion in the Zucker diabetic fatty rat. Am. J. Physiol. 1994;267:E250–E259. doi: 10.1152/ajpendo.1994.267.2.E250. [DOI] [PubMed] [Google Scholar]
- 2.Hellman B., Salehi A., Gylfe E. Isolated mouse islets respond to glucose with an initial peak of glucagon release followed by pulses of insulin and somatostatin in antisynchrony with glucagon. Biochem. Biophys. Res. Commun. 2012;417:1219–1223. doi: 10.1016/j.bbrc.2011.12.113. [DOI] [PubMed] [Google Scholar]
- 3.Hellman B., Salehi A., Grapengiesser E. Glucose generates coincident insulin and somatostatin pulses and antisynchronous glucagon pulses from human pancreatic islets. Endocrinology. 2009;150:5334–5340. doi: 10.1210/en.2009-0600. [DOI] [PubMed] [Google Scholar]
- 4.Gilon P., Shepherd R.M., Henquin J.C. Oscillations of secretion driven by oscillations of cytoplasmic Ca2+ as evidences in single pancreatic islets. J. Biol. Chem. 1993;268:22265–22268. [PubMed] [Google Scholar]
- 5.Bergsten P., Grapengiesser E., Hellman B. Synchronous oscillations of cytoplasmic Ca2+ and insulin release in glucose-stimulated pancreatic islets. J. Biol. Chem. 1994;269:8749–8753. [PubMed] [Google Scholar]
- 6.Longo E.A., Tornheim K., Corkey B.E. Oscillations in cytosolic free Ca2+, oxygen consumption, and insulin secretion in glucose-stimulated rat pancreatic islets. J. Biol. Chem. 1991;266:9314–9319. [PubMed] [Google Scholar]
- 7.Tornheim K. Are metabolic oscillations responsible for normal oscillatory insulin secretion? Diabetes. 1997;46:1375–1380. doi: 10.2337/diab.46.9.1375. [DOI] [PubMed] [Google Scholar]
- 8.Luciani D.S., Misler S., Polonsky K.S. Ca2+ controls slow NAD(P)H oscillations in glucose-stimulated mouse pancreatic islets. J. Physiol. 2006;572:379–392. doi: 10.1113/jphysiol.2005.101766. [DOI] [PMC free article] [PubMed] [Google Scholar]
- 9.Bertram R., Satin L.S., Sherman A. Interaction of glycolysis and mitochondrial respiration in metabolic oscillations of pancreatic islets. Biophys. J. 2007;92:1544–1555. doi: 10.1529/biophysj.106.097154. [DOI] [PMC free article] [PubMed] [Google Scholar]
- 10.Ritzel R.A., Veldhuis J.D., Butler P.C. Glucose stimulates pulsatile insulin secretion from human pancreatic islets by increasing secretory burst mass: dose-response relationships. J. Clin. Endocrinol. Metab. 2003;88:742–747. doi: 10.1210/jc.2002-021250. [DOI] [PubMed] [Google Scholar]
- 11.Pørksen N. The in vivo regulation of pulsatile insulin secretion. Diabetologia. 2002;45:3–20. doi: 10.1007/s125-002-8240-x. [DOI] [PubMed] [Google Scholar]
- 12.Pørksen N., Juhl C., Schmitz O. Concordant induction of rapid in vivo pulsatile insulin secretion by recurrent punctuated glucose infusions. Am. J. Physiol. Endocrinol. Metab. 2000;278:E162–E170. doi: 10.1152/ajpendo.2000.278.1.E162. [DOI] [PubMed] [Google Scholar]
- 13.Zhang X., Daou A., Roper M.G. Synchronization of mouse islets of Langerhans by glucose waveforms. Am. J. Physiol. Endocrinol. Metab. 2011;301:E742–E747. doi: 10.1152/ajpendo.00248.2011. [DOI] [PMC free article] [PubMed] [Google Scholar]
- 14.Mao C.S., Berman N., Ipp E. Glucose entrainment of high-frequency plasma insulin oscillations in control and type 2 diabetic subjects. Diabetes. 1999;48:714–721. doi: 10.2337/diabetes.48.4.714. [DOI] [PubMed] [Google Scholar]
- 15.Lang D.A., Matthews D.R., Turner R.C. Pulsatile, synchronous basal insulin and glucagon secretion in man. Diabetes. 1982;31:22–26. doi: 10.2337/diab.31.1.22. [DOI] [PubMed] [Google Scholar]
- 16.Goodner C.J., Hom F.G., Koerker D.J. Hepatic glucose production oscillates in synchrony with the islet secretory cycle in fasting rhesus monkeys. Science. 1982;215:1257–1260. doi: 10.1126/science.7036347. [DOI] [PubMed] [Google Scholar]
- 17.Pedersen M.G., Bertram R., Sherman A. Intra- and inter-islet synchronization of metabolically driven insulin secretion. Biophys. J. 2005;89:107–119. doi: 10.1529/biophysj.104.055681. [DOI] [PMC free article] [PubMed] [Google Scholar]
- 18.Hollingdal M., Juhl C.B., Schmitz O. Failure of physiological plasma glucose excursions to entrain high-frequency pulsatile insulin secretion in type 2 diabetes. Diabetes. 2000;49:1334–1340. doi: 10.2337/diabetes.49.8.1334. [DOI] [PubMed] [Google Scholar]
- 19.Mao C.S., Berman N., Ipp E. Loss of entrainment of high-frequency plasma insulin oscillations in type 2 diabetes is likely a glucose-specific β-cell defect. Am. J. Physiol. Endocrinol. Metab. 2004;287:E50–E54. doi: 10.1152/ajpendo.00555.2003. [DOI] [PubMed] [Google Scholar]
- 20.Paolisso G., Scheen A.J., Lefèbvre P.J. Pulsatile insulin delivery has greater metabolic effects than continuous hormone administration in man: importance of pulse frequency. J. Clin. Endocrinol. Metab. 1991;72:607–615. doi: 10.1210/jcem-72-3-607. [DOI] [PubMed] [Google Scholar]
- 21.Schmitz O., Arnfred J., Orskov H. Glucose uptake and pulsatile insulin infusion: euglycaemic clamp and [3-3H]glucose studies in healthy subjects. Acta Endocrinol. (Copenh.) 1986;113:559–563. doi: 10.1530/acta.0.1130559. [DOI] [PubMed] [Google Scholar]
- 22.Matveyenko A.V., Liuwantara D., Butler P.C. Pulsatile portal vein insulin delivery enhances hepatic insulin action and signaling. Diabetes. 2012;61:2269–2279. doi: 10.2337/db11-1462. [DOI] [PMC free article] [PubMed] [Google Scholar]
- 23.Pikovsky A., Rosenblum M., Kurths J. Cambridge University Press; Cambridge: 2001. Synchronization: A Universal Concept in Nonlinear Sciences. [Google Scholar]
- 24.Glass L. Synchronization and rhythmic processes in physiology. Nature. 2001;410:277–284. doi: 10.1038/35065745. [DOI] [PubMed] [Google Scholar]
- 25.Dunlap J.C. Molecular bases for circadian clocks. Cell. 1999;96:271–290. doi: 10.1016/s0092-8674(00)80566-8. [DOI] [PubMed] [Google Scholar]
- 26.Golombek D.A., Rosenstein R.E. Physiology of circadian entrainment. Physiol. Rev. 2010;90:1063–1102. doi: 10.1152/physrev.00009.2009. [DOI] [PubMed] [Google Scholar]
- 27.Sturis J., Knudsen C., Polonsky K.S. Phase-locking regions in a forced model of slow insulin and glucose oscillations. Chaos. 1995;5:193–199. doi: 10.1063/1.166068. [DOI] [PubMed] [Google Scholar]
- 28.Will U., Berg E. Brain wave synchronization and entrainment to periodic acoustic stimuli. Neurosci. Lett. 2007;424:55–60. doi: 10.1016/j.neulet.2007.07.036. [DOI] [PubMed] [Google Scholar]
- 29.Berke J.D., Okatan M., Eichenbaum H.B. Oscillatory entrainment of striatal neurons in freely moving rats. Neuron. 2004;43:883–896. doi: 10.1016/j.neuron.2004.08.035. [DOI] [PubMed] [Google Scholar]
- 30.Glass L., Mackey M.C. Princeton University Press; Princeton, NJ: 1988. From Clocks to Chaos: The Rhythms of Life. [Google Scholar]
- 31.Mosekilde E. World Scientific Publishing; Singapore: 1996. Topics in Nonlinear Dynamics: Applications to Physics, Biology and Economic Systems. [Google Scholar]
- 32.Zarkovic M., Henquin J.C. Synchronization and entrainment of cytoplasmic Ca2+ oscillations in cell clusters prepared from single or multiple mouse pancreatic islets. Am. J. Physiol. Endocrinol. Metab. 2004;287:E340–E347. doi: 10.1152/ajpendo.00069.2004. [DOI] [PubMed] [Google Scholar]
- 33.Ravier M.A., Gilon P., Henquin J.C. Oscillations of insulin secretion can be triggered by imposed oscillations of cytoplasmic Ca2+ or metabolism in normal mouse islets. Diabetes. 1999;48:2374–2382. doi: 10.2337/diabetes.48.12.2374. [DOI] [PubMed] [Google Scholar]
- 34.Bertram R., Sherman A., Satin L.S. Metabolic and electrical oscillations: partners in controlling pulsatile insulin secretion. Am. J. Physiol. Endocrinol. Metab. 2007;293:E890–E900. doi: 10.1152/ajpendo.00359.2007. [DOI] [PubMed] [Google Scholar]
- 35.Zhou Y.P., Pena J.C., Polonsky K.S. Overexpression of Bcl-x(L) in β-cells prevents cell death but impairs mitochondrial signal for insulin secretion. Am. J. Physiol. Endocrinol. Metab. 2000;278:E340–E351. doi: 10.1152/ajpendo.2000.278.2.E340. [DOI] [PubMed] [Google Scholar]
- 36.Johnson J.D., Ford E.L., Polonsky K.S. Suppressed insulin signaling and increased apoptosis in CD38-null islets. Diabetes. 2006;55:2737–2746. doi: 10.2337/db05-1455. [DOI] [PubMed] [Google Scholar]
- 37.Bertram R., Sherman A. A calcium-based phantom bursting model for pancreatic islets. Bull. Math. Biol. 2004;66:1313–1344. doi: 10.1016/j.bulm.2003.12.005. [DOI] [PubMed] [Google Scholar]
- 38.Smolen P. A model for glycolytic oscillations based on skeletal muscle phosphofructokinase kinetics. J. Theor. Biol. 1995;174:137–148. doi: 10.1006/jtbi.1995.0087. [DOI] [PubMed] [Google Scholar]
- 39.Bertram R., Gram Pedersen M., Sherman A. A simplified model for mitochondrial ATP production. J. Theor. Biol. 2006;243:575–586. doi: 10.1016/j.jtbi.2006.07.019. [DOI] [PubMed] [Google Scholar]
- 40.Magnus G., Keizer J. Minimal model of β-cell mitochondrial Ca2+ handling. Am. J. Physiol. 1997;273:C717–C733. doi: 10.1152/ajpcell.1997.273.2.C717. [DOI] [PubMed] [Google Scholar]
- 41.Ermentrout G. SIAM Books; Philadelphia, PA: 2002. Simulating, Analyzing, and Animating Dynamical Systems: A Guide to XPPAUT for Researchers and Students. [Google Scholar]
- 42.Grapengiesser E., Gylfe E., Hellman B. Glucose-induced oscillations of cytoplasmic Ca2+ in the pancreatic β-cell. Biochem. Biophys. Res. Commun. 1988;151:1299–1304. doi: 10.1016/s0006-291x(88)80503-5. [DOI] [PubMed] [Google Scholar]
- 43.Jacobsen J.C., Aalkjaer C., Holstein-Rathlou N.H. Heterogeneity and weak coupling may explain the synchronization characteristics of cells in the arterial wall. Philos. Trans. A Math Phys. Eng. Sci. 2008;366:3483–3502. doi: 10.1098/rsta.2008.0105. [DOI] [PubMed] [Google Scholar]
- 44.Ritzel R.A., Veldhuis J.D., Butler P.C. The mass, but not the frequency, of insulin secretory bursts in isolated human islets is entrained by oscillatory glucose exposure. Am. J. Physiol. Endocrinol. Metab. 2006;290:E750–E756. doi: 10.1152/ajpendo.00381.2005. [DOI] [PubMed] [Google Scholar]
- 45.Merrins M.J., Fendler B., Satin L.S. Metabolic oscillations in pancreatic islets depend on the intracellular Ca2+ level but not Ca2+ oscillations. Biophys. J. 2010;99:76–84. doi: 10.1016/j.bpj.2010.04.012. [DOI] [PMC free article] [PubMed] [Google Scholar]
- 46.Kindmark H., Köhler M., Berggren P.O. Glucose-induced oscillations in cytoplasmic free Ca2+ concentration precede oscillations in mitochondrial membrane potential in the pancreatic β-cell. J. Biol. Chem. 2001;276:34530–34536. doi: 10.1074/jbc.M102492200. [DOI] [PubMed] [Google Scholar]
- 47.Nunemaker C.S., Satin L.S. Comparison of metabolic oscillations from mouse pancreatic β cells and islets. Endocrine. 2004;25:61–67. doi: 10.1385/ENDO:25:1:61. [DOI] [PubMed] [Google Scholar]
- 48.Kennedy R.T., Kauri L.M., Jung S.K. Metabolic oscillations in β-cells. Diabetes. 2002;51(Suppl 1):S152–S161. doi: 10.2337/diabetes.51.2007.s152. [DOI] [PubMed] [Google Scholar]
Associated Data
This section collects any data citations, data availability statements, or supplementary materials included in this article.