

Abstract
The transcription factor NFκB, a key component of the immune system, shows intricate stimulus-specific temporal dynamics. Those dynamics are thought to play a role in controlling the physiological response to cytokines and pathogens. Biochemical evidence suggests that the NFκB inducing kinase, IKK, a signaling hub onto which many signaling pathways converge, is regulated via a regulatory cycle comprising a poised, an active, and an inactive state. We hypothesize that it operates as a modulator of signal dynamics, actively reshaping the signals generated at the receptor proximal level. Here we show that a regulatory cycle can function in at least three dynamical regimes, tunable by regulating a single kinetic parameter. In particular, the simplest three-state regulatory cycle can generate signals with two well-defined phases, each with distinct coding capabilities in terms of the information they can carry about the stimulus. We also demonstrate that such a kinase cycle can function as a signal categorizer classifying diverse incoming signals into outputs with a limited set of temporal activity profiles. Finally, we discuss the extension of the results to other regulatory motifs that could be understood in terms of the regimes of the three-state cycle.
Introduction
Cells typically react to changes in their environment by modifying the expression level of specific genes. To mount an appropriate response, the machinery responsible for controlling gene expression must receive information about the nature of the environmental perturbation via intracellular signaling pathways. Signals propagating on these pathways, in a sense, encode this information into their amplitude, duration, or other features. Not every such feature is relevant because some may be filtered out by subsequent signaling nodes or because the effectors of the cellular response that act as decoders themselves may be insensitive to them. To identify those features relevant for a particular pathway, and therefore understand its functioning (and malfunctioning), it is important to characterize the regulatory mechanisms present in terms of their ability to decode, relay, or potentially transform the information contained in the incoming signal.
Kinase IKK is a key regulator of NFκB, a critical mediator of inflammatory and immune responses. IKK is a complex comprising several subunits (1). The catalytic subunit is activated by phosphorylation of its activation loop. Subsequent phosphorylation in the C-terminal domain significantly reduces its activity (2) by causing a conformational change and disrupting the interaction between the catalytic and regulatory subunits (3). Further rounds of activation require the kinase to be recycled by dephosphorylation and reformation of the complex. It has been shown that phosphatase PP2A is a positive regulator of IKK activation (4), thus it has been proposed that it mediates the recycling process, possibly in conjunction with foldase HSP90 (5,6). Experiments in our lab using pharmacological inhibitors are consistent with the results reported in the literature (see Fig. S1 in the Supporting Material).
In its minimal form, IKK regulation can be described as a cycle with three states: poised, active, and inactivated, henceforth the three-state cycle. Mathematical models for the NFκB network incorporating the cycle (7,8) successfully recapitulate NFκB activation in response to the cytokine Tumor Necrosis Factor (TNF). Interestingly, NFκB is activated by dozens of different pathogen and cytokine receptors with distinct temporal activity profiles, supporting the notion that information about those stimuli is, at least in part, encoded in the temporal patterns of NFκB activity that critically depend on IKK’s own stimulus-specific activity (9–11). Although the origin of these patterns is still unclear, it is apparent that IKK regulation will impact features of the incoming signals that ultimately reach NFκB targets in a manner that remains to be understood. Here, we analyze the minimal three-state control cycle motif in terms of its ability to relay and process dynamic signals. We then examine the specific impact of our findings in the IκB-NFκB signaling module. Finally, we discuss how our findings may apply to other signaling pathways in which, after deactivation, a component must transition through an inactive intermediate state before becoming available for further rounds of activation.
Methods
Equations 1–3 can be solved analytically giving the expression in Eq. 1 for the temporal (in transformed time units) evolution of IKKa starting from an initial concentration of zero:
| (1) |
Here IKKaSS is the steady-state concentration of active IKK (Eq. 2), KT is (1 + k1′ + k3′), and quantities d and α are functions of k1′ and k3′ (Eqs. S10–S11 in the Supporting Material). Note that the input strength (parameter s) is incorporated into k1′:
| (2) |
The surfaces in Fig. 1 C were calculated using Eq. 2 for the steady state. For the maximum amplitude, we solved numerically the system of differential equations using a square-step function of amplitude 1 as input. The value of k2 was set to 1 and k1 and k3 varied as indicated in the figure. The integration was performed for eight time units (k2 units), sufficient to drive the cycle sufficiently close to steady state. The solutions for IKKa were interpolated to a time grid (0.01 time intervals) and the maximum amplitude determined from the interpolated values. The cross-sections in Fig. 2 were generated directly from the plots in Fig. 1 (for the lower row, the values were normalized to each k3′-specific maximum value). The EC50 values were determined analytically for the steady state (see Eq. S16 in the Supporting Material) and numerically for the peak (see Fig. S3). For this last quantity, we numerically solved Eq. 1 for the k1′ value that generated an IKKa concentration equal to 50% of the total. All numerical computations were performed with the package MATHEMATICA Ver. 7 (Wolfram Research, Urbana, IL).
Figure 1.
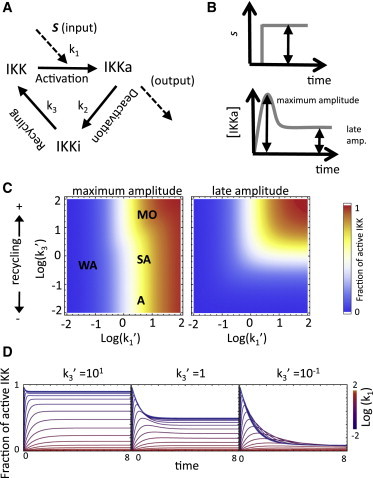
Operational regimes of the three-state cycle. (A) The input signal causes the kinase IKK to transition from a poised (IKK) to an active state (IKKa). Active IKK is then transformed into an inactive form (IKKi) from which the poised state is regenerated. (B) When stimulated with square steps of varying amplitude, the cycle can generate biphasic signals with well-defined early and late phases. (C) Maximum amplitude (fraction of IKK active) during the early and late phases (left and right, respectively) as a function of the normalized stimulus strength (k1′) and recycling rate (k3′) parameters. Regions corresponding to the weak activation (WA) limit, and the monotonic (M), semiadaptive (SA), and adaptive (A) regimes are indicated. (D) Typical time courses of IKK activation.
Figure 2.
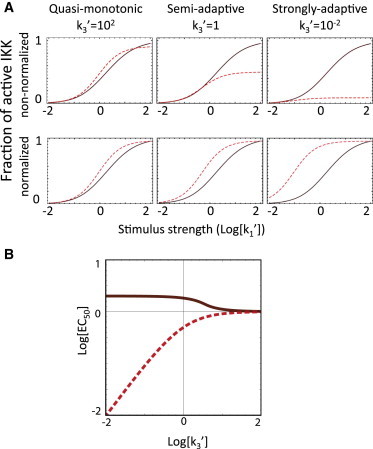
Amplitude dose response. (A) Dose response for the early (solid) and late (dashed) phases of IKK response for the monotonic, semiadaptive, and strongly adaptive cases (k3′ = 102, 1, 10−2, left to right). (Lower panels) Dose responses normalized to their maximum attained value to emphasize the shift of the EC50 toward lower stimulus concentrations. (B) EC50PEAK and EC50SS (solid and dashed, respectively) as a function of k3′.
The activation lag in Fig. 3 A was calculated numerically: for a given k1′ and k3′, we solved for the time t at which the cycle reached the threshold for the first time when stimulated with a square-step input. The termination delay (Fig. 3 C) was calculated using IKKtp determined from Eq. 1, in combination with the expression for IKKa decay in Eq. S22 in the Supporting Material. The full duration dose response, the cross-sections, and the corresponding time courses were generated by numerically solving the ordinary differential equation system as before (for k2 = 1 and k1 and k3 as indicated) except that square pulses of the indicated duration were used as input. We determined the times at which the concentration of IKKa crossed the threshold by interpolating the solution to a fine temporal grid as described above. A similar simulation approach was used to generate the heat maps in Fig. 4. The response of the cycle to repeated stimulation scenarios (Fig. 5) was investigated by numerically integrating Eqs. 1–3 using a train of square pulses of saturating amplitude (k1 = 102, k2 = 1, and k3 as indicated) and duration equal to 5 (in transformed time units). The time between pulses was varied as indicated. The critical relaxation time was calculated using Eq. S24 in the Supporting Material.
Figure 3.
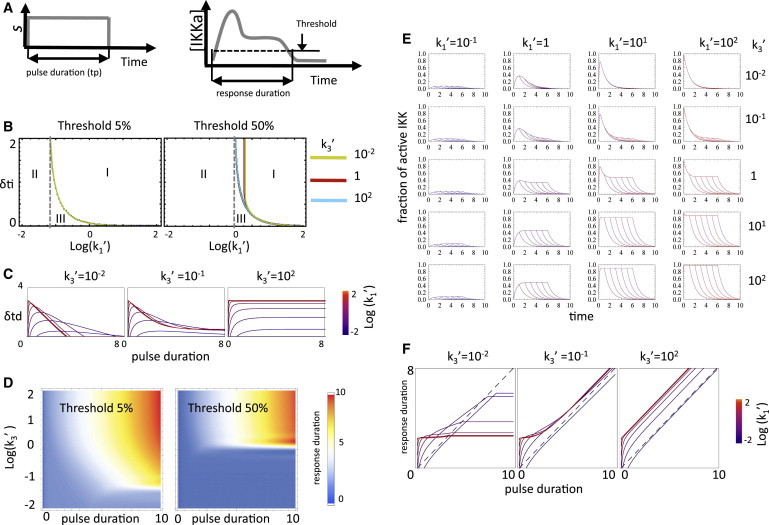
Duration dose response. (A) The three-state cycle was stimulated with square pulses of various durations. The period of time for which the IKKa fraction remained over an arbitrary threshold was defined as response duration. (B) Initial lag (δti) as a function of k1′ for monotonic (cyan), semiadaptive (red), and strongly adaptive (yellow) regimes (k3′ = 102, 10−1, 10−2, respectively), and 5 and 50% thresholds. Regions with nonzero duration (I), amplitude-limited (II), and duration-limited (III) are indicated. (C) Termination delay (δtd) for the three regimes and various values of k1′ as a function of pulse duration. (D) Duration dose-response for 5 and 50% thresholds. (E) Typical time courses of IKKa in response to square pulses. (F) Cross-sections of the duration dose-response surfaces along the pulse duration axis. All times in transformed units.
Figure 4.
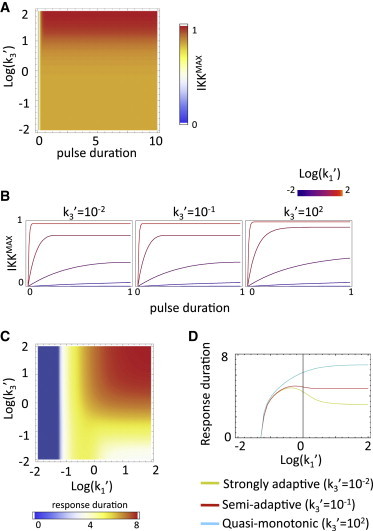
Amplitude-duration transformation. (A) Maximum output amplitude versus input duration for a pulse of saturating amplitude. (B) Maximum output amplitude versus input pulse duration for monotonic, semiadaptive, and adaptive regimes (k3′ = 102, 10−1, 10−2) and various input amplitudes. (C) Duration of the response (5% threshold) as a function of the normalized stimulus strength (k1′) and recycling rate (k3′) parameters for a pulse of duration 0.7 (in transformed time units). (D) Response duration versus normalized input amplitude for the three regimes in panel B. All times in transformed units.
Figure 5.
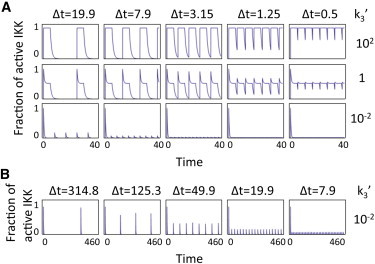
Response to repeated stimulation. (A) Cycle response to a train of square pulses of duration 5, separated by Δt = 19.9, 7.9, 3.15,1.25, and 0.5 (left to right). Responses shown for monotonic, semiadaptive, and strongly adaptive regimes (k3′ = 102, 10−0, 10−2, respectively). Values for 95% IKK recovery times are 2.3, 2.3, and 299, respectively. (B) Response of the strongly adaptive case in panel A over an extended period of time showing full recovery for low-frequency pulses. All times in transformed units.
The model of the NFκB has been taken from Werner et al. (9). As in the original publication, on each simulation the models were numerically integrated (as described above) with a basal IKK activity corresponding to 1% of the total to allow for equilibration and subsequently the numerical inputs were applied to modulate IKK activity. The time axis for the collection of IKK output curves was rescaled to reflect the timescales relevant for the NFκB network, as indicated. To calculate the mutual information between input-IKK and IKK-NFκB signals, we classified each set of curves into amplitude bins and determined the information content (distribution of the input/output curves among their respective amplitude bins, equivalent to entropy) as well as the joint entropy (distribution of output curves given an input bin):
| (3) |
| (4) |
Here X and Y are the different kind of curves (input library, IKK, NFκB) and nX(b,t) is the distribution of curves of type X among its respective bins at time t. The quantity nX,Y(b,t) is the joint distribution for two curves. We used the standard approach and set 0 × Log(0) = 0 (12). The mutual information can be obtained as
| (5) |
The correlation between the duration at the various levels in the cascade (see Fig. S7) was calculated by determining the time at which the simulated time courses crossed the indicated thresholds.
Results
The three-state cycle can operate in three different regimes
In its simplest form, the control cycle motif has three states connected by three processes:
-
1.
Activation by an upstream effector;
-
2.
Deactivation into a refractory state; and
-
3.
Recycling back to the poised state (Fig.1 A, and see equations below):
| (6) |
| (7) |
| (8) |
Here, [IKK], [IKKa], and [IKKi] represent the concentration of the poised, active, and inactive forms of the kinase, respectively. The parameter s is the strength of the stimulus. We assume conservation of the total concentration of IKK during the relevant timescales. By rewriting the equations in terms of a transformed time k2 t (setting the time units to k2) and constants k1′ = s k1/k2 and k3′ = k3/k2, the explicit dependence on the parameter k2 is eliminated and the system can be analyzed in a two-dimensional space (k1′,k3′) without loss of generality (see the Supporting Material for details). In the remaining, k1′, k3′, and time will refer to the transformed quantities, unless indicated otherwise.
Typically, in the absence of upstream signaling (or in the presence of weak basal activity), most molecules are resting in a poised state. Upon stimulation, the concentration of the active form (the output of the cycle) increases and information about upstream activity is relayed to downstream targets. Depending on the kinetic parameters, the output may remain high or adapt to lower levels. In general, in response to long-lasting stimuli, the dynamics of the three-state cycle can be classified according to the stimulus-dependent steady-state level and the maximum amplitude of the transient into three major dynamic regimes (strongly adaptive, semiadaptive, and monotonic; see Eqs. S8, S13, and S14 in the Supporting Material, and see Fig. 1, B and C, main text), plus a weak activation limit. When k1′ ≪ 1, maximum activation (either transient or steady state) ∼k1′ (see the Supporting Material) and a very small fraction of IKK is activated. This is the weak activation limit (13) in which depletion of the substrate is negligible, and thus replenishing by the recycling reaction becomes irrelevant for activation. In this limit, the three-state cycle and a two-state switch become equivalent.
Beyond the weak activation limit, in the limiting case of infinitely fast recycling, stimulation causes the concentration of the active form to increase monotonically to its equilibrium level and the dynamics of the system resemble those of a simple reversible process such as the two-state phosphorylation-dephosphorylation switch prevalent in signaling cascades (13,14). In this limit, the cycle behaves as a push-button switch, relaying a signal for as long as there is upstream activity and shutting down (albeit potentially slowly) when that activity subsides. This is the monotonic regime. The opposite limit occurs when recycling is not present and the refractory form becomes a sink from which active molecules cannot be regenerated. In this limit, after initial activation, the concentration of the active form decays to zero as the molecules are sequestered in the refractory state. This kind of regulation has been documented in yeast and mammalian signaling networks (15,16). This is the strongly adaptive regime. The introduction of a recycling reaction allows the module to respond in a semiadaptive manner with a transient accumulation of the active form that subsequently settles at a potentially reduced steady-state level. This is the semiadaptive regime.
The operational regime of a cycle is determined by the relative rates of the reactions (Fig. 1, C and D). For fixed k1′, steady-state levels increase monotonically with k3′ (see Eqs. S8 and S15 in the Supporting Material) whereas maximum amplitude is determined almost exclusively by k1′ (see Eq. S14 in the Supporting Material). The region with k3′ ≫ 1 and k1′ ≥ 1 corresponds to the monotonic regime with high steady-state levels and little or no transient overshoot (a rigorous derivation is presented in the Supporting Material). The region with k3′ ≪ 1 and k1′ ≥ 1 corresponds to the strongly adaptive regime with elevated transient peaks but very low steady-state activity levels. Finally, the region with k3′ ∼ 1 and k1′ > 1 corresponds to the semiadaptive regime, with both significant transient overshoots and sizable steady-state levels.
In summary, the three-state cycle exhibits three characteristic dynamical regimes that are bounded by the extremes of the two-state and irreversible switches. Because, for a given signal strength (k1′), the actual regime is mainly determined by the relative speed of the recycling process (k3′), the cycle represents a simple yet flexible motif that could be tuned to produce transient or sustained outputs in a tissue- or cell-state-specific manner through the regulation of the enzymes responsible for recycling.
Distinct amplitude dose-response behavior by early and late phases
The cycle’s ability to generate signals with two distinguishable phases (early and late) suggests the possibility that one or the other may preferentially transfer information about the stimulus. A critical piece of information about a stimulus is often its intensity; therefore, we first analyzed the ability of the three-state cycle motif to transfer information about the amplitude of the incoming signal. For this, we first examined the dose-responses of the maximum and steady-state parts of the cycle response. Cross-sections of the amplitude surfaces in Fig. 1 C along the k1′ axis (proportional to stimulus amplitude s) for slow, intermediate, and fast recycling (k3′ = 10−2,0,2, corresponding to strongly adaptive, semiadaptive, and monotonic regimes) show that the dose-responsive range, understood as the range of input amplitudes for which the system generates a dose-dependent response, is very similar for the three regimes (Fig. 2 A). Consistent with this observation, it is possible to show analytically that at sufficiently high stimulus levels the cycle asymptotically approximates complete activation (IKKa ∼ 1) regardless of the regime, but in a transient or sustained manner depending on the regime.
The dose-dependency of the maximum and steady-state phases of the cycle response can be characterized in terms of their EC50PEAK and EC50SS values (Fig. 2 B), defined as the levels of k1′ that cause 50% of the saturated response (peak maximum or steady-state respectively) at fixed k3′ values (see Eq. S16 in the Supporting Material). For k3′ ≫ 1, both quantities coincide because maximum activation in monotonic regimes occurs upon reaching steady state. However, in semiadaptive and adaptive regimes, EC50PEAK is larger than EC50SS. This shift, already apparent in the cross sections of Fig. 2 A, indicates that the late phase of the response in those regimes is not only weaker, but also saturates at lower input doses than the transient peak. These results suggest that due to a wider dynamic range (in absolute protein terms), the early phase is better suited than the late phase to transfer information about the amplitude of the stimulus. We also observed that in adaptive regimes, the integral of the output is also well suited for carrying amplitude information. This is because although the amplitude of the output depends on the input amplitude, the duration of the bulk of the output is constrained by the adaptive process. The more significant the adaptation, the lesser the contribution of the adapted IKKa level to the integral, and the better it reflects input amplitude in a manner that is independent of the input duration (see Fig. S5).
Distinct duration dose-response behavior by early and late phases
Information about extracellular stimulus may also be encoded in the duration of intracellular signals. To investigate the cycle’s ability to transfer duration information, we studied its response to square input pulses of different durations (Fig. 3 A). The duration dose-response relationship (i.e., the relationship between the duration of the IKK output and that of the input) was calculated by defining the duration of the output as the period of time for which the level of active IKK remains over an arbitrary signaling threshold (1/ξ for ξ > 1) (Fig. 3 B). The faithfulness with which the IKK cycle’s output duration tracks input duration is limited by three dynamical effects:
-
1.
A lag between input initiation and the moment IKKa reaches the threshold;
-
2.
A delay between input termination (tp) and the moment IKKa decays below the threshold; and
-
3.
The possibility that IKKa adapts below the threshold before the input terminates.
The first effect, the lag (δti) between input initiation and the moment the output reaches the threshold, is more pronounced at low input amplitudes or for thresholds requiring substantive IKK activation (Fig. 3 B and see Eq. S21 in the Supporting Material). For a threshold corresponding to 5% (ξ = 20) of the available IKK, the lag begins to be significant for k1′ < 1 (Fig. 3 B, left panel) reaching a value of 2 (typically the timescale for adaptation in k2 time units) at k1′ ∼ 10−1. For a 50% (ξ = 2) threshold, the lag is observed at higher k1′ values (Fig. 3 B, right panel). For low thresholds, the lag is independent of the regime but at higher thresholds, it becomes marginally longer for adaptive cycles. For a given input amplitude and threshold, the lag equals the minimum pulse duration capable of generating an output of nonzero duration (region I in Fig. 3 B). Output signals may fail to reach the threshold because the input amplitude is insufficient (dose-limited, region II), or because the pulse does not last long enough (duration-limited, region III).
The second effect that limits the faithfulness of the duration dose-response relationship, a termination delay, occurs when the level of IKKa (IKKatp) is higher than the threshold at the moment (tp) the input terminates. Upon input termination, the output decays exponentially with characteristic time of 1 (k2−1 in nontransformed time) and the time it takes it to decay below the threshold introduces a delay (δtd) between input and output termination (see Eq. S22 in the Supporting Material). IKKatp (and δtd) increases with tp (the duration of the pulse) during the initial phase of the output; it decreases with tp during the adaptation phase; and becomes independent of tp once the output reaches steady state (Fig. 3 C). Strong input pulses, even if short, produce IKKatp levels close to unity and the associated delay results in outputs that greatly outlast the input (i.e., temporal amplification). Input signals that terminate during the decaying phase of adaptive responses will see delays that decrease as input duration increases, reflecting the functional dependency of IKKatp on tp. Finally, for inputs long enough to drive the cycle to steady state (and if IKKa did not adapt below the threshold), IKKatp becomes the steady-state level IKKaSS. Under these conditions the delay increases with k1′ and k3′ (see Eq. S23 in the Supporting Material) indicating that for a given k1′, adaptive regimes will track input termination more faithfully. For strongly adaptive (k3′ ≪ 1) and semiadaptive regimes outside of the weak activation limit (k3′ ∼ < 1 < k1′), the delay is only weakly dependent on stimulus amplitude, and output duration becomes an almost exclusive function of input duration (Fig. 3 C, middle panel).
The third effect, namely IKKa falling bellow the threshold before the pulse ends, occurs in adaptive regimes when the threshold is set above the stimulus-dependent steady state (but below the early phase peak). In such cases, output duration is decoupled from input duration and depends only on k1′ and k3′ through their effect on the initial lag and rate of decay.
Together, the three effects described above produce a complex duration dose-response landscape (Fig. 3, D–F). The temporal amplification effect is most evident in the leftmost part of the cross-sections (Fig. 3 F). The plateau-like regions originate from decreasing δtd values during the decaying phase of the output compensating for longer input signals. These plateau regions constitute blind spots during which semiadaptive cycles lose the ability to relay information about the precise duration of the input signal. The span of the blind spot is determined by the difference between IKKatp and IKKaSS, which controls the range of pulse duration for which IKKatp is a decreasing function of tp. Finally, for sufficiently long signals, the output tracks the input with a constant (independent of input duration) delay unless it decays below the threshold during adaptation (horizontal lines in Fig. 3 F). We note that input duration can be tracked through the integral of the output of a cycle in an amplitude-dependent manner only in the monotonic regime. This is because in semi- and adaptive regimes the bulk of the integral is generated by the early phase of the output, which may severely desensitize this metric to subsequent signaling (see Fig. S6).
The analysis shows that, at high signaling thresholds, only quasi-monotonic cycles will reliably transfer duration information whereas, at lower thresholds, semiadaptive regimes can as well (beyond the blind spot). The results above reveal three key features of the regulatory cycle: The first is that regardless of the regime, stimulus duration could be greatly amplified by the very early phase of the cycle response in an input-amplitude-dependent manner. The second is that in the semiadaptive and monotonic regimes, the late phase response of a cycle can track stimulus duration accurately except for a delay that depends on the stimulus amplitude, whereas strongly adaptive cycles cannot do so. Finally, for the same k1, the delay is smaller and less dependent on the input amplitude in cycles operating semiadaptively. Taken together, these observations point to the semiadaptive regime as best suited for relaying stimulus-duration information in a manner that is less dependent on the stimulus amplitude.
Amplitude-duration interconversion
A signaling module may relay dynamic information by transmitting it faithfully (input amplitude to output amplitude, and duration to duration), or may transform it by encoding input amplitude, for example, as output duration or frequency. To study the potential of the kinase cycle for performing such transformations, we first analyzed the dependency of the output amplitude on the input duration using square pulses as inputs (Fig. 4 A). It is clear that interconversion between input duration and output amplitude is only possible for very brief input signals that terminate during the initial phase of the response (typically tp < 1 in transformed time units) independently of the regime. The relationship between the maximum amplitude of the output and input duration depends on the amplitude of the input (Fig. 4 B), which controls the rate of IKKa increase. As shown above, under this stimulation scenario the cycle output can significantly outlast the input signal. The opposite transformation, that is the conversion of input amplitude into response duration, is possible only for a limited range of amplitudes (Fig. 4, C and D) and is controlled by the effect of k1′ on the termination delay (δtd) and the initial lag (δti) (Fig. 3, B and C). The nonmonotonic nature of the delay (as a function of k1′) in adaptive cycles results in a nonmonotonic amplitude-duration relationship in that regime. The width of the initial phase peak also becomes narrower as the amplitude of the stimulus increases, contributing to the nonmonotonic relationship.
The results here suggest that a control cycle motif is good at not conflating amplitude-modulated stimuli from duration-modulated stimuli, and therefore its function is unlikely to be the interconversion of amplitude information into duration or vice versa. However, the fact that the duration of the early phase of the response in adaptive regimes is only weakly dependent on the stimulus amplitude for stimulus of moderate strength (or stronger) and lasting longer than the adaptation time (Fig. 1 D), suggests a function for the cycle more akin to a categorizer capable of taking a variety of input signals and producing a standardized response.
The three-state cycle response to repeated stimulation and oscillatory signals
When operating in monotonic regimes or in the weak activation limit, the cycle behaves like a reversible switch and can track or filter oscillations depending on their frequency and the kinetic parameters (already studied elsewhere (14,17)). When operating adaptively or semiadaptively, the response of the cycle to repeated stimulation is severely reduced above a critical frequency, because a large fraction of the molecules are sequestered in the refractory state. In these regimes, the critical frequency is determined by a relaxation time that is a function of k3′ (see Eq. S24 in the Supporting Material) (reflecting the fact that this constant controls the decay of the refractory species back to the poised state) and k1′ (which sets the amount of IKKi that must decay). For quasi-monotonic regimes (k3′ >1, k1′ > 1), the relevant relaxation scale is given by k2. A consequence of the above is that the late phase of an adaptive cycle's output is insensitive to noise up to very low frequencies (Fig. 5). Semiadaptive cycles, on the other hand, react to fluctuations asymmetrically, with potentially deep troughs but overshoots limited by the scarcity of poised molecules.
Adaptive or semiadaptive cycles function as categorizers for diverse dynamics of upstream signals
Experimental observations suggest that the regulatory cycle controlling IKK operates in a semiadaptive regime (9,10). Its role as a signaling hub linking multiple pathways means that IKK is exposed to a variety of upstream signals with different temporal profiles. To assess the ability of the IKK cycle to transfer information in these more complex stimulation scenarios, we simulated the response of a semiadaptive cycle (k3 = 0.1, k2 = 1) to a library of 4200 input profiles (Fig. 6, A and C) inspired by activity observed in signaling networks. Here, simulation time has been rescaled to reflect the timescales relevant for NFκB signaling. The impact of the cycle in the context of NFκB signaling was evaluated by using the IKK output curves as inputs for a previously published model of NFκB regulation (9) that produces temporal profiles of nuclear NFκB (Fig. 6 B). To quantify the ability to transfer information, we used information content and mutual information (Eqs. 3–5) metrics (reviewed in Rhee et al. (18) and Cover and Thomas (12)). These and similar metrics have been applied to the study of NFκB and other signaling networks (19,20). The metric quantifies how the diversity of the input library is preserved (or lost) at the IKK and NFκB levels. Calculation of mutual information requires the classification of input and output curves into amplitude bins (see Methods) at each time point. Even spread of both input and output curves among the amplitude bins indicates a significant potential for information transfer. A situation when all the output curves collapse into a smaller number of bins reflects a reduced ability to transfer information. The number (and hence size) of bins reflects the uncertainty inherent to the molecular processes affecting the pathway that limit the ability of downstream targets to determine the input amplitude.
Figure 6.
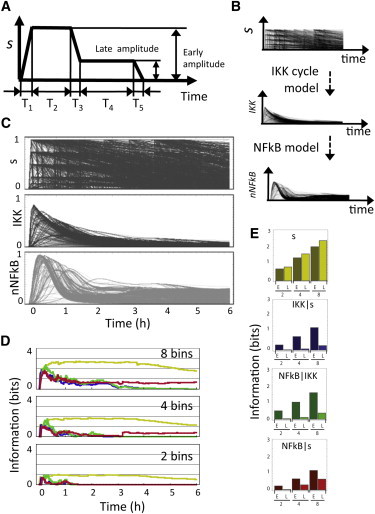
Information transfer in IKK-IkB-NFκB module. (A) A library of input functions defined by variations of five temporal and two amplitude parameters was used to stimulate the cycle. (B) The resulting time profiles of IKK activity were used as inputs to a model of NFκB regulation. (C) Input functions and the corresponding time courses of IKK and NFκB activity. (D) The information content metric for the input library (yellow) and the mutual information for IKK-Input, NFκB-IKK, and NFκB-Input (blue, green, and red, respectively), as a function of time at different levels of discretization (2, 4, and 8 bins corresponding to 1, 2, and 3 bits). (E) Average information content for the input (yellow) and mutual information for the early (t < 30′) and late (30′ < t < 360′) phases of the response at different discretization levels.
Visual inspection suggests that the set of IKK curves are less diverse than the input collection (Fig. 6 C). The mutual information metric for 8, 4, and 2 bins (equivalent to 3, 2, and 1 bit, respectively) confirms these observations (Fig. 6 D) and further indicates that information is well preserved during the initial phase of the response but significant loss occurs after 30 min (Fig. 6 E). The metric correctly identifies a period early during the response in which the activity of the cycle stores information about a stimulus that already decayed (temporal amplification effect). The analysis shows that there is little information loss between IKK and NFκB (Fig. 6, D and E). In fact, the increased levels during the late NFκB response compared to IKK’s are artifactual and arise as a consequence of the high sensitivity of the NFκB response to low levels of IKK.
The impact of the cycle on the duration dose response of NFκB is analyzed in Fig. S7.
Discussion
In this study, we demonstrated that the three-state cycle motif can function in three main operational regimes: monotonic, semiadaptive, and strongly adaptive. An important property of this motif is that, outside of the weak activation limit, the operational regime does not depend on the intensity of the stimulus and is largely determined by the rate of recycling (relative to deactivation). This is in marked contrast with motifs based on negative-feedback loops that, at least in principle, can transition from semiadaptive to quasi-monotonic regimes in response to sufficiently intense stimuli (21). Thus, a signaling network containing a cycle motif could operate with markedly different yet well-defined dynamics in cells expressing different levels of the enzymes involved in recycling, making this simple motif a very flexible building module. The ability to generate signals with two amplitude levels could allow semiadaptive cycles to function as specificity switches that activate alternative downstream pathways as the signaling event progresses (22,23). Moreover, the recycling process itself could be regulated in a cell-state-dependent manner and cause a pathway containing a cycle to produce transient, sustained, or biphasic (i.e., with two distinct phases) signals depending on the cellular context. Because signal dynamics have been shown to be important for controlling the specificity of the response in several systems (9,24–27), it is tempting to speculate that cycles could function to control the specificity of a signal (28,29) according to the cellular needs.
Our description of a cycle in terms of three single-step reactions may be unrealistic; however, multistep cycles, under simplifying assumptions, produce the same basic behavior (see the Supporting Material). In fact, contemporary understanding of IKK regulation involves several stages of complex formation and dissociation, as well as phosphorylation and ubiquitination (1) (see Fig. S8 A). Despite the extra layers of complexity, the dynamics of IKK in the multistate cycle may be understood in terms of those of the three-state counterpart (see Fig. S8, B–E), although the presence of two activating signals and a feedback loop can introduce additional behaviors such as activation delays (see Fig. S8 F). Our results suggest inhibitor SC-514 (see Fig. S1) affects k3′ ex vivo, by either promoting recycling or inhibiting the inactivation step. The second scenario is the most likely, given the known function of the drug, which is consistent with the presence of a self-catalytic step during deactivation (1,2).
The results presented here can be extended to systems in which the refractory state is induced by spatial constraints. For example, a transcription factor that, upon activation in the cytoplasm, translocates to the nucleus where it is deactivated, could be represented as a three-state cycle if reactivation requires nuclear export. Such a mechanism is present in a latent manner in the NFκB signaling network, in which negative regulators of the IκB family bind NFκB in the nucleus but cannot be degraded (and release NFκB again) until exported to the cytoplasm (30). A similar motif is found in the interferon-responsive STAT signaling system (31), where it has been shown that changes in nuclear export rates affect the sensitivity of STAT’s activity to cytokine levels (32). Similarly, receptor recycling upon ligand-induced internalization, as observed for members of the TLR family (33,34) and others, enables further rounds of activation. Finally, the dissociation of multisubunit signaling complexes after stimulation is prevalent in signaling systems including GPCR-mediated pathways. Reassociation may be required for reactivation of the signal-propagating subunit after the initial load of GTP is hydrolyzed. Depending on the relative rates of activation, hydrolysis (deactivation), and complex formation (recycling), G-protein regulation could operate as a three-state cycle for which the deactivation rate can be regulated by RGS proteins (35) and the recycling rate by arrestins (36) displaying tissue specific expression.
The regime in which the cycle motif operates determines which features of the upstream signals are likely to be meaningful for determining the cellular response. Here we showed that a system operating in a semiadaptive regime tends to transfer both amplitude and duration information relatively unchanged. Specifically, inputs lasting longer than the adaptation characteristic time are transduced by both early and late phases. The phase of the output relevant for signaling depends on the downstream targets responsible for decoding. Amplitude information encoded in the early phase of a cycle operating in an adaptive regime is present only transiently, requiring downstream targets with fast responses. Amplitude information encoded in the late phase could be present for extended periods of time, but because the dynamic range of the cycle response is compressed in terms of IKK activity levels, a more sensitive downstream target is required for extracting the information. Such a sensitive target is likely to be saturated by the early peak and therefore, in those cases, one can assume that the amplitude of the early phase is not relevant for the response.
It is important to emphasize that the early phase of the response is a transient (in the mathematical sense) and therefore its exact temporal profile and associate dose responses are highly dependent on the way the cycle is stimulated. Stimuli that increase gradually may drive the cycle close to quasi-equilibrium and will not produce a transient peak. Furthermore, the amplitude of the early phase in adaptive and semiadaptive regimes also depends on the level of basal activity, as this determines the fraction of molecules in the refractory state that are unavailable for signaling. These characteristics limit the conditions under which the early phase amplitude can function as a carrier of signal input information unless upstream activity is standardized, for example, by always appearing with the same temporal profile. In contrast, late phase activity is a steady-state feature and does not depend on how the input arose.
The cycle’s ability to transfer information about the duration of an input signal depends on the regime and on the actual input duration. For inputs lasting beyond the adaptation time, input duration can be transferred as output duration by cycles operating in quasi-monotonic and semiadaptive regimes. Obviously, when operating in a strongly adaptive regime, IKK cannot transfer any information about upstream activity beyond the early phase of the response. Cycles operating in the semiadaptive regime can track input duration more faithfully than a similar monotonic cycle (same k2) because of a shorter termination delay. For inputs that terminate during the cycle's initial activation, the cycle can generate responses that are significantly longer-lived, a phenomenon we referred to as temporal amplification (8). This is a general phenomenon (37) because, at such short timescales, the dynamics are controlled mainly by activation and deactivation. In this case, the cycle can interconvert between amplitude and duration, but because of the complex interdependence it can be quantitatively meaningful only when upstream activity is always expected to appear at consistent levels (e.g., saturating levels) or with a particular duration. Recently published data indicates the information transmission capacity of the TNF/NFκB signaling pathway in terms of signal amplitude is very limited (19). Based on our finding that the late phase of IKK signaling is capable of transferring information about duration, it is interesting to speculate that the duration of the late phase could be responsible for conveying additional information that could ultimately drive a significant fraction of the large set of stimulus-specific NFκB-mediated processes.
Oscillatory responses have been observed in a number of signaling pathways, including the NFκB response to the cytokine TNF (38–40). In this study, we did not focus on the cycle as a generator of oscillatory signals. It has been shown, however, that in the presence of autocatalytic steps (a condition that may apply for IKK), the cycle can produce oscillatory responses (41). It is also clear, though, that adaptive and semiadaptive regimes are not well suited for relaying high-amplitude oscillations or fluctuations with period shorter than the recycling timescale. A critical quantity based on the difference between the activation and deactivation timescales has recently been developed for characterizing the response of biological networks to input fluctuations (42). The metric has been successfully applied to networks containing multiple feedback loops in steady state but the additional timescale introduced by the recycling reaction complicates its application to cycle-like motifs. Given its past success, it would be very useful to expand the metric to account for refractory states and the out-of-equilibrium phase of a response.
Taken together, our findings suggest the hypothesis that target genes, the ultimate recipients of the signal information, that are responsive to transient NFκB will likely distinguish different amplitudes of the NFκB response. However, target genes requiring the second phase of NFκB will be better at distinguishing between different durations of NFκB activity than the actual amplitude. Furthermore, it follows from our results that under some conditions, early and late amplitudes can be affected quasi-independently, which raises interesting possibilities. For example, for a cycle with wild-type parameters k1′ = k3′ = 10 (quasi-monotonic regime. Fig. 1 C), a genetic (or pharmacological) perturbation that inhibits recycling 100-fold would bring the system well into the adaptive region, suppressing late-term activity but leaving peak amplitude largely unaffected. Conversely, because of the dose-response shift between the early and late phases of the output (Fig. 2 A), a perturbation that partially inhibits activation can reduce the amplitude of the early peak with only minor effects on the steady-state level. These effects could be exploited for modifying signals for therapeutic purposes or to manipulate the input in order to explore biophysical processes occurring downstream of the cycle. This possibility is especially interesting in the context of temporal control of signal specificity discussed above. These effects could also be used as a guide to investigate the origin of phenotypes characterized by aberrant signals in networks incorporating cycles or identify the mechanism of action of novel drugs.
Conclusions
Understanding which dynamic features of a signal are relevant and which ones are superfluous for the physiological response remains a key challenge that has relevance for future diagnostics and drug targeting. Taken together, the results presented here show that the three-state cycle can relay both amplitude and duration information but in a regime-dependent manner. On the one hand, in adaptive regimes, the early transient phase of the response tends to obfuscate duration information but have a larger dynamic range in terms of amplitude; this phase depends critically on the way the stimulus appears and on the stimulation history. On the other hand, the late phase has a much more reduced dynamic range in amplitude, but can track duration more accurately and is not dependent on the stimulation history. Although which features are relevant in a specific biological setting will depend on the capabilities of the downstream targets doing the decoding, our results suggest that in a pathway containing a semiadaptive cycle subject to a sustained input (like in the IKK-NFκB case), the amplitude of the early phase is the primary carrier of information about the amplitude of the stimulus, and the duration of the late phase is the primary carrier of information about its duration.
It must be kept in mind, however, that downstream targets could be optimized to respond in a quantitative manner to the weaker outputs in the adaptive phase and therefore be insensitive to precise amplitude of the early phase (and its dependence on the input history). Operating in a semi- or strongly-adaptive regime, a cycle functions as a modulator transforming a variety of upstream dynamics into a more restricted set of dynamical responses (e.g., turning chronic signals into transient ones) and thus, it can be viewed as a categorizing stage producing signals of consistent duration (early phase), or consistent amplitude (late phase). Overall, the three-state cycle is a functionally flexible regulatory motif able to generate distinct dynamic responses, potentially in a cell-type- or condition-specific manner through the regulation of the recycling enzymes.
Acknowledgments
The authors thank Dr. Shannon Werner for providing data for the pharmacological inhibitors, and P. Loriaux and anonymous reviewers for their constructive comments including the suggestion that the two phases of the cycle response might be relevant for regulating signal specificity.
This work was supported by the National Institutes of Health (grants No. R01 CA141722, No. R01 GM08997, and No. P50 GM085764) and a Cancer Research Institute postdoctoral research fellowship to M.B.
Supporting Material
References
- 1.Hayden M.S., Ghosh S. Shared principles in NF-κB signaling. Cell. 2008;132:344–362. doi: 10.1016/j.cell.2008.01.020. [DOI] [PubMed] [Google Scholar]
- 2.Delhase M., Hayakawa M., Karin M. Positive and negative regulation of IκB kinase activity through IKKβ subunit phosphorylation. Science. 1999;284:309–313. doi: 10.1126/science.284.5412.309. [DOI] [PubMed] [Google Scholar]
- 3.Palkowitsch L., Leidner J., Marienfeld R.B. Phosphorylation of serine 68 in the IκB kinase (IKK)-binding domain of NEMO interferes with the structure of the IKK complex and Tumor Necrosis Factor-α -induced NFκB activity. J. Biol. Chem. 2008;283:76–86. doi: 10.1074/jbc.M708856200. [DOI] [PubMed] [Google Scholar]
- 4.Kray A.E., Carter R.S., Wadzinski B.E. Positive regulation of IκB kinase signaling by protein serine/threonine phosphatase 2A. J. Biol. Chem. 2005;280:35974–35982. doi: 10.1074/jbc.M506093200. [DOI] [PubMed] [Google Scholar]
- 5.Broemer M., Krappmann D., Scheidereit C. Requirement of Hsp90 activity for IκB kinase (IKK) biosynthesis and for constitutive and inducible IKK and NF-κB activation. Oncogene. 2004;23:5378–5386. doi: 10.1038/sj.onc.1207705. [DOI] [PubMed] [Google Scholar]
- 6.Hinz M., Broemer M., Scheidereit C. Signal responsiveness of IκB kinases is determined by Cdc37-assisted transient interaction with Hsp90. J. Biol. Chem. 2007;282:32311–32319. doi: 10.1074/jbc.M705785200. [DOI] [PubMed] [Google Scholar]
- 7.Lipniacki T., Puszynski K., Kimmel M. Single TNFα trimers mediating NF-κB activation: stochastic robustness of NF-κB signaling. BMC Bioinformatics. 2007;8:376. doi: 10.1186/1471-2105-8-376. [DOI] [PMC free article] [PubMed] [Google Scholar]
- 8.Werner S.L., Kearns J.D., Hoffmann A. Encoding NF-κB temporal control in response to TNF: distinct roles for the negative regulators IκBα and A20. Genes Dev. 2008;22:2093–2101. doi: 10.1101/gad.1680708. [DOI] [PMC free article] [PubMed] [Google Scholar]
- 9.Werner S.L., Barken D., Hoffmann A. Stimulus specificity of gene expression programs determined by temporal control of IKK activity. Science. 2005;309:1857–1861. doi: 10.1126/science.1113319. [DOI] [PubMed] [Google Scholar]
- 10.Cheong R., Bergmann A., Levchenko A. Transient IκB kinase activity mediates temporal NF-κB dynamics in response to a wide range of tumor necrosis factor-α doses. J. Biol. Chem. 2006;281:2945–2950. doi: 10.1074/jbc.M510085200. [DOI] [PubMed] [Google Scholar]
- 11.Hoffmann A., Levchenko A., Baltimore D. The IκB-NF-κB signaling module: temporal control and selective gene activation. Science. 2002;298:1241–1245. doi: 10.1126/science.1071914. [DOI] [PubMed] [Google Scholar]
- 12.Cover T.M., Thomas J.A. Wiley-Interscience; Hoboken, NJ: 2006. Elements of Information Theory. [Google Scholar]
- 13.Heinrich R., Neel B.G., Rapoport T.A. Mathematical models of protein kinase signal transduction. Mol. Cell. 2002;9:957–970. doi: 10.1016/s1097-2765(02)00528-2. [DOI] [PubMed] [Google Scholar]
- 14.Gomez-Uribe C., Verghese G.C., Mirny L.A. Operating regimes of signaling cycles: statics, dynamics, and noise filtering. PLOS Comput. Biol. 2007;3:e246. doi: 10.1371/journal.pcbi.0030246. [DOI] [PMC free article] [PubMed] [Google Scholar]
- 15.Esch R.K., Errede B. Pheromone induction promotes Ste11 degradation through a MAPK feedback and ubiquitin-dependent mechanism. Proc. Natl. Acad. Sci. USA. 2002;99:9160–9165. doi: 10.1073/pnas.142034399. [DOI] [PMC free article] [PubMed] [Google Scholar]
- 16.Noubir S., Hmama Z., Reiner N.E. Dual receptors and distinct pathways mediate interleukin-1 receptor-associated kinase degradation in response to lipopolysaccharide. Involvement of CD14/TLR4, CR3, and phosphatidylinositol 3-kinase. J. Biol. Chem. 2004;279:25189–25195. doi: 10.1074/jbc.M312431200. [DOI] [PubMed] [Google Scholar]
- 17.Locasale J.W. Signal duration and the time scale dependence of signal integration in biochemical pathways. BMC Syst. Biol. 2008;2:108. doi: 10.1186/1752-0509-2-108. [DOI] [PMC free article] [PubMed] [Google Scholar]
- 18.Rhee A., Cheong R., Levchenko A. The application of information theory to biochemical signaling systems. Phys. Biol. 2012;9:045011. doi: 10.1088/1478-3975/9/4/045011. [DOI] [PMC free article] [PubMed] [Google Scholar]
- 19.Cheong R., Rhee A., Levchenko A. Information transduction capacity of noisy biochemical signaling networks. Science. 2011;334:354–358. doi: 10.1126/science.1204553. [DOI] [PMC free article] [PubMed] [Google Scholar]
- 20.Hormoz S. Cross talk and interference enhance information capacity of a signaling pathway. Biophys. J. 2013;104:1170–1180. doi: 10.1016/j.bpj.2013.01.033. [DOI] [PMC free article] [PubMed] [Google Scholar]
- 21.Behar M., Hao N., Elston T.C. Mathematical and computational analysis of adaptation via feedback inhibition in signal transduction pathways. Biophys. J. 2007;93:806–821. doi: 10.1529/biophysj.107.107516. [DOI] [PMC free article] [PubMed] [Google Scholar]
- 22.Haney S., Bardwell L., Nie Q. Ultrasensitive responses and specificity in cell signaling. BMC Syst. Biol. 2010;4:119. doi: 10.1186/1752-0509-4-119. [DOI] [PMC free article] [PubMed] [Google Scholar]
- 23.Bardwell L., Zou X., Komarova N.L. Mathematical models of specificity in cell signaling. Biophys. J. 2007;92:3425–3441. doi: 10.1529/biophysj.106.090084. [DOI] [PMC free article] [PubMed] [Google Scholar]
- 24.Marshall C.J. Specificity of receptor tyrosine kinase signaling: transient versus sustained extracellular signal-regulated kinase activation. Cell. 1995;80:179–185. doi: 10.1016/0092-8674(95)90401-8. [DOI] [PubMed] [Google Scholar]
- 25.Sabbagh W., Jr., Flatauer L.J., Bardwell L. Specificity of MAP kinase signaling in yeast differentiation involves transient versus sustained MAPK activation. Mol. Cell. 2001;8:683–691. doi: 10.1016/s1097-2765(01)00322-7. [DOI] [PMC free article] [PubMed] [Google Scholar]
- 26.Kubota H., Noguchi R., Kuroda S. Temporal coding of insulin action through multiplexing of the AKT pathway. Mol. Cell. 2012;46:820–832. doi: 10.1016/j.molcel.2012.04.018. [DOI] [PubMed] [Google Scholar]
- 27.Purvis J.E., Lahav G. Encoding and decoding cellular information through signaling dynamics. Cell. 2013;152:945–956. doi: 10.1016/j.cell.2013.02.005. [DOI] [PMC free article] [PubMed] [Google Scholar]
- 28.Komarova N.L., Zou X., Bardwell L. A theoretical framework for specificity in cell signaling. Mol. Syst. Biol. 2005;1:2005. doi: 10.1038/msb4100031. 0023. [DOI] [PMC free article] [PubMed] [Google Scholar]
- 29.Behar M., Dohlman H.G., Elston T.C. Kinetic insulation as an effective mechanism for achieving pathway specificity in intracellular signaling networks. Proc. Natl. Acad. Sci. USA. 2007;104:16146–16151. doi: 10.1073/pnas.0703894104. [DOI] [PMC free article] [PubMed] [Google Scholar]
- 30.Hoffmann A., Natoli G., Ghosh G. Transcriptional regulation via the NF-κB signaling module. Oncogene. 2006;25:6706–6716. doi: 10.1038/sj.onc.1209933. [DOI] [PubMed] [Google Scholar]
- 31.Meyer T., Vinkemeier U. Nucleocytoplasmic shuttling of STAT transcription factors. Eur. J. Biochem. 2004;271:4606–4612. doi: 10.1111/j.1432-1033.2004.04423.x. [DOI] [PubMed] [Google Scholar]
- 32.Lödige I., Marg A., Vinkemeier U. Nuclear export determines the cytokine sensitivity of STAT transcription factors. J. Biol. Chem. 2005;280:43087–43099. doi: 10.1074/jbc.M509180200. [DOI] [PubMed] [Google Scholar]
- 33.Mantovani A., Garlanda C., Vecchi A. Regulatory pathways in inflammation. Autoimmun. Rev. 2007;7:8–11. doi: 10.1016/j.autrev.2007.03.002. [DOI] [PubMed] [Google Scholar]
- 34.Haugh J.M., Lauffenburger D.A. Analysis of receptor internalization as a mechanism for modulating signal transduction. J. Theor. Biol. 1998;195:187–218. doi: 10.1006/jtbi.1998.0791. [DOI] [PubMed] [Google Scholar]
- 35.Dohlman H.G., Thorner J. RGS proteins and signaling by heterotrimeric G proteins. J. Biol. Chem. 1997;272:3871–3874. doi: 10.1074/jbc.272.7.3871. [DOI] [PubMed] [Google Scholar]
- 36.Shukla A.K., Xiao K., Lefkowitz R.J. Emerging paradigms of β-arrestin-dependent seven transmembrane receptor signaling. Trends Biochem. Sci. 2011;36:457–469. doi: 10.1016/j.tibs.2011.06.003. [DOI] [PMC free article] [PubMed] [Google Scholar]
- 37.Hornberg J.J., Bruggeman F.J., Westerhoff H.V. Principles behind the multifarious control of signal transduction. ERK phosphorylation and kinase/phosphatase control. FEBS J. 2005;272:244–258. doi: 10.1111/j.1432-1033.2004.04404.x. [DOI] [PubMed] [Google Scholar]
- 38.Nelson D.E., Ihekwaba A.E., White M.R. Oscillations in NF-κB signaling control the dynamics of gene expression. Science. 2004;306:704–708. doi: 10.1126/science.1099962. [DOI] [PubMed] [Google Scholar]
- 39.Ashall L., Horton C.A., White M.R. Pulsatile stimulation determines timing and specificity of NF-κB-dependent transcription. Science. 2009;324:242–246. doi: 10.1126/science.1164860. [DOI] [PMC free article] [PubMed] [Google Scholar]
- 40.Tay S., Hughey J.J., Covert M.W. Single-cell NF-κB dynamics reveal digital activation and analogue information processing. Nature. 2010;466:267–271. doi: 10.1038/nature09145. [DOI] [PMC free article] [PubMed] [Google Scholar]
- 41.Fernandez B., Tsimring L.S. Athermal dynamics of strongly coupled stochastic three-state oscillators. Phys. Rev. Lett. 2008;100:165705. doi: 10.1103/PhysRevLett.100.165705. [DOI] [PubMed] [Google Scholar]
- 42.Wang L., Xin J., Nie Q. A critical quantity for noise attenuation in feedback systems. PLOS Comput. Biol. 2010;6:e1000764. doi: 10.1371/journal.pcbi.1000764. [DOI] [PMC free article] [PubMed] [Google Scholar]
Associated Data
This section collects any data citations, data availability statements, or supplementary materials included in this article.